Article
J. Braz. Chem. Soc., Vol. 26, No. 4, 775-783, 2015. Printed in Brazil - ©2015 Sociedade Brasileira de Química 0103 - 5053 $6.00+0.00
A
*e-mail: [email protected]
Performance Evaluation of a Portable Laser-Induced Fluorescence Spectroscopy
System for the Assessment of the Humification Degree of the Soil Organic Matter
Cleber H. dos Santos,*,a,b Renan A. Romano,a,c Gustavo Nicolodelli,a
Camila M. Carvalho,a,c Paulino R. Villas-Boas,a Ladislau Martin-Neto,a
Célia R. Montes,d Adolpho J. Melfie and Débora M. B. P. Miloria
aEmbrapa Instrumentação, P.O. Box 741, 13560-970 São Carlos-SP, Brazil
bInstituto de Química de São Carlos, Universidade de São Paulo,
P.O. Box 780, 13560-970 São Carlos-SP, Brazil
cInstituto de Física de São Carlos, Universidade de São Paulo,
P.O. Box 369, 13560-970 São Carlos-SP, Brazil
dCentro de Energia Nuclear na Agricultura and eInstituto de Energia e Ambiente, NUPEGEL,
Universidade de São Paulo, P.O. Box 09, 13418-900 Piracicaba-SP, Brazil
Laser-induced fluorescence spectroscopy (LIFS) has shown advantages for analyses of whole soil, providing results about chemical structure of soil organic matter (SOM) without the need for a chemical fractionating process; thus, allowing direct analysis of soils. Moreover, another advantage is the potential for the development of portable systems, which could be usable in field analyses. The aim of this paper is to evaluate the performance of a portable LIFS system to assess the humification degree (HD) of SOM. A good correlation (R > 0.8) was obtained for results (HD) achieved using the proposed portable system and a conventional fluorescence spectrometric method for humic acid. In addition, the results obtained using the portable LIFS system statistically agreed with the ones achieved using a benchtop LIFS system already described in the literature for such application (R = 0.953). Thus, the portable LIFS system constitutes an affordable option for the in situ characterization of SOM.
Keywords: laser-induced fluorescence spectroscopy, humic acid, soil organic matter, humification degree
Introduction
Nowadays, the concern about soil quality has increased considerably due to environmental problems related to land degradation and sustainable agricultural production. However, the definition of soil quality and the development of techniques for such evaluation is an important challenge for science. The impact of agriculture on soil quality may be assessed indirectly through the measurement of soil characteristics (indicator of quality), which may allow comparisons with soils under native vegetation or among
different soil managements.1
Soil organic matter (SOM) represents one of the main pools of the carbon on earth and has a key role on
the carbon cycling.2-4 SOM comprises humic substances
(HS) and non-humic substances. However, an important information, often disregarded when studying SOM, is the soil humification degree (HD).
Among the different analytical techniques that could be used to characterize the humification degree of organic materials, absorption spectrophotometry in the UV-Vis
region,5-8 electron paramagnetic resonance (EPR),9-13
Fourier transform infrared spectroscopy (FTIR),8,14-16
13C nuclear magnetic resonance (NMR) and conventional
fluorescence spectroscopy are able to provide information which have a straight correlation to humification degree of
humic acid (HA).14,15,17-24 For instance, EPR provides the
semiquinone-type free radical concentration and 13C NMR
provides information of the degree of aromaticity.8,25,26
is present of them in the original sample.27,28 Furthermore,
sample preparation is labor-intensive, increasing analysis time and cost.
With regard to agricultural and environmental issues, it is extremely important to develop an analytical method able to provide a high analytical frequency (number of samples
analyzed per unit of time) and able to meet the demand for
information on HD and SOM.
This study makes a contribution of special interest for analytical chemistry because the portable laser-induced fluorescence spectroscopy system (LIFS) is a very promising technique to assess the HD of organic matter (OM) in whole soil samples and OM insoluble, as the humin.
Currently, in the literature, there is no technique able to determine the humification degree of the whole OM and the most of existing studies use HA, which represents only a fraction of the bulk SOM. Information based on humin, insoluble fraction of HS and that compose more than 80% of the humic material from SOM, is not
reliable as measurements made using 13C NMR and EPR
suffer interference due to the presence of high levels of clay materials, iron oxide and other minerals that are paramagnetic, causing reduction in the relaxation times
and degrading the resolution of the spectra.13,26,29 The
advantage of LIFS is that it is a technique that enables the direct optical probing of substances in solid materials and can enable information on HD of the whole OM without the need for extraction and fractionation of HS from soil.
Several humification indexes based on fluorescence
spectroscopy have been proposed.21,22,24 Zsolnay et al.,22
working with dissolved organic matter extracted from soil, proposed a humification index based on the ratio of the signals (integrated area) of the emission bands measured
between 570 to 641 nm (A4) and between 356 to 432 nm
(A1), using excitation as 240 nm. This index is referred as
A4/A1. This definition is based on the fact that humification
can be associated to an increasing of C/H ratio and a shift
to longer fluorescence emission wavelengths.8,30,31 The
theoretical background can be found inHaken and Wolf32
and are corroborated by the analysis of literature data.33-35
Kalbitz et al.21 and Milori et al.24 also defined
humification indexesbased on the spectral characteristics
of humic acids in solubilized samples, they proposed
another humification index denominated I400/ I360, based on
the ratio of fluorescence intensities measured respectively
at 400 nm (I400) and at 360 nm (I360). Alternatively, it was
used a similar index I470/I360 with these intensities measures
using fluorescence synchronous scanning in order to
improve spectral selectivity.Milori et al.24 presented the
third humification index by measuring the fluorescence
emission spectra of solubilized humic acids using excitation
at 465 nm, index denominated A465.
LIFS has been used to assess the humification index
of SOM in whole soil samples.36 The method is promising
because it enables fast acquisition of results relying on the direct probing of the solid sample, allowing the assessment
of OM associated with minerals in the soil matrix.26 The
results are in agreement with the ones obtained using other spectroscopic approaches such as conventional fluorescence
spectroscopy, EPR and 13C NMR.24,26,36According to
González-Pérez et al.,26 LIFS is a promising technique for
OM studies with whole Oxisol samples. It is sensitive and allows rapid analysis of samples without any prior chemical
treatment.36-40
The proposed LIFS method relies on the excitation
of SOMusing a laser in the near ultraviolet-blue region
(350-480 nm), which coincides with the absorption profile
of more rigid and complex molecules of HS,24,41 such as
aromatics and heterocyclic compounds. The aim of this study was to evaluate the performance of a lab-made portable LIFS system for the assessment of the humification degree of the SOM. The results of the portable LIFS system were compared with the values of humification degree of HA extracted from the same samples and determined by
fluorescence spectroscopy methods.21,22,24 The performance
of the portable system was also compared to a benchtop
LIFS system similar to that described by Milori et al.36
Experimental
Experimental samples
Soil used in this study was the Typic Hapludults, cultivated with Tifton 85 Bermudagrass. The field experiment was located in the city of Lins, São Paulo. A set of soil samples with low carbon content was collected from six depths: 0-10 cm, 10-20 cm, 20-40 cm, 40-60 cm, 60-80 cm and 80-100 cm, being used a total of 36 samples (6 sets with 6 samples each). The samples were named A1 to A36.
This set of samples was chosen due to its variation of humification degree of SOM.
Total organic carbon (TOC)
In the laboratory, the soil samples were sieved to remove roots and ground to obtain particles smaller than 0.15 mm. For this analysis, aliquots of 100 mg of each of the six samples of soil were used for all treatments. These aliquots were oxidized at 900 °C using a flow rate of
TOC was performed in triplicate for samples of whole soil. The measurements were performed using a Total Organic Carbon Analyzer, TOC-V Model, Shimadzu Model, coupled to a Solid Sample Module, SSM-500A, Shimadzu.
Humification degree of humic acids assessed by conventional fluorescence spectroscopy
The HAs were extracted according to the procedure advised by the International Humic Substances Society
(IHSS).42
The HAs were brought to a concentration of 20 mg L−1
and the pH was adjusted to 8.0 by diluting them in a solution
of NaHCO3 0.05 mol L
−1. This concentration of 20 mg L−1
was used to minimize post-filter effect and guarantee that analytical response is within its linear range.
Normal fluorescence spectra and synchronous fluorescence spectra (excitation band) were acquired using a Perkin Elmer Luminescence Spectrometer LS 50 B spectrofluorophotometer (right angle geometry, 1 cm × 1 cm quartz cell) using a 1 cm optical pathlength quartz cuvette, spectral band pass of 10 nm and scan
velocity of 500 nm min−1 for both excitation and emission.
To obtain the A4/A1 humification index, the emission
spectra were scanned from 300 to 700 nm with excitation at
240 nm. The A4/A1 ratio was calculated from the integrated
area measured in the last quarter of the emission spectrum
(570-641 nm) and the first quarter (356-432 nm).22 In
this study, synchronous scan excitation spectra were
acquired over a range of 220 to 650 nm using a ∆λ of
55 nm and the humification index was calculated by the ratio of the fluorescence intensities measured at 468 and
374 nm (I468/I374).21To obtain the A465 humification index,
the emission spectra were obtained over a range of 480 to 800 nm using an excitation wavelength of 465 nm. In this case, the humification degree was calculated using the total
area of emission (A465).24
Humification degree of SOM assessed using LIFS
After the sample collection was performed, the samples were dried at room temperature, passed through a 100-mesh sieve and ground. After this, around 0.5 g from each
sample was submitted to 10 ton cm−2 of pressure for 2 min
to form pellets. For each soil sample, two pellets were prepared. Each pellet was placed in a sample holder with a quartz window and was measured using the benchtop and portable LIFS system.
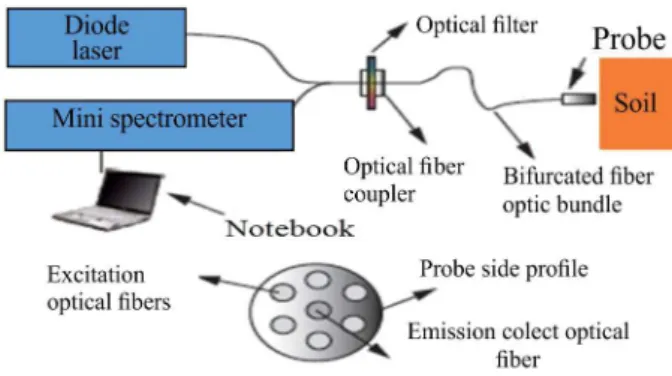
The portable LIFS system is also a lab-made equipment developed by Embrapa Instrumentantion at the Lasers and Optics Laboratory for this application (Figure 1). It
comprises a diode laser (Coherent - CUBE) emitting at 405 nm (50 mW), an optical shutter, a bifurcated optical fiber bundle with seven optical fibers in a stainless steel ferrule: six illumination fibers around one read fiber (Ocean Optics), a high sensitivity mini-spectrometer (USB4000 - Ocean Optics), an adjustable optical filter, and a notebook. The resolution of the system was around 10 nm for all acquisition ranges (475-800 nm). In addition, a software was developed to control the laser, the shutter, and spectrometer parameters such as integration time and number of averages for each measurement.
The benchtop LIFS equipment is a lab-made system
similar to that described by Milori et al.36 In this paper, LIFS
operation parameters were: (i) lock-in amplifier 100 mW,
(ii) photomultiplier tube type of detector operating at
850 V, (iii) the laser used is an argon laser manufactured by
Coherent; model Innova 90, tuned for emission at 458 nm
blue region to excite soil fluorescence and (iv) 400 mW
laser power. The spectral resolution was adjusted to 4 nm
for all acquisition ranges (470-650 nm).36
For both LIFS equipment, the ratio between the area under fluorescence emission spectrum (FEA) (range 475 and 800 nm) and TOC concentration in the sample was
considered as an indicator of humification of SOM (HD).36
The measurements were made in triplicate for each soil sample. The same soil pellets used in the benchtop system were measured to validate the portable system.
Comparison among methods
Fluorescence methods to assess humification degree of humic acid were compared: conventional fluorescence
index21,22,24 and laser induced fluorescence index.36
The humification degree of SOM assessed by portable LIFS system using whole soil was compared to humification degree of humic acid determined in solution by conventional methods of fluorescence spectroscopy.
Moreover, considering the benchtop LIFS system
similar to that described by Milori et al.,36 the portable
system was valued using basic statistical treatments. The calibration curve was fitted by the least squares method (LSM) using the HD obtained from the benchtop LIFS system as the independent variables and the HD obtained from the portable LIFS system as the dependent variables. The samples used to obtain the calibration model were the A1 to A30. For validation, the samples used were A31 to A36.
Results and Discussion
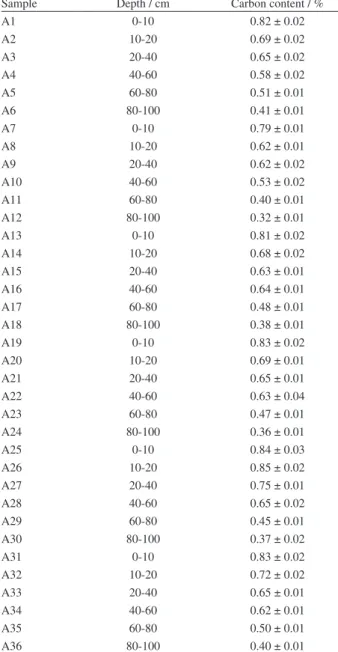
Organic carbon contents of samples are shown in Table 1. As can be seen, the used samples have low quantities of carbon, and the carbon content decreases with
soil samples depth. Figure 2 presents typical spectra of fluorescence emission for whole soils and HA in solution. For HA, it was possible to observe changes in spectral profiles and emission intensities. In the presented example, variations in intensity reached a factor of 5 (Figure 2a, 2b and 2c). From the data of carbon obtained by TOC (Table 1) and the fluorescence spectrum area, the HD was determined for the diferent methods mentioned above. A comparison among methods to assess humification degree of HA is
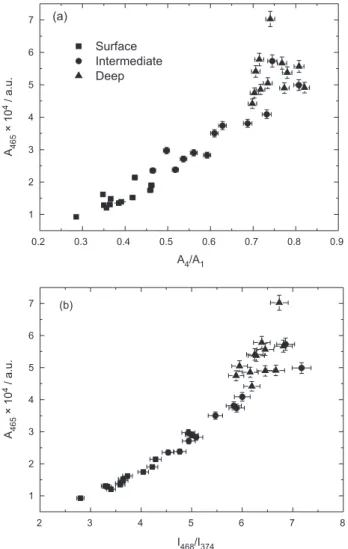
shown in Figure 3. The correlation among indexes (A465,
A4/A1 and I468/I374, Figure 3) can be considered very strong
(R ≥ 0.95, with *p < 0.0001).
It is important to highlight that the three methods that use fluorescence are basically different from each other.
While the method of Zsolnay et al.22 uses ultraviolet
excitation, where several groups of HA are excited, the
method proposed by Milori et al.24 excludes a great portion
of the groups, being, therefore, more selective. Although the emission spectrum with excitation at 240 nm is wide (Figure 2a), it presents changes in the spectral profile, while the emission spectrum with excitation at 465 nm is narrower (Figure 2b), possessing the same spectral profile.
When the synchronous-scan is carried out, Kalbtiz et al.21
method is also more selective than Zsolnay et al.22 method,
because it specifically shows a resonance whose difference between the excitation and emission is 55 nm (Figure 2c).
For analysis using whole soil, it was observed mainly changes in intensity of fluorescence emission. When excited at 458 nm, LIFS emission spectrum of whole soil samples shows a single broad band from 470 to 650 nm (Figure 2e),
quite similar to those reported for HAs fluorescence spectra.24
These spectra also show maximum fluorescence intensity around 520 nm, in all depths, increasing the fluorescence intensity in deeper depths. Other samples presented very similar spectra. Similarly, when excited at 405 nm (portable system), LIFS emission spectrum shows a single broad band from 475 to 800 nm (Figure 2d). It is interesting to emphasize that, for the presented spectra, variations in fluorescence intensity may reach a factor of 2. It means that the carbon structures are different. The quantum efficiency of fluorescence emission for samples A31 to A36 is bigger than for A7 to A12. In other words, there is a lot of carbon in samples A7 to A12, which are inside of unsaturated and rigid structures, like aromatic rings.
Figure 4 shows the correlation between the HD of humic acid determined by conventional fluorescence and the HD assessed by the portable LIFS system using pellets of whole soil samples.
The Pearson’s coefficients between HD determined using the portable system and the conventional fluorescence
spectroscopy methods were high (R = 0.85 for A465,
Table 1. Carbon concentration of whole soil samples obtained by the elemental analysis (TOC)
Sample Depth / cm Carbon content / %
A1 0-10 0.82 ± 0.02
A2 10-20 0.69 ± 0.02
A3 20-40 0.65 ± 0.02
A4 40-60 0.58 ± 0.02
A5 60-80 0.51 ± 0.01
A6 80-100 0.41 ± 0.01
A7 0-10 0.79 ± 0.01
A8 10-20 0.62 ± 0.01
A9 20-40 0.62 ± 0.02
A10 40-60 0.53 ± 0.02
A11 60-80 0.40 ± 0.01
A12 80-100 0.32 ± 0.01
A13 0-10 0.81 ± 0.02
A14 10-20 0.68 ± 0.02
A15 20-40 0.63 ± 0.01
A16 40-60 0.64 ± 0.01
A17 60-80 0.48 ± 0.01
A18 80-100 0.38 ± 0.01
A19 0-10 0.83 ± 0.02
A20 10-20 0.69 ± 0.01
A21 20-40 0.65 ± 0.01
A22 40-60 0.63 ± 0.04
A23 60-80 0.47 ± 0.01
A24 80-100 0.36 ± 0.01
A25 0-10 0.84 ± 0.03
A26 10-20 0.85 ± 0.02
A27 20-40 0.75 ± 0.01
A28 40-60 0.65 ± 0.02
A29 60-80 0.45 ± 0.01
A30 80-100 0.37 ± 0.02
A31 0-10 0.83 ± 0.02
A32 10-20 0.72 ± 0.02
A33 20-40 0.65 ± 0.01
A34 40-60 0.62 ± 0.01
A35 60-80 0.50 ± 0.01
R = 0.83 for A4/A1, and R = 0.80 for I468/I374, Figure 4a,
4b and 4c) and dispersion was low *p < 0.0001. Another
interesting observation is the increase of dispersion in the HD of OM in deeper horizons (these are the horizons that have greater depth of soil samples and showed the highest humification degree) (Figure 4a, 4b and 4c). It is important
to emphasize that the measurements using conventional fluorescence methods analyze only the humic acid and the experiments using LIFS analyze the total OM. Thus, the insoluble fraction of humic substances (humin) and fulvic acid are also analyzed by LIFS. In light of this, the humin fraction can comprise over 80% of humic material of SOM.
Intensity / a.u. Intensity / a.u.
300 400 500 600 700
0 20 40 60 80 100 120 140 160 180 200
A31 A12
Wavelenght / nm (a)
450 500 550 600 650 700
0 100 200 300 400 500 600 700
A31 A12
Wavelenght / nm
Intensity / a.u. Intensity / a.u.
(b)
200 300 400 500 600 700
0 100 200 300 400 500 600
Wavelenght / nm
A31 A12 (c)
500 550 600 650 700 750 800 850
0 200 400 600 800 1000
A31 A12
Wavelenght / nm (d)
Intensity / a.u.
460 480 500 520 540 560 580 600 620 640 660 0.5
1.0 1.5 2.0 2.5 3.0 3.5 4.0 4.5 5.0
A31 A12
Wavelenght / nm (e)
The correlations among the data are high and in both cases, the results indicate the feasibility of using the portable LIFS system as a tool for investigating the humification of organic matter in whole soil samples, without the need of chemical extractions.
Notwithstanding, the portable LIFS system is easier to use because the measurement is conducted using optical fiber, thus avoiding the misalignment that may occur with the benchtop LIFS system. The portable equipment is an analytical method able to provide a high analytical frequency, allowing direct analysis of soil samples meeting the demand for information on HD, which substantially
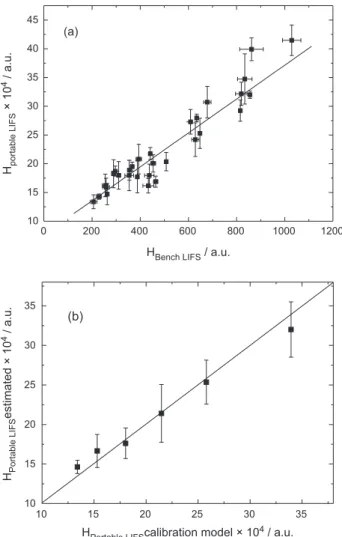
reduces the scanning time.43 The correlation between the
portable LIFS and the benchtop LIFS in estimating HD is shown in Figure 5a. The Pearson’s coefficient (R = 0.953
with *p < 0.0001) indicates a very strong correlation.
The calibration model was fitted from the LSM using the HD determined by the benchtop LIFS system as independent variables and the portable LIFS system as dependent
variables. The equation obtained from this model curve was HportableLIFS = [(66 ± 11) + (0.32 ± 0.02) (HbenchtopLIFS)] × 10
3
(Figure 5a). The treatment samples used for the model validation were A31 to A36. Figure 5b shows the validation graphic, where the Pearson’s correlation coefficient
0.2 0.3 0.4 0.5 0.6 0.7 0.8 0.9
1 2 3 4 5 6 7
Surface Intermediate Deep
A /A4 1
I468 374/I
(a)
2 3 4 5 6 7 8
1 2 3 4 5 6 7
A
× 10
/ a.u.
465
4
A
× 10
/ a.u.
465
4
(b)
Figure 3. Correlation between the HD determined by conventional fluorescence: (a) A465 (Milori et al.24) and A
4/A1 (Zsolnay et al.22) and (b) A465 (Milori et al.24) and I
468/I374 (Kalbitz et al.21).
0 1 2 3 4 5 6 7 8
10 15 20 25 30 35 40
45 Surface
Intermediate Deep
A465× 10 / a.u.4
H
× 10
/ a.u.
Portable LIFS
4
H
× 10
/ a.u.
Portable LIFS
4
H
× 10
/ a.u.
Portable LIFS
4
(a)
0.2 0.3 0.4 0.5 0.6 0.7 0.8 0.9
10 15 20 25 30 35 40
45 (b)
2 3 4 5 6 7 8
10 15 20 25 30 35 40
45 (c)
I468 374/I A /A4 1
Figure 4. Correlation between the HD determined by portable LIFS system (Hportable LIFS) in whole soil samples and the HD determined by conventional fluorescence: (a) portable LIFS system (Hportable LIFS) and Milori et al.24 (A465); (b) portable LIFS system (Hportable LIFS) and Zsolnay et al.22 (A
was very strong (R = 0.997) with low dispersion factor
(*p < 0.0001), indicating a low value of error in estimating
the HD of SOM. Table 2 shows the HD values used in the calibration model and the values estimated by the portable LIFS system.
As can be seen in Figure 5b and Table 2, the results from the portable LIFS system are very similar to the ones obtained with the benchtop LIFS system, thus demonstrating the great application potential of portable
systems for the assessment of the HD of the SOM of whole soil samples. These results agree with those
obtained by Segnini et al.43 who used a portable LIFS
system for assessing SOM stability in whole soil samples from permanent and seasonally flooded wetlands in the Peruvian Andes. Results from the portable LIFS showed significant correlation when compared with the benchtop LIFS system (R = 0.94), showing the feasibility of using a portable LIFS system and representing an improvement in speed and convenience for SOM stability evaluation across the landscape.
Coherence and concordance between the results obtained from the proposed calibration model and the HD estimated by the portable LIFS were observed; the relative error between them was lower than 11%.
The use of LIFS is based on the measurement of fluorescence of the whole soil through soil sample excitation with a laser in the violet or blue region (405-458 nm). This procedure privileged the fluorescence excitation of complex structures of OM associated with more recalcitrant part of HS (HA), such as aromatic and heterocyclic structures. Aliphatic structures should not show fluorescence signal in the violet or blue region as well as should not excite less humified structures of HS (fulvic acid).
It is important to report LIFS that generate semiquantitative information about the molecular complexity of SOM and thus provides a relative indication of its humification process. The equipment parameters are adjusted based on the strength of the signal produced by the whole soil samples and thus quantitative assessment are not feasible. Regarding the benchtop and portable LIFS systems used in this work, there were intrinsic differences of the experimental apparatus to generate specific signal intensity. Since spectroscopic techniques give no absolute humification degree, only relative comparisons are possible. The laser intensities used had to be different, for the obvious reasons; therefore, the electrical signals generated by those lasers are expected to
be distinct.43 However, high correlation between systems
that use whole soils and solutions is very interesting from an analytical point of view.
Table 2. HD estimated by the calibration model and estimated from the portable LIFS system using the simple linear regression model for the sample of A31 to A36
Sample Depth / cm HbenchtopLIFS × 104/ a. u. H
portableLIFS × 104/ a. u. Error / %
A31 0-10 13.4 ± 1 14.6 ± 0.8 9
A32 10-20 15.3 ± 2 17 ± 2 13
A33 20-40 18.0 ± 2 18 ± 2 0
A34 40-60 21.5 ± 2 21 ± 4 2
A35 60-80 25.8 ± 3 25 ± 3 3
A36 80-100 33.9 ± 4 32 ± 4 6
0 200 400 600 800 1000 1200
10 15 20 25 30 35 40 45
(a)
10 15 20 25 30 35
10 15 20 25 30 35
(b)
H
× 10
/ a.u.
portable LIFS
4
H
estimated × 10
/ a.u.
Portable LIFS
4
HPortable LIFScalibration model × 10 / a.u.4 HBench LIFS/ a.u.
This study can be a very interesting contribution for
analytical chemistry,since this portable LIFS system is well
suited to be applied in situ, enabling real time evaluation
of soil qualitythrough assessing of humification degree.
Conclusions
The performance of a portable LIFS system for assessment of the HD of the SOM was analyzed in this study. The correlation between HD determined using a portable system and that determined by conventional fluorescence spectroscopy methods for humic acid were high (R = 0.85 for A465, R = 0.83 for A4/A1 and R = 0.80 for I468/I374), suggesting
that whole soil fluorescence with excitation at 405 nm is strongly related to humified structures of SOM. The results obtained from the portable LIFS system agree with the benchtop LIFS system, showing very strong Pearson’s
correlation coefficient (R = 0.953, *p < 0.0001), and the
coefficient between the calibration model and the estimates
by the portable LIFS system (R = 0.997, *p < 0.0001)
indicate that the model is well consolidated.
The portable system showed some advantages over conventional fluorescence spectroscopy and benchtop LIFS techniques, because it has been shown to be a fast technique with low cost sample analyses. Moreover, another advantage of the proposed method is to allow direct analysis of soil samples and the possibility to access significant information about the HD of the SOM without the need of chemical fractionation steps, which is also in accordance with the green chemistry concept. However, the main advantage of this new method is the feasibility to be integrated into an embedded system for application in precision agriculture.
Acknowledgements
The authors thank FAPESP (projects 04/14315-4 and 2013/51285-0), CNPq, CAPES (Brazilian research funding agencies) and EMBRAPA for their financial support of this work, and Sabesp (company for basic sanitation of the state of São Paulo) and the town of Lins; the experimental area used in this study.
References
1. Bone, J.; Head, M.; Barraclough, D.; Archer, M.; Scheib, C.; Flight, D.; Voulvoulis, N.; Environ. Int. 2010, 36, 609. 2. Bot, A.; Benites, J.; FAO Soils Bull. 2005, 80, 5.
3. Kheshgi, H. S.; Jain, A. K.; Global Biogeochem. Cycles2003,
17, 1047.
4. Folger, P.; Carbon Capture and Sequestration (CCS), Congressional Research Service, 2009.
5. Kononova, M. M.; Soil Organic Matter, 2nd ed.; Pergamon:
Oxford, 1966.
6. Chen, Y.; Senesi, N.; Schnitzer, M.; Soil Sci. Soc. Am. J. 1977,
41, 352.
7. Kumada, K.; Chemistry of Soil Organic Matter, Japan Scientific Societies Press: Tokyo, 1987.
8. Stevenson, F. J.; Humus Chemistry: Genesis, Composition and Reaction, 2nd ed.; John Wiley & Sons: New York, 1994.
9. Senesi, N.; Anal. Chim. Acta1990, 232, 51.
10. Martin-Neto, L.; Nascimento, O. R.; Talamoni, J.; Poppi, N. R.;
Soil Sci. 1991, 151, 369.
11. Martin-Neto, L.; Rossel, R.; Sposito, G.; Geoderma1998, 81, 305.
12. Martin-Neto, L.; Traghetta, D. G.; Vaz, C. M. P.; Crestana, S.; Sposito, G.; J.Environ. Qual. 2001, 30, 520.
13. Novotny, E. H.; Martin-Neto, L.; Geoderma2002, 106, 305. 14. Olk, D. C.; Brunetti, G.; Senesi, N.; Soil Sci. Soc. Am. J. 2000,
64, 1337.
15. González-Pérez, M.; Martin-Neto, L.; Saab, S. C.; Novotny, E. H.; Milori, D. M. B. P.; Bagnato, V. S.; Colnago, L. A.; Melo, W. J.; Knicker, H.; Geoderma2004, 118, 181.
16. Jouraiphy, A.; Amir, S.; Gharous, M. E.; Revel, J. C.; Hafidi, M.;
Int. Biodeterior. Biodegrad. 2005, 56, 101.
17. Carvalho, E. R.; Martin-Neto, L.; Milori, D. M. B. P.; Rocha, J. C.; Rosa, A. H.; J. Braz. Chem. Soc. 2004, 15, 421. 18. Ikeya, K.; Yamamoto, S.; Watanabe, A.; Org. Geochem. 2004,
35, 583.
19. Adani, F.; Genevini, P.; Tambone, F.; Montaneri, E.;
Chemosphere2006, 65, 1414.
20. Senesi, N.; Miano, T. M.; Provezano, M. R.; Brunetti, G.; Soil Sci. 1991, 152, 259.
21. Kalbitz, K.; Geyer, W.; Geyer, S.; Biogeochemistry1999, 47, 219.
22. Zsolnay, A.; Baigar, E.; Jimenez, M.; Steinweg, B.; Saccomandi, F.; Chemosphere1999, 38, 45.
23. Bayer, C.; Martin-Neto, L.; Mielniczuk, J.; Saab, S. C.; Milori, D. M. P.; Bagnato, V. S.; Geoderma2002, 105, 81.
24. Milori, D. M. B. P.; Martin-Neto, L.; Bayer, C.; Mielniczuk, J.; Bagnato, V. S.; Soil Sci. 2002, 167, 739.
25. Schnitzer, M.; Levesque, M.; Soil Sci. 1979, 127, 140. 26. González-Pérez, M.; Milori, D. M. B. P.; Colnago, L. A.;
Martin-Neto, L.; Melo, W. J.; Geoderma2007, 138, 20. 27. Feller, C.; Beare, M. H.; Geoderma1997, 79, 69.
28. Favoretto, C. M.; Gonçalves, D.; Milori, D. M. B. P.; Rosa, J. A.; Leite, W. C.; Brinatti, A. M.; Saab, S. C.; Quim. Nova 2008,31, 1994.
29. He, X. S.; Xi, B. D.; Li, X.; Pan, H. W.; An, D.; Bai, S. G.; Li, D.; Cui, D. Y.; Chemosphere 2013, 93, 2208.
32. Haken, H.; Wolf, H. C.; Molekülphysik und Quantenchemie, Springer: Heidelberg, 1992.
33. Ewald, M.; Berger, P.; Visser, S. A.; Geoderma1988, 43, 11. 34. Belin, C.; Quellec, C.; Lamotte, M.; Ewald, M.; Simon, P.;
Environ. Technol. 1993, 14, 1131.
35. Kumke, M. U.; Löhmannsröben, H. G.; Roch, Th.; J. Fluoresc.
1995, 5, 139.
36. Milori, D. M. B. P.; Galeti, H. V. A.; Martin-Neto, L.; Dieckow, J.; Gonzáles-Pérez, M.; Bayer, C.; Salton, J.; Soil Sci. Soc. Am. J. 2006, 70, 57.
37. Martins, T.; Saab, S. C.; Milori, D. M. B. P.; Brinatti, A. M.; Rosa, J. A.; Cassaro, F. A. M.; Pires, L. F.; Soil Tillage Res.
2011, 111, 231.
38. Tivet, F.; Sá, J. C. M.; Lal, R.; Milori, D. M. B. P.; Briedis, C.; Letourmy, P.; Pinheiro, L. A.; Borszowskei, P. R.; Hartman, D. C.; Geoderma 2013, 207-208, 71.
39. Segnini, A.; Carvalho, J. L. N.; Bolonhezi, D.; Milori, D. M. B. P.; da Silva, W. T. L.; Simões, M. L.; Cantarella, H.; de Maria, I. C.; Martin-Neto, L.; Sci. Agric. 2013, 70, 321.
40. Ferreira, E. C.; Ferreira, E. J.; Villas-Boas, P. R.; Senesi, G. S.; Carvalho, C. M.; Romano, R. A.; Martin-Neto, L.; Milori, D. M. B.; Spectrochim. Acta, Part B 2014, 99, 76.
41. Martin-Neto, L.; Milori, D. M. B. P.; da Silva, W. T. L.; Simões, M. L.; Biophysico-Chemical Processes Involving Natural Nonliving Organic Matter in Environmental Systems, Willey,
2009.
42. Swift, R. S.; Organic Matter Characterization, Soil Science Society of America: Madison, 1996.
43. Segnini, A.; Posadas, A.; Quiroz, R.; Milori, D. M. B. P.; Saab, S. C.; Vaz, C. M .P.; Martin-Neto, L.; Soil Sci. Soc. Am. J. 2010,
74, 1.
Submitted on: September 1, 2014
Published online: February 24, 2015