*Correspondência: Universidade do Planalto Catarinense
Programa de Pós-Graduação em Saúde Coletiva Av. Castelo Branco, 170 - Bairro Universitário - Caixa Postal 525
Lages – SC, Brazil CEP: 88509-900 [email protected]
AbstrACt
Objective. To describe the prevalence of medical visits and associated factors in an adult population
of a medium-sized municipality in Southern Brazil.
MethOds.A cross-sectional population-based study was carried out in a representative random cluster
sampling in Lages, state of Santa Catarina, Brazil. The reference population comprised adults (aged 20 to 59 years) and 2,022 individual were interviewed. The outcome was medical visits during the 12 months prior to the study. Data related to the type of service (public/private) and evaluation of this services were also collected. The independent variables were gender, race/skin color, marital status, income, schooling, health self-perception, nutritional status, self-reported diabetes, high blood pres-sure, smoking, and alcohol-related problems. Poisson regression was carried out and the prevalence rate was obtained.
Results.The prevalence of medical visits was 76.0% (95%CI 73.6-78.4). Women, those with higher
income, those who had diabetes, smokers, ex-smokers, those having alcohol-related problems, and those who evaluated their health negatively reported a higher prevalence of medical visits. We also found that among lower income people, medical visits to the Uniied Health System (Sistema Único de Saúde) were more frequent.
cOnclusiOn.Prevalence of medical visits varied according to the population studied. Health policies
at the three government levels must acknowledge such inequality to subsidize actions in the sector to suggest equality policies.
Key words: Delivery of health care. Medical visits. Socioeconomic factors. Epidemiology. Uniied health system.
pRevalence
Of
Medical
visits
and
assOciated
factORs
:
a
pOpulatiOn
-
based
study
in
sOutheRn
bRazil
antOniO feRnandO bOing1, izabella baRisOn MatOs2*, MaRina patRíciO de aRRuda3, MaRia cOnceiçãO de OliveiRa4, Kathie njaine5
Study conducted at Universidade do Planalto Catarinense (UNIPLAC), Lages, SC, Brazil
1. Mestre em Saúde Pública; área de concentração: Epidemiologia; Doutor em Ciências Odontológicas e Professor do Programa de Pós-graduação em Saúde Pública da Universidade Federal de Santa Catarina – UFSC, Florianópolis, SC
2. Doutora em Ciências - Saúde Pública e Professora do Programa de Pós-graduação em Saúde Coletiva da Universidade do Planalto Catarinense, Lages, SC 3. Doutora em Serviço Social - Professora do Programa de Pós-graduação em Saúde Coletiva da Universidade do Planalto Catarinense, Lages, SC
4. Doutora em Ciências Humanas - Professora do Programa de Pós-graduação em Saúde Coletiva da Universidade do Planalto Catarinense, Lages, SC 5. Doutora em Ciências - Saúde Pública - Professora do Programa de Pós-graduação em Saúde Coletiva da Universidade do Planalto Catarinense, Lages, SC
i
ntROductiOnThe political and legal changes that have occurred in Brazil in
the last few decades, especially the consolidation of the Uniied Health System (SUS) and the expansion of the Family Health
Strategy (ESF), had a profound effect on the reorganization of health services in the country. Unlike previous periods, starting in the 1990s, the public health system has been driven by universal health care, with the purpose of providing integral actions.1,2 Thus, the use of health care services for rehabilitation,
prevention, and treatment of diseases and health promotion has become the right of every citizen.It was also during this period that private health care was remodeled, especially under the impact of the expansion of private health insurance plans, which had tax incentives and few regulatory barriers.3
Despite these changes in the health sector, with signiicant
increased access to different health care services, the literature reports that certain population groups use health care services more often than others. With regard to the prevalence of medical visits, socioeconomic and demographic conditions, and disease load are suggested as important factors responsible for modula-ting these differences.4,5
Knowing how often the population uses health care services
– and, more speciically, how often they have medical visits, – as
well as the factors associated with these episodes, is essential within the current context of the organization of health care services for planning future actions in the sector and for the establishment of public policies.6 In this sense, epidemiological
health system based on real population demand.The objective of the present study was to describe the prevalence of medical visits and associated factors in the adult population of a medium-sized municipality in southern Brazil. We also investigated the satisfaction with the service and the offer of guidance on health care from health professionals to the users.
M
ethOdsA cross-sectional population-based study was conducted in 2007 in Lages, state of Santa Catarina, Brazil. The economic activity of this municipality, which had an estimated population of 166,733 inhabitants in 2005,7 is based on the logging industry
– especially for the production of pulp and paper – as well as livestock and agriculture.8The population studied comprised
male and female adults (20 to 59 years old) living in the urban area of the municipality (n = 86,998).
To calculate the sample size, 95% conidence interval, 50%
expected prevalence, sampling error of 3.5 percentage points, and effect of study design of 2 were used as parameters. An additional value of 10% was incorporated into the sample due to estimated losses and 20% was added to control for confounding
factors. The inal sample included 2,051 individuals. Cluster
sampling was used, with the census tracts being the units of the
irst stage and the households being the units of the second stage.
All adults living in the selected households were considered potentially eligible for the study. Those individuals who refused to participate in the study and were not home after four visits, including at least one visit at night time and another visit during the weekend were considered as losses. Pregnant women, ampu-tees, bedridden patients with plaster, patients with psychiatric disorders and those who for some reason could not remain in the proper position for anthropometric measurement or could not complete the questionnaire were excluded.
Data on the prevalence of medical visits were collected by asking the following question: “Have you seen a doctor in the
past 12 months?” . The study subjects were also asked about
the type of the last medical service used (private health plan or
public health service [Uniied Health System]), their satisfaction
with the service (positive – which included the concepts: very good and fair – and negative – concepts: reasonable, poor, and very poor). They were also asked if they had received guidance from health professionals about health care in the last 12 months.
The independent variables were: gender, age (20-29, 30-39, 40-49, or 50-59 years old), race/skin color (self-reported: white or brown and black), marital status (living with a partner or not), per capita monthly income in minimum wages per quartiles (0.02-0.50, 0.51-0.88, 0.89-1.58 or 1.59-19.74), years of schooling (0-4, 5-8, 9-11 or 12 and more), self-perceived health (positive or negative evaluation), nutritional status (normal weight, overweight or obesity), self-reported diabetes (yes or no), high blood pressure (yes [blood pressure
higher than 140mmHgx90mmHg] or not), smoking (current
smoker, former smoker or never smoked), and alcohol-related
problems (measured using the CAGE [yes or no]).9
Data were independently entered by two people in the computer program Epi-Info 6.04, and then checked for database consistency. Data analysis was performed using Stata 9. Initially, we described the distribution of the sample and calculated the
prevalence rates of medical visits in each population stratum. Next, a bivariate analysis was performed using Poisson
regres-sion, obtaining the prevalence ratio and its respective conidence
intervals as measure of effect size. The multivariate analysis
included all variables with p < 0.25, and the inal model included
those variables with p < 0.05. All analyses considered the effect of sample design. In addition, we found differences when comparing the distributions according to age and gender of our sample with those provided by the IBGE (Brazilian Institute of Geography and Statistics) for the year 2005.7 Therefore, weights
were calculated and incorporated so that the demographic distri-bution of the sample was in agreement with the census data provided by the IBGE. Such adjustments were carried out using the svy commands of Stata. The project was recorded under the number 001-07, approved by the Ethics Research Committee of UNIPLAC in compliance with the resolution 196/96 of the
National Health Council. The research was funded by the Fund
for Encouragement of Research Development of UNIPLAC.
R
esultsThe response rate was 98.6%, totaling 2,022 individuals actually interviewed. Of these, most were women, individuals aged 20 to 29 years, white and living with a partner (Table 1). . For a little more than half of the sample, per capita monthly income was up to 0.88 minimum wage and 46.5% had up to 8 years of schooling. The analysis of morbidities showed that 6.9% had diabetes and 27.7% had high blood pressure. . The proportion of smokers was 29.7% and 11.5% of individuals had alcohol-related problems. .
The prevalence of medical visits in the 12 months preceding the interview was 76.0% (95%CI 73.6-78.4). The outcome frequency in each population group is described in Table 1. The bivariate analysis showed that women had a 22% higher
preva-lence of seeing a doctor during the past year. Higher prevapreva-lence
of medical visits was also found among those aged 50 to 59 years (compared to the group aged 20 to 29 years) and those who reported a higher income. Individuals with diabetes, those who assessed their health negatively, smokers or former smokers, and those who had alcohol-related problems also had higher outcome prevalence. . Skin color/race, marital status, schooling, nutritional status, and blood pressure levels were not associated with the outcome.
Even after adjusting for the other variables investigated, the multivariate analysis showed that the prevalence of medical visits remained higher among women (19% higher compared to men) and those with higher income (14% higher in the highest income quartile compared to lowest income quartile) (Table 1). The frequency also remained higher among individuals with diabetes, negative self-assessment of health, smokers and former smokers, and those having alcohol-related problems.
With respect to the type of medical service used, 47.5% (95%CI 44.8-50.2) mentioned the private sector (private health expenditures or health insurance) and 52.5% (95%CI 49.8-55.2) mentioned the public sector. In spite of the fact that these percentages were similar on the average of the
popula-tion investigated, there were signiicant differences according
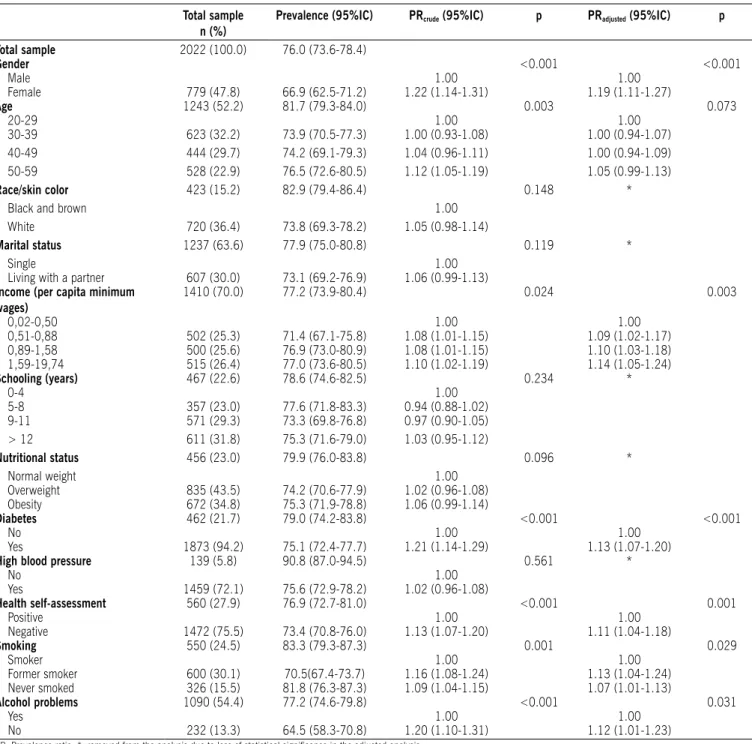
table 1 – Distribution of the sample, prevalence of medical visits and crude and adjusted prevalence ratios among medical visits and sociodemographic variable, nutritional status, life habits, self-reported diseases, and health perception. Lages, santa Catarina, brazil, 2007.
total sample n (%)
Prevalence (95%IC) Prcrude (95%IC) p Pradjusted (95%IC) p
total sample 2022 (100.0) 76.0 (73.6-78.4)
Gender <0.001 <0.001
Male 1.00 1.00
Female 779 (47.8) 66.9 (62.5-71.2) 1.22 (1.14-1.31) 1.19 (1.11-1.27)
Age 1243 (52.2) 81.7 (79.3-84.0) 0.003 0.073
20-29 1.00 1.00
30-39 623 (32.2) 73.9 (70.5-77.3) 1.00 (0.93-1.08) 1.00 (0.94-1.07) 40-49 444 (29.7) 74.2 (69.1-79.3) 1.04 (0.96-1.11) 1.00 (0.94-1.09) 50-59 528 (22.9) 76.5 (72.6-80.5) 1.12 (1.05-1.19) 1.05 (0.99-1.13) race/skin color 423 (15.2) 82.9 (79.4-86.4) 0.148 *
Black and brown 1.00
White 720 (36.4) 73.8 (69.3-78.2) 1.05 (0.98-1.14)
Marital status 1237 (63.6) 77.9 (75.0-80.8) 0.119 *
Single 1.00
Living with a partner 607 (30.0) 73.1 (69.2-76.9) 1.06 (0.99-1.13) Income (per capita minimum
wages)
1410 (70.0) 77.2 (73.9-80.4) 0.024 0.003
0,02-0,50 1.00 1.00
0,51-0,88 502 (25.3) 71.4 (67.1-75.8) 1.08 (1.01-1.15) 1.09 (1.02-1.17) 0,89-1,58 500 (25.6) 76.9 (73.0-80.9) 1.08 (1.01-1.15) 1.10 (1.03-1.18) 1,59-19,74 515 (26.4) 77.0 (73.6-80.5) 1.10 (1.02-1.19) 1.14 (1.05-1.24) schooling (years) 467 (22.6) 78.6 (74.6-82.5) 0.234 *
0-4 1.00
5-8 357 (23.0) 77.6 (71.8-83.3) 0.94 (0.88-1.02) 9-11 571 (29.3) 73.3 (69.8-76.8) 0.97 (0.90-1.05) > 12 611 (31.8) 75.3 (71.6-79.0) 1.03 (0.95-1.12)
Nutritional status 456 (23.0) 79.9 (76.0-83.8) 0.096 *
Normal weight 1.00
Overweight 835 (43.5) 74.2 (70.6-77.9) 1.02 (0.96-1.08) Obesity 672 (34.8) 75.3 (71.9-78.8) 1.06 (0.99-1.14)
Diabetes 462 (21.7) 79.0 (74.2-83.8) <0.001 <0.001
No 1.00 1.00
Yes 1873 (94.2) 75.1 (72.4-77.7) 1.21 (1.14-1.29) 1.13 (1.07-1.20) High blood pressure 139 (5.8) 90.8 (87.0-94.5) 0.561 *
No 1.00
Yes 1459 (72.1) 75.6 (72.9-78.2) 1.02 (0.96-1.08)
Health self-assessment 560 (27.9) 76.9 (72.7-81.0) <0.001 0.001
Positive 1.00 1.00
Negative 1472 (75.5) 73.4 (70.8-76.0) 1.13 (1.07-1.20) 1.11 (1.04-1.18)
smoking 550 (24.5) 83.3 (79.3-87.3) 0.001 0.029
Smoker 1.00 1.00
Former smoker 600 (30.1) 70.5(67.4-73.7) 1.16 (1.08-1.24) 1.13 (1.04-1.24) Never smoked 326 (15.5) 81.8 (76.3-87.3) 1.09 (1.04-1.15) 1.07 (1.01-1.13)
Alcohol problems 1090 (54.4) 77.2 (74.6-79.8) <0.001 0.031
Yes 1.00 1.00
No 232 (13.3) 64.5 (58.3-70.8) 1.20 (1.10-1.31) 1.12 (1.01-1.23)
PR: Prevalence ratio; *: removed from the analysis due to loss of statistical signiicance in the adjusted analysis
and, conversely, the higher the income of a population stratum, the higher the use of private services.
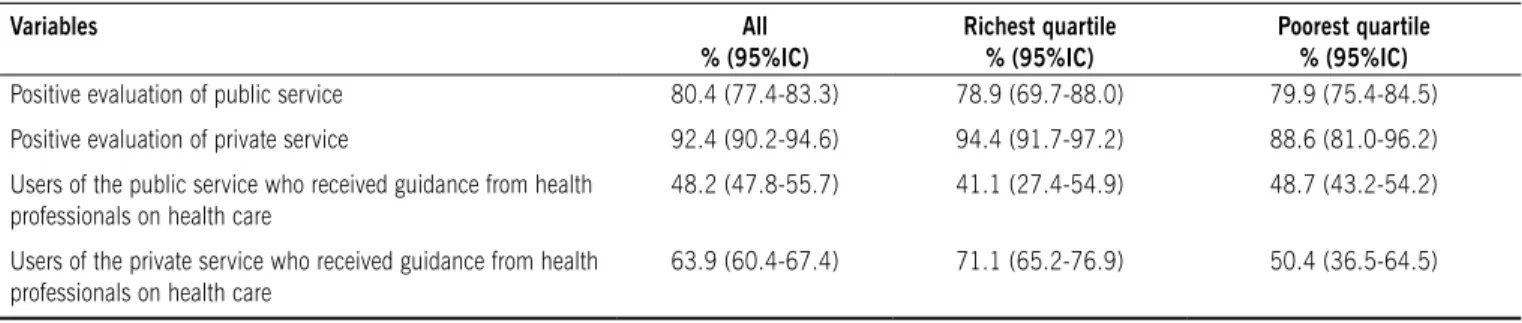
Regarding the evaluation of medical services by the popu-lation as a whole, we found that private service were more reputable (92.4% considered it positive) than the public service (80.4% of positive evaluations) (Table 2). According to the
conidence intervals of these measures, we found that this difference is statistically signiicant, which also occurred when
we analyzed the evaluation provided by the population stratum
with higher income. However, in the lowest income quartile there was no statistical signiicance regarding the evaluation of
d
iscussiOnCross-sectional population-based studies are important tools
to describe the epidemiological proile and the use of health services. However, essential care should be taken in order to
avoid distortions in the results.10 Accordingly, in the present study,
the high response rate (98.6%) and the random sample selection are very important aspects. Moreover, there was quality control of data and the interviewers were unaware of the purpose of the study, reducing the chance of biases. The overrepresentation of women and the older age stratum was corrected by the weighted analyses that followed the demographic distribution predicted for the municipality by the IBGE. Finally, it is important to point out that an important limitation of cross-sectional studies is that they are unable to establish causal relationships, since exposure and outcome are investigated at the same time; therefore, the possibility of reverse causality bias cannot be eliminated in some associations tested.11
In the present study, the proportion of individuals who had at least one medical visit in the past year (76.0%) was higher than that described in the national average in other Brazilian municipalities and abroad. In Pelotas, state of Rio Grande do
Sul, Brazil, Costa et al. 12reported an outcome prevalence of
70.9%, while the prevalence in Rio Grande, state of Rio Grande do Sul, was 66.0%.13 Considering the whole country, data
from the National Survey per Household Sample indicated an
increase in the proportion of Brazilian individuals who saw a doctor in the last 12 months between 1998 (54.7%) and 2003 (62.9%) Travassos & Castro.14. On the international scene, these
values ranged between 60% and 70%.15It is worth highlighting,
however, that variations in the age groups investigated in each study limit direct comparisons.
The prevalence of medical visits is the result of processes that involve several factors and requirements. An important modulator of this phenomenon is the individuals’ socioeconomic status. In a systematic review of the literature on this topic, Mendoza-Sassi & Beria15 found that the direction of the association between
exposure and outcome varies according to the country investi-gated. In Brazil, studies have been consistent in identifying the existence of inequity in the use of health services. In other words, despite showing greater disease load and, therefore, needing to use health services more often, the most underprivileged strata of the population show a lower frequency of medical visits and less access to other services in the health área.16 Thus, in the
present study, we found that the prevalence of medical visits was higher among those having higher income; however, there was no difference regarding schooling.
The importance of the Uniied Health System for the poorest
deciles of the population and the predominance of medical visits in private services among those with the highest income were also highlighted. The Federal Constitution of 1988 and
the Organic Laws of Health in Brazil oficiated the proposal for
a health system with public universal coverage.17Concomitant
with the implementation of SUS, however, there was the expan-sion of the private health sector, which essentially incorporated the richest population groups through health insurance plans or direct payment of health expenditures. Among the reasons that led to this concentration of the richest population in the private service, we may mention the increase in the supply of
this sector, which would have an inluence on the demand at the
same time as it is stimulated by the demand, the poor access to the public service, and the negative evaluation of the service provided. These last two factors are associated with a massive increase in the population served by the public health system at the time of its universalization without direct increase in the volume of resources invested in the sector.17,18The importance of
table 2 – Evaluation of health services used and proportion of individuals who received guidance from health Professionals on health care. Lages, santa Catarina, brazil, 2007.
Variables All
% (95%IC)
richest quartile % (95%IC)
Poorest quartile % (95%IC) Positive evaluation of public service 80.4 (77.4-83.3) 78.9 (69.7-88.0) 79.9 (75.4-84.5)
Positive evaluation of private service 92.4 (90.2-94.6) 94.4 (91.7-97.2) 88.6 (81.0-96.2)
Users of the public service who received guidance from health professionals on health care
48.2 (47.8-55.7) 41.1 (27.4-54.9) 48.7 (43.2-54.2)
Users of the private service who received guidance from health professionals on health care
63.9 (60.4-67.4) 71.1 (65.2-76.9) 50.4 (36.5-64.5)
100
Figura 1 - Use of public and private health services for medical visits according to the income deciles. Lages, santa Catarina, brazil, 2007.
90 80 70 60 50 40 30
%
20 10 0
1 2 3 4 5 6 7 8 9 10
Decil de renda
+ ricos
Serviço privado de saúde Serviço público de saúde
+ pobres
+ pobres = poorest
+ ricos = richest
Decil de renda = income decile
an effective structure for a universal public health care system is expressed when it is detected that countries with stronger parti-cipation of the private sector there is more inequality in favor of those with higher income.19 Thus, the possibility of equal access
to health care services is questionable when the patient needs to pay for the services provided.20Further studies are needed
to clarify the reasons and consequences of the socioeconomic differences in the type of services used for medical visits and in their assessments.
In Brazil, researchers have analyzed the proile of the
morbidity reported, the access to and the use of health services and have found that both in terms of curative and, especially, preventive care, women are the most frequent consumers.21The
same pattern was seen for medical visits in the population inves-tigated in the present study. Rieker & Bird22 reported that despite
the prevalence of chronic fatal diseases among men, women are suffering from short-term illnesses, acute and transient diseases, chronic non-fatal diseases and common symptoms. It is also important to highlight the social role played by women, who may suggest subjective aspects involved both in the risk of illness and frequency of medical visits. This subjective aspect is stressed as being important to explain the use of health services. Thus, such analyses not only demonstrate inequality in the use
of medical services, but also relect differences in the perceptions
regarding medical needs according to gender. In other words, social experiences may be responsible for higher or lower use of medical services.15,21
A better understanding of the use of health services requires taking into consideration not only the organizational structure of
the services offered, the ease or dificulty of access, and even
the costs, but also the subjective values must be considered. The frequency of medical visits can be an indicator of different behaviors regarding the decision-making process in face of the disease, such as the different social representations of disease, health, and healing, the creation of demand stimulated by the media, and the asymmetrical relationship between doctors and patients.23
The higher frequency of medical visits among smokers or former smokers is consistent with studies conducted in Swit-zerland,24 Sweden,25 Spain,26 South Korea,27 and the United
States.28In the present study, the PR was especially higher among
former smokers. This inding may be related to the fact that this
group of patients is more concerned about their health, and this is reason for them to quit smoking and to have more frequent medical visits. Another possibility is that these people stopped smoking due to illness, the same reason that motivates their medical visits. Finally, a potentially greater disease load among current smokers may be stimulating them to have a higher preva-lence of outcome in comparison with those who never smoked. Similarly, those who reported alcohol-related problems may, therefore, have greater need of medical visits.
People with health problems and those who evaluate their general health as being poor tend to see their doctors more frequently for treatment and follow-up.28 In the present study,
the outcome prevalence was 13% higher among individuals who self-reported diabetes and 11% higher among those who rated
their health negatively. Such phenomena were also identiied in
other studies.29,30 However, there was no association between
medical visits and high blood pressure levels, which is not in agreement with the literature. There is need of further studies that reveal the reason for this lack of association, identifying whether
there are dificulties in accessing the health services or whether
other constraints are operating in the municipality.
The use of data on health and epidemiology should be seen as an everyday tool, close to local practices and feasible to achieve a broader knowledge and monitor indicators of health, illness, and events related to both these aspects. In the present study, differences and inequalities in the use and evaluation of
health services were identiied. Based on these indings, public
policies can be established or remodeled, and future researches should evaluate their effectiveness and monitor the health of the population.
c
OnclusiOnThere are differences in the prevalence of medical visits among different population groups. The fact that those having the lowest income use the health services less often is of parti-cular concern because this population has a higher disease
load. The use of the Uniied Health System for medical visits signiicantly varied among different socioeconomic strata.
No conlicts of interest declared concerning the publication of
this article.
Financial support:
Fundo de Incentivo ao Desenvolvimento de Pesquisa da Universidade do Planalto Catarinense (UNIPLAC)
R
efeRences1. Noronha JC, Lima LD, Machado CV. O Sistema Único de Saúde - SUS. In: Giovanella L, Escorel S, Lobato LVC, Noronha JC, Carvalho AI. Políticas e sistema de saúde no Brasil. Rio de Janeiro: Fiocruz; 2008.
2. Rosa WAG, Labate RC. Programa saúde da família: a construção de um novo modelo de assistência. Rev Latinoam Enferm. 2005;13(6):1027-34. 3. Costa NR. O regime regulatório e o mercado de planos de saúde no Brasil.
Ciênc Saúde Coletiva. 2008;13(5):1453-62.
4. Mendoza-Sassi R, Béria JU. Utilización de los servicios de salud: una revisión sistemática sobre los factores relacionados. Cad Saúde Pública. 2001;17(4):819-32.
5. Regidor E, Martínez D, Calle ME, Astasio P, Ortega P, Domínguez V. Socioeco-nomic patterns in the use of public and private health services and equity in health care. BMC Health Serv Res. 2008;8:183.
6. Viacava F. Informações em saúde: a importância dos inquéritos populacionais. Ciênc Saúde Coletiva. 2002;7(4):607-21.
7. IBGE (Instituto Brasileiro de Geograia e Estatística). Sistema IBGE de recu-peração automática. [citado 22 set 2008]. Disponível em: http://www.sidra. ibge.gov.br.
8. Munarin A. Educação e esfera pública na serra catarinense: a experiência política do plano regional de educação (1993-1996). Florianópolis: Centro de Ciências da Educação/Núcleo de Publicações; 2000.
9. Masur J, Monteiro M. Validation of the CAGE alcoholism screening test in Brazilian pychiatry inpatient hospital setting. J Biol Res. 1983;16(2):215-8. 10. Viacava F, Dachs N, Travassos C. Os inquéritos domiciliares e o Sistema de
Informações em Saúde. Ciênc Saúde Coletiva. 2006;11(4):863-9. 11. Rothman KJ, Greenland S. Modern Epidemiology. Lippincott Williams &
Wilkins: Philadelphia, 1998
12. Costa JSD, Reis MC, Silveira Filho CV, Linhares RS, Piccinini F. Prevalência de consultas médicas e fatores associados, Pelotas (RS), 1999-2000. Rev Saúde Pública. 2008;42(6):1074-84.
13. Mendoza-Sassi R, Béria JU, Barros AJD. Outpatient health service utiliza-tion and associated factors: a populautiliza-tion-based study. Rev Saúde Pública. 2003;37(3):372-8.
Noronha JC, Carvalho AI. Políticas e Sistema de Saúde no Brasil. Rio de Janeiro: FIOCRUZ, 2008.
15. Mendoza-Sassi R, Béria JU. Utilización de los servicios de salud: una revisión sistemática sobre los factores relacionados. Cad Saúde Pública. 2001;17(4):819-32.
16. Negri M, Soares W. Desigualdade social e saúde no Brasil. Cad Saúde Pública 2002;18(Suppl):77-87.
17. Farias LO, Melamed C. Segmentação de mercados da assistência à saúde no Brasil. Ciênc Saúde Coletiva. 2003; 8(2):585-98.
18. Faveret Filho P, Oliveira P. A universalização excludente: relexões sobre as tendências do sistema de saúde. Dados Rev Ciênc Sociais. 1990;33(2):257-83. 19. Van Doorslaer E, Masseria C, Koolman X, OECD Health Equity Research Group.
Inequalities in access to medical care by income in developed countries. CMAJ. 2006;174(2):177-83.
20. Lostao L, Regidor E, Geyer S, Aïach P. Patient cost sharing and physician visits by socioeconomic position: indings in three Western European countries. J Epidemiol Community Health. 2007;61(5):416-20.
21. Pinheiro RS, Viacava F, Travassos C, Brito AS. Gênero, morbidade, acesso e utilização de serviços de saúde no Brasil. Ciênc Saúde Coletiva. 2002;7(4):687-707. 22. Bird CE, Rieker PP. Gender matters: an integrated model for understanding
mens and womens health. Soc Sci Med. 1999;48(6):745-55.
23. Luz M T. As novas formas da saúde: práticas, representações e valores culturais na sociedade contemporânea. Rev Bras Saúde Família. 2008;9(1):38-50. 24. Gutzwiller F, La Vecchia C, Levi F, Negri E, Wietlisbach V. Smoking, prevalence
of disease and health service utilization among the Swiss population. Rev Epidemiol Sante Publique. 1989;37(2):137-42.
25. Freeborn DK, Mullooly JP, Pope CR, McFarland BH. Smoking and consistently high use of medical care among older HMO members. Am J Public Health. 1990;80(5):603-5.
26. Artalejo FR, Manzano BA, Guallar-Castillón P, Mendizabal MTP, Enríquez JG, Calero JR. The Association of tobacco and alcohol consumption with the use of health care services in Spain. Prev Med. 2000;31(5):554-61.
27. Jee SH, Kim IS, Suh I. The effect of smoking on health service utilization. Yonsei Med J. 1993;34(3):223-33
28. Saez M. Condicionantes en la utilización de los servicios de atención primaria: evidencias empíricas e inconsistencias metodológicas. Gac Sanit. 2003;17(5):412-419.
29. Costa JD, Facchini LA. Utilização de serviços ambulatoriais em Pelotas: onde a população consulta e com que freqüência. Rev Saúde Pública. 1997;31(4):360-9.
30. Capilheira MF, Santos IS. Fatores individuais associados à utilização de consultas médicas por adultos. Rev Saúde Pública. 2006;40(3):436-43.