AR
TICLE
1 Departamento de Saúde Coletiva, Faculdade de Ciências Médicas, Universidade Estadual de Campinas (Unicamp). Cidade Universitária Zeferino Vaz, Barão Geraldo. 13083-970 Campinas SP Brasil.
[email protected] 2 Programa de Pós-Graduação em
Gerontologia, Faculdade de Ciências Médicas, Unicamp.
Negative self-rated health in the elderly in cities
with different levels of economic well-being: data from FIBRA
Abstract This comparative, cross-sectional study analyzed negative self-rated health in elderly peo-ple, according to sociodemographic and health variables, use of public or private health services, functional performance, frailty and depressive symptoms. The participants lived in Belém (n = 571) and Campinas (n = 676), cities with differ-ent socioeconomic conditions, and the research formed part of a multicentric study on frailty (Fibra Study, Unicamp). Multivariate regres-sion analysis showed that in both cities, negative self-rated health was associated with low edu-cation, three or more chronic diseases and sight deficiencies. In Belem, additional observations included associations with fatigue, three or more signs and symptoms and use of public health ser-vices; in Campinas, negative self-rated health was also associated with depressive symptoms. The as-sociations suggest that poor health in old age is the result of an accumulation of deficits for lack of socioeconomic resources throughout life and that deficits are not sufficiently compensated for health services in old age.
Key words Aging, Self-rated health, Chronic dis-eases, Health services, Socioeconomic factors
Eigênia Passarelli Mantovani 1
Sérgio Roberto de Lucca 1
M
ant
o
v
Introduction
The population aging process underway in Brazil has been accompanied by increased prevalence of chronic diseases, use of medications and hospi-talizations in the elderly1. Such occurrences are
exacerbated by disability, which is characterized as the inability or dificulty to perform tasks that are part of everyday life, and which are indis-pensable for independent living in the commu-nity2. Disability, chronic diseases, falls,
hospital-izations and mortality are seen as risks associated with the clinical syndrome of frailty, marked by fatigue, unintentional weight loss, physical inac-tivity, low grip strength and slow walking speed, as described by Fried et al.3.
Lower levels of education and lifelong pov-erty can give rise to adverse and cumulative ef-fects to health, nutritional habits, self-care and adherence to health treatments. The continuity of these conditions into old age particular affects quality of life in the health of the elderly4. Poverty
and low access to health services have been de-scribed as variables associated with frailty3,5.
The subjective health assessment has been associated with the decline of functional auton-omy6, disability and chronic diseases7 among the
elderly. Self-rated health is global and evaluative, involving answers that are characterized as a per-sonal judgment about the quality of physical and mental health, based on individual and social criteria8. Since it has an effect on overall sense
of well-being, self-treatment and adherence to health treatment9, health assessments are
rec-ommended by the World Health Organization (WHO) as an important indicator of population health.
Self-rated health was used in Brazil as an out-come variable for the irst time in Bambuí Proj-ect10. The results of this pioneering study showed
a multidimensional structure of self-rated health in the elderly, which comprises socioeconomic status, social support, physical health, depressive symptoms, and access to and use of health ser-vices.
Survey data conducted in Brazil and over-seas suggest that age, sex, material well-being and level of education are relevant dimensions of self-assessment of health status11-13. The
neg-ative self-perception of health in the elderly is associated with chronic diseases, disability, vision and hearing deiciencies, the inability to leave home alone or to carry out exercise, as well as psychosocial factors6,14,15. The negative health
as-sessments do not refer exclusively to feelings of
physical pain and discomfort, but also to the so-cial and psychological consequences of diseases16.
There is no Brazilian data on health self-as-sessment in the elderly living in cities with dif-ferent socio-economic levels, considering other health indicators and sociodemographic vari-ables. Knowledge about the correlates of self-rat-ed health can guide policies and programs to im-prove healthcare for the elderly.
The objectives established for this study were: a) to compare the proile of the elderly, 65 years or more, living in Belém (Pará State) and Campi-nas (Sao Paulo State), taking into consideration self-assessed health, sociodemographic variables and other health indicators, including access to and use of health services b) in each city, to ex-amine the associations between negative self-rat-ed health, socio-demographic variables and oth-er health variables.
Methods
The research was based on an electronic data-base from the study ‘Frailty of the Brazilian El-derly’ (FIBRA Study, University of Campinas, 2008-2009), from the multicenter and cross-sec-tional project , which aimed to investigate the relationship between frailty indicators3 and
as-sociated socio-demographic,biological and
psy-chosocial variables, in the urban elderly aged 65 and over. The FIBRA study involves seven Bra-zilian cities chosen by convenience and selected from probabilistic samples of urban census tracts (93 in Belém and 90 in Campinas), correspond-ing to the ratio of the number of older adults to the number of urban census tracts17. The cities
had more than one million inhabitants, at the time of data collection. The former had a Gross Domestic Product (GDP) per capita of BRL 9,793 and the second, a GDP per capita of BRL 29,73118, data used to afirm that they are cities
whose populations experience different econom-ic conditions. The recruitment was carried out in respondents’ homes by trained recruiters follow-ing a pre-planned sequence in each census tract, and eligibility criteria were as follows: aged 65 years or older, being a permanent resident in the city of domicile and the respective census tract, absence of severe cognition, communication, sensory and mobility impairments. The exclu-sion criteria used in recruitment were the same as those adopted by Fried et al.3: a) occurrence
e C
ole
tiv
a,
20(12):3653-3668,
2015
problems suggestive of dementia, or the men-tion of diagnosis made by a physician, or by a family member; b) being temporary or perma-nently bedridden; c) those aflicted with serious consequences of a stroke, with localized loss of strength and/or aphasia; d) Parkinson’s Disease with serious loss of mobility, speech or affection; e) serious loss of sight or hearing, which could be a serious obstacle to communication; f) those who are terminally ill.
The data was collected in one single ses-sion, lasting between 40 and 120 minutes, in the community setting with address, time and date agreed with the elderly at the moment of recruit-ment for the survey. The session was divided into two parts. The irst included measures of socio-demographic, anthropometric, clinical, frailty and dementia screening. In this case, the evalu-ation used the Mini-Mental State Examinevalu-ation (MMSE), whose cutoff for presence of cognitive impairment is schooling suggested by Brucki et
al.19 and recommended by the Brazilian
Acade-my of Neurology, less one standard deviation (17 for illiterates, 22 points for 1 to 4 years of school-ing; 24 points for 5 to 8 years of schooling and 26 points for 9 or more years of schooling). The sample of 721 older adults in Belem and 900 in Campinas were excluded those who scored be-low the cutoff point. The elderly included in the MMSE score (571 in Belém and 689 in Campi-nas) participated in the second part of measures (all self-report) on physical health conditions, functionality, depressive symptoms and life sat-isfaction, all of which are of interest to the study. All participants signed an informed consent form that had received approval from the Ethics Committee of the Faculty of Medical Sciences at the State University of Campinas (UNICAMP). For this study an addendum to the FIBRA study was approved.
Variables and measures
1. Self-assessment of health. Taken as a de-pendent variable, this was investigated by means of the question: “ In general, how would you rate your current health status?, with the following response options: very good (5), good ( 4) regu-lar (3) bad (2) and very bad (1). In data analysis, very good and good health were combined into the positive self-rated health class, and fair, bad and very bad health were combined into the neg-ative self-rated health class.
2. Sociodemographic variables were evalu-ated as: a) sex (male or female); b) age in years,
which was divided into four groups (65-69, 70-74, 75-79, and > 80 years); c) family income [(re-lating to wages, pensions, retirement beneits, so-cial beneits, rent and interest received monthly by family members and grouped according as a multiple of the Brazilian minimum wage (MW) per month at the time of data survey as follows into corresponding (≤ 1; 1.1 to 3, 3.1 to 5;> 5 MW)]; d) head of family (yes or no) and; e) edu-cation ( “until which year of study did you go to school?”, the value was noted and was later used to establish the categories: never went to school, and 1-4 years, 5-8 years and ≥ 9 years of school-ing), corresponding to the levels of the Brazilian formal education; f) Even within the sociodemo-graphic variables the elderly person was asked if they carried out some form of paid work (yes or no).
3. Access to and use of health services. Ac-cess to health services was investigated through responses to the following question: when you need medical care, what kind of health care de-mand do you most often use? Public health or the Brazilian Uniied Health System, SUS (health centers, clinics); clinics, ofices and hospitals linked to religious organizations or private health plans; clinics and private hospitals paid directly by the patient? The irst alternative was consid-ered as predominantly using public services and the other two as private services. The use of health services has two indicators: a) Higher number of inpatient nights in hospital in the year preceding the survey, with answers attributed as none, 1 or 2 or more; b) number of medical visits in the last year, grouped as none, 1, 2 and 3 or more.
M
ant
o
v
hearing badly and using a hearing aid; and hear-ing badly and no hearhear-ing aid), all with possible answers yes or no; d) To measure the
nutrition-al status Body Mass Index (BMI) in kg /m2 was
considered and obtained using the formula: BMI = weight (kg) ÷ height (m)2 .The resulting data
were classiied based on recommendations estab-lished by the Pan American Health Organization (PAHO): BMI less than 23 = underweight; BMI between 23 and 27.99 = normal weight; BMI be-tween 28 and 29.99 = overweight; and BMI above 30 = obesity20; e) For the cardiovascular risk
mea-sure the waist ratio/ hip ratio (WHR) was con-sidered. As classical protocols, measurement of waist circumference is made at the midpoint be-tween the lower border of the last rib and the iliac crest. The hip circumference is measured consid-ering the point of maximum volume of the
glu-tes21. The measurements were performed with
stretch resistant tape, with millimeter measures and measuring 150 cm. The criteria for the clas-siication of WHR were proposed by Lohman et al22. For women, WHR = 0.80 to 0.85 (low risk);
WHR = 0.86 to 0.90 (moderate risk) and WHR> 0.90 (high risk). For men, WHR = 0.90-0.95 (low risk); WHR = 0.96 to 1.0 (moderate risk) and WHR> 1.0 (high risk).
5. Fragility. This was operationalized by means of a ive criteria model constructed by Fried et al.3: a) unintentional weight loss was
indicated by 4.5kg or 5% of body weight in the previous year; b) fatigue was considered for the answers ‘always’ or ‘almost always’ of two items taken from the CES-D23, about the perceived lack
of energy to start or take care of daily activities; c) physical inactivity was indicated by a weekly caloric expenditure rate in exercise and house-work less than the value of the 1st quintile of the distribution. Types, the weekly frequency and duration of daily exercise and domestic activities of low, moderate and high intensity that the el-derly performed were evaluated using an adapted Brazilian version of the Minnesota Leisure Activ-ities Questionnaire24. The results were
interpret-ed according to the parameters establishinterpret-ed by Ainsworth et al.25; d) The handgrip measured in
kilograms force (kg f) was obtained with a hy-draulic dynamometer, Jamar model (Lafayette Instruments®, Lafayette, Indiana, USA), using the
elderly’s dominant hand and placed in the dom-inant hand in three consecutive attempts, with a one minute resting interval. Low grip strength was deined by the lowest quintile in the sam-ple, values of each city adjusted for gender and height3; e) The gait speed test involved three
con-secutive measurements of the time (in seconds) which the individual took to walk 4.6 meters on a lat surface, on a straight line and usual speed, with the use of canes or walkers if needed. In each sample, the time values in seconds above the 80th percentile were considered as run time indica-tors, adjusted for gender and height3,26. According
to Fried et al.3, the elderly who score points in any
three of the ive indicators must be considered as weak; those who score in 1 or 2 as pre-fragile; and those that score in none as non-fragile and robust.
6. Independence to perform instrumental activities of daily living (IADL). The elderly were asked about how much help (total, partial or none) they needed to perform the following IADL: a telephone call, using transport, shop-ping, cooking, housework, medication use and
money management27. The categories partial or
total aid were grouped into one, called depen-dency. “None” were considered independent. Re-sponses to each item given to each of the three possibilities were counted. The answers ‘partial relief ’ and ‘total’ have been grouped in the de-pendent category.
7. Depressive symptoms. These were eval-uated using the Geriatric Depression Scale with
15 dichotomous items (GDS-15)28 and a cut-off
score> 6, a depression screening tool for elderly that evaluates emotional states.
Data analysis
be-e C
ole
tiv
a,
20(12):3653-3668,
2015
tween the independent variables and the negative health self-assessment in Belém and in Campi-nas. Statistical signiicance was set at p ≥ 0.05 for all the analyses.
Results
A signiicantly higher percentage of elderly peo-ple in Campinas rated their health positively compared with those in Belém, where we found a higher frequency of negative self-rated health. In both cities, 69% of the sample were women and 69% of participants were aged between 65 and 74. In Belém, we observed a signiicantly great-er pgreat-ercentage of oldgreat-er adults with avgreat-erage family incomes below the minimum wage and 3 times the minimum wage compared with Campinas, where the frequency of participants with a family income of between 3.1 and ive times the min-imum wage was signiicantly higher. Campinas surpassed Belém as the percentage of older adults with 1-4 years of schooling, but Belém surpassed Campinas in terms of those with 5-8 years of schooling.
Compared to Campinas, Belém had a sig-niicantly higher percentage of older adults who used public health care more often, and in Campinas there was a higher frequency of older adults who used private health care. The elder-ly of Belém self-reported more medical visits in the 12 months preceding the survey than those in Campinas. But the statistically signiicant differ-ences between the two cities that were observed were the number of chronic diseases diagnosed by doctors and the number of signs and symp-toms in the year preceding the interview.
In Belém, the percentage of older adults with underweight and lower cardiovascular risk exceeded those in Campinas, where there was a signiicantly higher percentage of elderly with overweight and obesity and with a high cardio-vascular risk. In Belém there were more elderly that reported hearing well, but more elderly in Campinas reported good eyesight. The older adults of Belém reported seeing better without glasses compared with those from Campinas, but there were older adults from Belém who report-ed bad hearing and no hearing aid. Comparreport-ed to Campinas, Belém had a signiicantly higher percentage of elderly who reported needing as-sistance in IADL performance.
In Campinas a signiicantly higher percent-age of older adults were found to describe them-selves as totally independent. The samples of the
two cities were not statistically different in terms of the prevalence of frailty based on Fried et al3.’s
criteria, with the exception of the physical in-activity variable, for which the elderly of Belém surpassed those of Campinas. Table 1 presents a comparison of the percentage of participants in the two cities (around 21.5%) with cutoff points for depressive symptoms (Table 1).
In Belém there was a statistically higher per-centage of the elderly who evaluated their health negatively among the following groups: those who earned less than three times the minimum wage, those with 1-8 years of schooling, those who worked, those who used public health care services and those who reported three or more medical visits in the previous year; those who had three or more diseases and 3 or more signs and symptoms; those who reported not seeing well with glasses, those who could not see well with-out glasses, those that reported bad hearing and no hearing aid, those who perceived fatigue, with lower handgrip, lower mean gait speed, physical inactivity and those above cutoff points in EDG. Also in Belém, among those who evaluated their health positively were older adults with income exceeding 5 MW, those with nine or more years of schooling, those working, who used private health care, who reported only one medical visit in the previous year. This group had fewer chron-ic diseases and fewer signs and symptoms (none to 2); they reported seeing well and hearing well without the aid of instruments; they were physi-cally active and scored above the cut-off point for depressive symptoms.
In Campinas, among those who had neg-ative self-rated health, there were signiicantly more older adults who earned between 1.1 and 3 times the minimum wage, had little education, used public health care, had made more than three medical visits in the previous year, had three or more diseases and three or more signs and symptoms, reported not seeing well with glasses, needed assistance in IADL performance, perceived fatigue, had a lower mean gait speed, were physically inactive and scored above 6 in the EDG (Table 2).
M
ant
o
v
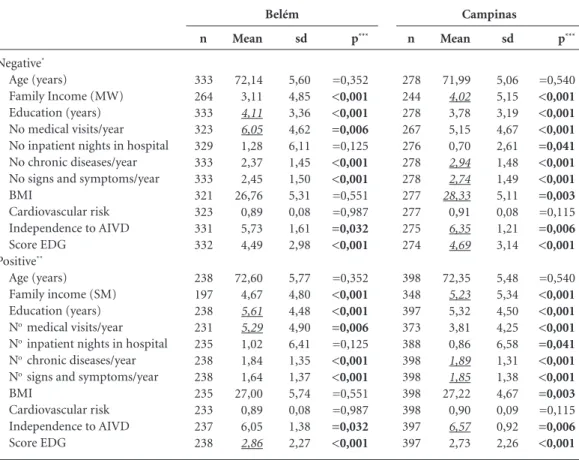
higher score than those with negative self-rated health. For the other variables, the results were similar to those of the elderly of Belém (Table 3).
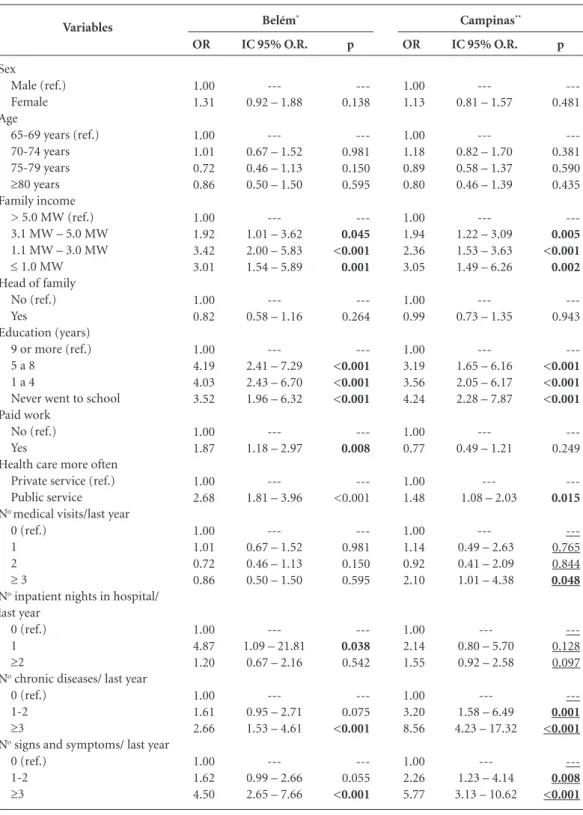
In the univariate logistic regression analy-sis, we investigated associations between neg-ative self-rated health and independent vari-Variables
Sex Male Female Age (years)
65-69 70-79 75-70 80 and older Family income (MW)
≤ 1,0
1,1 a 3,0 3,1 a 5,0 >5,0 Head of family
Yes No
Education (years) Never went to school 1 a 4
5 a 8 9 or more Paid work
Yes No
Health care more often Public service Private service
Number of medical visits /year None
1 2
≥ 3
Number of inpatient nights in hospital/year None
1
≥ 2
Number of diseases None
1-2
≥ 3
Number of Signs and symptoms None
1-2
≥ 3
Table 1. Comparison between the frequencies of the elderly of Belém and Campinas, in sociodemographic and
health variables. FIBRA Unicamp Study, 2008-2009.
it continues
p*
= 0.786
=0.456
≤ 0.001
=0.076
≤ 0.001
=0.447
≤ 0.001
≤ 0.001
=0.940
=0.052
=0.264
n
175 396
222 167 115 67
69 233 80 79
359 212
103 230 141 97
86 475
411 142
36 48 64 406
497 15 52
71 292 208
86 272 213
%
30,65 69,35
38,88 29,25 20,14 11,73
14,97 50,54
17,35 17,14
62,87 37,13
18,04 40,28
24,69
16,99
15,33 84,67
74,32
25,28
6,50 8,66 11,55
73,29
88,12 2,66 9,22
12,43 51,14 36,43
15,06 47,64 37,30
Belém
n
212 464
247 225 134 70
39 232 162 159
391 284
127 360 91 98
93 581
312 338
36 87 111 406
582 17 65
75 309 292
81 327 268
%
31,36 68,64
36,54 33,28 19,82 10,36
6,59 39,19
27,36 26,86
57,93 42,07
18,79
53,25
13,46 14,50
13,80 86,20
48,00
52,00
5,63
13,59 17,34
63,44
87,65 2,56 9,79
11,09 45,71 43,20
11,98 48,37 39,64
e C
ole
tiv
a,
20(12):3653-3668,
2015
ables, showing that in Belém, the most robust associations were one night in a hospital, three or more signs and symptoms, a score above 6 on the EDG, not seeing well without glasses, fatigue and bad hearing and no hearing aid. In Campinas, the strongest associations were with: 3 or more chronic diseases, 3 or more signs and symptoms, a score above 6 on the EDG, having a family income below the minimum wage, 5-8 years of schooling, lower handgrip and having 1 or 2 chronic diseases (Table 4).
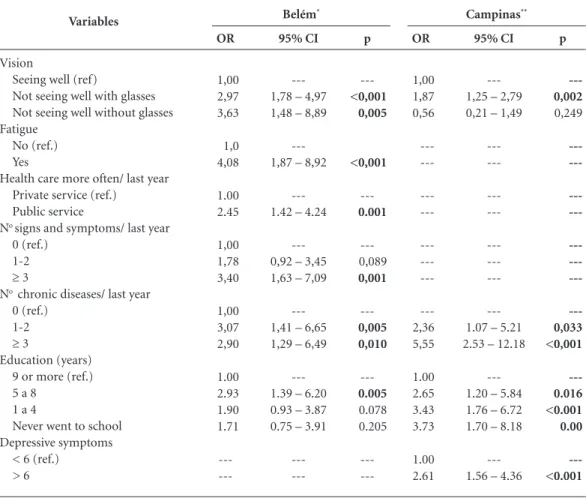
A multivariate analysis applied to the Belém data found associations between negative self-rat-ed health and fatigue, lack of compensation for
sight deiciencies, three or more signs and symp-toms, 1 or 2 diseases, not seeing well with glasses, 5-8 years education and use of public health care. In Campinas multiple associations were observed between negative self-rated health and a higher number of diseases, depressive symptoms ≥ 6, bad vision wearing glasses and less education (Table 5).
Discussion
The same percentages of elderly women and men from the two cities in the study complied with one of the prerequisites for inclusion. In Belém Variables
Nutritional status Underweight Normal weight Overweight Cardiovascular risk
Low Moderate High Vision
Seeing well without glasses Seeing well with glasses Not seeing well without glasses Hearing
Hearing well without hearing aid Hearing badly with hearing aid Hearing badly without hearing aid IADL Performance
Dependent Independent Fatigue
Yes No
Low grip strength Yes
No
Low gait speed Yes
No
Physical inactivity Yes
No
Depressive symptoms
≥ 6 < 5
Table 1. continuation
* Chi-square test.
p*
≤ 0.002
≤ 0.001
≤ 0.001
≤ 0.009
≤ 0.001
=0.910
=0.620
=0.187
=0.019
=0.117
n
124 232 200
240 170 146
282 219 67
451 10 107
270 298
95 446
100 463
105 456
361 210
133 437
%
22,30
41,73 35,97
43,17
30,58 26,26
49,65 38,56
11,80
79,40
1,76 18,84
47,54
52,46
17,56 82,44
17,76 82,24
18,72 81,28
63,22
36,78
23,33 76,67
Belém
n
100 288 287
241 192 242
380 251 38
486 26 155
179 493
116 554
112 559
107 567
383 293
132 539
%
14,81 42,67
42,52
35,70 28,44
35,85
56,80
37,52 5,68
72,86 3,90
23,24
26,64
73,36
17,31 82,69
16,69 83,31
15,88 84,12
56,66
43,34
19,67 80,33
M
ant
o
v
and Campinas, the number of women from each age range in the sample matched the estimated numbers required for the planned sample, as
was the case for the four age ranges for men in Campinas. In Belém, the number of men exam-ined was slightly less than those anticipated for
it continues Variables Sex Male Female Age (years) 65-69 70-79 75-70 80 and older Family income (MW)
≤ 1,0
1,1 a 3,0 3,1 a 5,0 > 5,0 Head of family
Yes No
Education (years) Never went to school 1 a 4
5 a 8 9 or more Paid work
Yes No
Health care more often Public service Private service
Number of medical visits /year None
1 2
≥ 3
Number of inpatient nights in hospital/year#
None 1
≥ 2
Number of diseases #
None 1-2
≥ 3
Number of Signs and symptoms#
None 1-2
≥ 3
Table 2. Distribution of frequencies of the elderly of Belém and Campinas with positive and negative self-rated health, according to
sociodemographic variables and other health variables. FIBRA Unicamp Study, 2008-2009.
e C ole tiv a, 20(12):3653-3668, 2015
the age ranges of 65 to 69 and 80 and above, while the number in the 70 to 74 age range was slightly
more than estimated18. A predominance of
wom-en in study samples of the elderly is a well-known occurrence, and is attributed not only to their greater longevity, but to their greater availability for participating in studies, for reasons related to gender. The most common explanation for the reduced participation of men is also associated with gender and is mainly attributed to a lack of motivation and of valuing information about health, along with less availability on account of
work or leisure commitments during periods in which data collection is normally carried out29.
The majority of elderly people in this study reported living with a family income that was below the minimum wage. Per capita family in-come is an indicator of social capital which is associated with access to essential goods, particu-larly in situations in which there is an absence of or shortcomings in social policies that guarantee accommodation, transport and healthcare of an adequate quality30. In addition, those elderly with
lower incomes are also the ones who seek health Variables Nutritional status Underweight Normal weight Overweight Cardiovascular risk Low Moderate High Vision
Seeing well without glasses Seeing well with glasses Not seeing well without glasses Hearing
Hearing well without hearing aid Hearing badly with hearing aid Hearing badly without hearing aid IADL Performance Dependent Independent Fatigue Yes No
Low grip strength Yes
No
Low gait speed Yes No Physical inactivity Yes No Depressive symptoms
≥ 6 < 5
Table 2. continuation
# In the 12 months preceding the interview. * Chi-square test.
M
ant
o
v
services less, who have lower treatment adher-ence and have less access to medication, when compared with those in a better social condition.
Data about the percentage of elderly who are heads of family and who work match those found in national trends31, showing that the
el-derly make an important economic contribution to the respective families and communities32.
The sample composition of each one of the two cities proves to be different in terms of in-come: in Belém, the family income of 65.5% of the elderly varies between less than one and three times the minimum wage, compared with 45.8% for the same group in Campinas. In Belém, 34.4% of the elderly had a family income of more than three times the minimum wage compared with 54.2% of the same group in Campinas. These data are relected in the greater average income of those from the Campinas sample, which leads one to assume that the structural conditions of-fered by society contributed considerably to the quality of life of its citizens. In this way, the
elder-ly from Campinas had more access to the coop-erative system of medical care (health insurance plans), compared with those from Belém. The latter reported predominantly using public ser-vices, mainly the Uniied Health System (SUS). It is likely that these differences are due to the employment conditions that are available during the lives of the elderly in the two cities. There is a largely unequal geographic distribution of clients of private health insurance plans in Brazil, which relects their greater distribution and expansion in the most economically developed regions of the country33.
Campinas is an industrialized city with more consolidated work conditions, and offers great-er access to coopgreat-erative and private health sys-tems among workers and retirees compared with Belém, where informal work relations for work-ers and elderly retirees are more common. The demand for the health services is fairly unequal among people from different income brackets, with greater advantages for those from more
Negative*
Age (years)
Family Income (MW) Education (years) No medical visits/year No inpatient nights in hospital No chronic diseases/year No signs and symptoms/year BMI
Cardiovascular risk Independence to AIVD Score EDG
Positive**
Age (years) Family income (SM) Education (years)
No medical visits/year
No inpatient nights in hospital
No chronic diseases/year
No signs and symptoms/year
BMI
Cardiovascular risk Independence to AIVD Score EDG
Table 3. Elderly of Belém and Campinas showing values for the distributions of ordinal variables on self-rated
health. FIBRA Unicamp Study, 2008-2009.
* Regular/bad/very bad. ** Good/ Very good. *** Mann Whitney test to compare two independent samples.
Belém Campinas
sd
5,06 5,15 3,19 4,67 2,61 1,48 1,49 5,11 0,08 1,21 3,14
5,48 5,34 4,50 4,25 6,58 1,31 1,38 4,67 0,09 0,92 2,26
p***
=0,540
<0,001 <0,001 <0,001 =0,041 <0,001 <0,001 =0,003
=0,115
=0,006 <0,001
=0,540
<0,001 <0,001 <0,001 =0,041 <0,001 <0,001 =0,003
=0,115
=0,006 <0,001 n
278 244 278 267 276 278 278 277 277 275 274
398 348 397 373 388 398 398 398 398 397 397
Mean
71,99
4,02
3,78 5,15 0,70
2,94 2,74 28,33
0,91
6,35 4,69
72,35
5,23
5,32 3,81 0,86
1,89 1,85
27,22 0,90
6,57
2,73
sd
5,60 4,85 3,36 4,62 6,11 1,45 1,50 5,31 0,08 1,61 2,98
5,77 4,80 4,48 4,90 6,41 1,35 1,37 5,74 0,08 1,38 2,27
p***
=0,352
<0,001 <0,001 =0,006
=0,125
<0,001 <0,001
=0,551 =0,987
=0,032 <0,001
=0,352
<0,001 <0,001 =0,006
=0,125
<0,001 <0,001
=0,551 =0,987
=0,032 <0,001 n
333 264 333 323 329 333 333 321 323 331 332
238 197 238 231 235 238 238 235 233 237 238
Mean
72,14 3,11
4,11 6,05
1,28 2,37 2,45 26,76 0,89 5,73 4,49
72,60 4,67
5,61 5,29
1,02 1,84 1,64 27,00 0,89 6,05
e C ole tiv a, 20(12):3653-3668, 2015
privileged classes34. These inequalities will be
minimized depending on the availability and
or-ganization of public sector services, human re-sources and equipment in each region33.
Variables
Sex
Male (ref.) Female Age
65-69 years (ref.) 70-74 years 75-79 years
≥80 years
Family income > 5.0 MW (ref.) 3.1 MW – 5.0 MW 1.1 MW – 3.0 MW
≤ 1.0 MW
Head of family No (ref.) Yes
Education (years) 9 or more (ref.) 5 a 8
1 a 4
Never went to school Paid work
No (ref.) Yes
Health care more often Private service (ref.) Public service
No medical visits/last year
0 (ref.) 1 2
≥ 3
No inpatient nights in hospital/
last year 0 (ref.) 1
≥2
No chronic diseases/ last year
0 (ref.) 1-2
≥3
No signs and symptoms/ last year
0 (ref.) 1-2
≥3
Table 4. Results of univariate analysis of the associations between negative self-rated health, socio-demographic
variables and other health variables, in Belém and Campinas. FIBRA Unicamp Study, 2008-2009.
it continues
Belém* Campinas**
p ---0.138 ---0.981 0.150 0.595 ---0.045 <0.001 0.001 ---0.264 ---<0.001 <0.001 <0.001 ---0.008 ---<0.001 ---0.981 0.150 0.595 ---0.038 0.542 ---0.075 <0.001 ---0.055 <0.001 OR 1.00 1.31 1.00 1.01 0.72 0.86 1.00 1.92 3.42 3.01 1.00 0.82 1.00 4.19 4.03 3.52 1.00 1.87 1.00 2.68 1.00 1.01 0.72 0.86 1.00 4.87 1.20 1.00 1.61 2.66 1.00 1.62 4.50
IC 95% O.R.
---0.92 – 1.88
---0.67 – 1.52 0.46 – 1.13 0.50 – 1.50
---1.01 – 3.62 2.00 – 5.83 1.54 – 5.89
---0.58 – 1.16
---2.41 – 7.29 2.43 – 6.70 1.96 – 6.32
---1.18 – 2.97
---1.81 – 3.96
---0.67 – 1.52 0.46 – 1.13 0.50 – 1.50
---1.09 – 21.81
0.67 – 2.16
---0.95 – 2.71 1.53 – 4.61
---0.99 – 2.66 2.65 – 7.66
p ---0.481 ---0.381 0.590 0.435 ---0.005 <0.001 0.002 ---0.943 ---<0.001 <0.001 <0.001 ---0.249 ---0.015 ---0.765 0.844 0.048 ---0.128 0.097 ---0.001 <0.001 ---0.008 <0.001 OR 1.00 1.13 1.00 1.18 0.89 0.80 1.00 1.94 2.36 3.05 1.00 0.99 1.00 3.19 3.56 4.24 1.00 0.77 1.00 1.48 1.00 1.14 0.92 2.10 1.00 2.14 1.55 1.00 3.20 8.56 1.00 2.26 5.77
IC 95% O.R.
---0.81 – 1.57
---0.82 – 1.70 0.58 – 1.37 0.46 – 1.39
---1.22 – 3.09 1.53 – 3.63 1.49 – 6.26
---0.73 – 1.35
---1.65 – 6.16 2.05 – 6.17 2.28 – 7.87
---0.49 – 1.21
1.08 – 2.03
0.49 – 2.63 0.41 – 2.09 1.01 – 4.38
0.80 – 5.70 0.92 – 2.58
1.58 – 6.49 4.23 – 17.32
M
ant
o
v
Variables
Nutritional status Underweight (ref.) Normal weight Overweight/obesity Cardiovascular risk
Low (ref.) Moderate High Vision
Seeing well (ref.)
Not seeing well with glasses Not seeing well without glasses Hearing
Hearing well (ref.)
Hearing badly with hearing aid Hearing badly and no hearing aid IADL Performance
Independent (ref.) Dependent Fatigue
No (ref.) Yes
Low grip strength No (ref.) Yes
Low gait speed No (ref.) Yes
Physical inactivity No (ref.) Yes
Depressive symptoms < 6 (ref.)
> 6
Table 4. continuation
* Belém: OR (Odds Ratio) = Odds ratio for negative self-rated health; (n=238 positive e n=333 negative). 95% CI = 95% conidence interval. Ref.: reference level. ** Campinas: OR (Odds Ratio) = Odds ratio for negative self-rated health; (n=398 positive e n=278 negative). 95% CI = 95% conidence interval. Ref.: reference level.
Belém* Campinas**
p
0.669 0.635
0.213
0.378
---<0.001 <0.001
---0.733
0.002
---0.140
---0.728
---0.926
---0.007
---<0.001
---0.728
OR
1.00 0.91 0.90
1.00 1.29 1.21
1.00 2.93 3.95
1.00 0.80 2.06
1.00 1.29
1.00 1.08
1.00 1.02
1.00 1.61
1.00 3.47
1.00 1.08
95% CI
---0.58 – 1.41 0.57 – 1.41
---0.86 – 1.92 0.80 – 1.83
---2.02 – 4.26 2.15 – 7.25
---0.23 – 2.82 1.30 – 3.27
---0.92 – 1.80
---0.70 – 1.68
---0.66 – 1.57
---1.14 – 2.27
---2.20 – 5.48
---0.70 – 1.68
p
---0.570 0.057
---0.667 0.106
---<0.001 0.745
---0.199 0.078
---0.005
---<0,001
---0.066
---0.010
---0.002
---<0.001 OR
1.00 1.15 1.58
1.00 0.92 1.35
1.00 2.13 1.12
1.00 0.56 1.39
1.00 1.63
1.00 2.26
1.00 1.47
1.00 1.73
1.00 1.63
1.00 3.80
95% CI
0.71 – 1.85 0.99 – 2.54
---0.62 – 1.36 0.94 – 1.93
1.54 – 2.96 0.56 – 2.24
---0.23 – 1.36 0.96 – 2.00
---1.16 – 2.31
----1.59 – 3.39
---0.98 – 2.20
---1.14 – 2.62
---1.19 – 2.24
---2.54 – 5.68
With regard to elderly people with between 1 and 4 years of schooling, the data for the two cities show different proiles. Given that Campi-nas has better development conditions, it was to be expected that the city would have a greater frequency of elderly in this group. For the same reasons, it was to be expected that Belém would have more elderly people with no formal school-ing when compared with Campinas, however this did not prove to be the case. In addition, in Belem there was a greater percentage of elderly people with more than ive years of schooling,
e C
ole
tiv
a,
20(12):3653-3668,
2015
Variables
Vision
Seeing well (ref)
Not seeing well with glasses Not seeing well without glasses Fatigue
No (ref.) Yes
Health care more often/ last year Private service (ref.)
Public service
No signs and symptoms/ last year
0 (ref.) 1-2
≥ 3
No chronic diseases/ last year
0 (ref.) 1-2
≥ 3
Education (years) 9 or more (ref.) 5 a 8
1 a 4
Never went to school Depressive symptoms
< 6 (ref.) > 6
Table 5. Results of the multivariate analysis for the association between negative self-rated health,
socio-demographic variables and other health variables in Belém* and Campinas**. FIBRA Unicamp Study, 2008-2009.
*Belém: OR (Odds Ratio) = Odds ratio for negative self-rated health; (n=163 positive e n=211 negative). 95% CI= 95% conidence interval. Ref.: reference level. ** Campinas: OR (Odds Ratio) = Odds ratio for negative self-rated health; (n=300 positive e n=217 negative). 95% CI= 95% conidence interval. Ref.: reference level.
Belém* Campinas**
p
---<0,001 0,005
<0,001
---0.001
---0,089
0,001
---0,005 0,010
---0.005
0.078 0.205
---OR
1,00 2,97 3,63
1,0 4,08
1.00 2.45
1,00 1,78 3,40
1,00 3,07 2,90
1.00 2.93 1.90 1.71
---95% CI
---1,78 – 4,97 1,48 – 8,89
---1,87 – 8,92
---1.42 – 4.24
---0,92 – 3,45 1,63 – 7,09
---1,41 – 6,65 1,29 – 6,49
---1.39 – 6.20 0.93 – 3.87 0.75 – 3.91
---p
---0,002
0,249
---0,033 <0,001
---0.016 <0.001 0.00
---<0.001 OR
1,00 1,87 0,56
---2,36 5,55
1.00 2.65 3.43 3.73
1.00 2.61
95% CI
---1,25 – 2,79 0,21 – 1,49
---1.07 – 5.21 2.53 – 12.18
---1.20 – 5.84 1.76 – 6.72 1.70 – 8.18
---1.56 – 4.36
The elderly from Belém showed worse in-dicators compared with those from Campinas with regard to the number of illnesses, number of signs and symptoms, Independence for instru-mental activities of daily living (IADL) and de-pressive symptoms. However, in Campinas there were more elderly people with overweight and obesity and more with a greater risk of cardio-vascular disease. When one refers to the medical consultation and hospitalizations of both sam-ples, one inds that the elderly from Belém re-ported going to the doctor more often than their counterparts in Campinas, and that the samples showed no differences in terms of the number of hospitalizations in the previous year.
The literature recognizes the relation-ship between hospitalizations, consultations, chronic diseases and negative self-evaluation of
health7,14,34,35. However, it is dificult to come up
M
ant
o
v
health services of a poorer quality compared with those from Campinas? If this was the case, this reality is not relected in the opinions of the el-derly from Belém about their own health status, when taking into consideration schooling levels. In this city, only having 5 to 8 years of schooling (compared with having 9 or more) is associated with negative self-evaluation of health. These details about the data should be compared with data from national and international studies that show self-evaluation of health to be strongly in-luenced by levels of schooling among the elder-ly11-13. Moreover, one inds that the level of
ed-ucation is the main cause for social inequalities in health because it relects the human capital of people (i.e. cognitive and non-cognitive abilities that might control or inluence an individual’s life, providing him or her with the necessary re-sources, that go beyond inancial limitations)36.
To suffer the effects of sight deiciency that is not treated is something that occurs more commonly in less favourable socioeconom-ic and health contexts, compared with in more developed environments. In this research, this occurrence affected the negative self-evaluation of health of the elderly from the two cities, but was more pronounced among those from Belem. This may therefore be considered a call for com-mitting greater attention to shortcomings in the social protection system and healthcare provi-sion for the elderly population. In the multivari-ate model, this study did not ind an association between negative self-evaluated health and hear-ing deiciencies, despite the fact that the literature points to a relationship between these two con-ditions37. It may be important to call attention
to the fact that this association appeared in the univariate analysis in the city of Belém, reinforc-ing the idea that this may be an alarm call for the health systems.
The results support the notion that self-per-ception of health is multidimensional and
re-lects, globally, the opinion of the elderly about themselves and about questions that include biological, psychological and sociohistorical ele-ments of their experience. It relects judgeele-ments not only at the moment that they are made, but during an individual’s entire life, and includes mechanisms for social comparison, motives and expectations. This current study addressed the dependent variable, but one should not forget the mediating role of the self-evaluation of health variable, which is found between the inluence a number of variables including those for econom-ic, health, functionality, self-care, belief in capac-ity and subjective well-being. The evaluation of health during aging does not only relate to the domains of the individual and of the private, but also to those relating to resources and social opportunities, which means that it should be in-cluded in the political and social policy spheres38.
e C
ole
tiv
a,
20(12):3653-3668,
2015
Collaborations
EP Mantovani conceived the study, did a litera-ture review and data analysis followed. AL Neri, coordinator of the iber study, Unicamp polo, contributed text editing and SR de Lucca con-tributed in inal revision of the manuscript.
Acknowledgements
Andréa Cristina Garofe Fortes-Burgos, Stella Vidal de Souza Torres, Flávia Silva Arbex Borim, Débora Dias da Silva Harmitt, José Guilherme de Arruda Moura, Natália de Oliveira Rodrigues and Helymar Machado. The Conselho Nacion-al de Desenvolvimento Cientíico e Tecnológico (CNPq).
References
Veras R. Envelhecimento populacional contemporâ-neo: demandas, desaios e inovações. Rev Saude Publica 2009; 43(3):548-554.
Yang Y, George LK. Functional disability, disability transitions, and depressive symptoms in late life. J Ag-ing Health 2005; 17(3):263-292.
Fried L, Tangen C, Walston J, Newman A, Hirsch C, Gottdiener J, Seeman T, Tracy R, Kop WJ, Burke G, McBurnie MA; Cardiovascular Health Study Collabo-rative Research Group. Frailty in older adults: evidence for a phenotype. J Gerontol A Biol Sci Med Sci 2001; 56(3):M146-156.
Szanton SL, Seplaki CL, Thorpe Junior RJ, Allen JK, Fried LP. Socioeconomic status is associated with frail-ty: the Women’s Health and Aging Studies. J Epidemiol Community Health 2010; 64(1):63-67.
Cramm JM, Twisk J, Nieboer AP. Self-management abilities and frailty are important for healthy aging among community-dwelling older people; a cross-sec-tional study. BMC Geriatrics 2014; 14:28.
Martinez DJ, Kasl SV, Gill TM, Barry LC. Longitudinal association between self-rated health and timed gait among older persons. J Gerontol B Psychol Sci Soc Sci 2010; 65(6):715-719.
Lima MG, Barros MBA, César CLG, Carandina L, Goldbaum M. Impact of chronic disease on quality of life among the elderly in the state of São Paulo, Brazil: a population-based study. Rev Panam Salud Publica 2009; 25(4):314-321.
Latham K, Peek CW. Self-rated health and morbidity onset among late midlife U.S. adults. J Gerontol B Psy-chol Sci Soc Sci 2013; 68(1):107-116.
Geib LTC. Determinantes sociais da saúde do idoso. Cien Saude Colet 2012; 17(1):123-133.
Lima-Costa MF, Firmo JOA, Uchôa E. A estrutura da auto-avaliação da saúde entre idosos: projeto Bambuí. Rev Saude Publica 2004; 38(6):827-834.
Ramos M. Impact of socioeconomic status on Brazilian elderly health. Rev Saude Publica 2007; 41(4):616-624. Robert SA, Cherepanov D, Palta M, Dunham NC, Feeny D, Fryback DG. Socioeconomic status and age variations in health-related quality of life: results from the National Health Measurement Study. J Gerontol B Psychol Sci Soc Sci 2009; 64(3):378-389.
Huguet N, Kaplan MS, Feeny D. Socioeconomic status and health-related quality of life among elderly people: Results from the Joint Canada/United States Survey of Health. Soc Sci Med 2008; 66(4):803-810.
Silva RJS, Smith-Menezes A, Tribess S, Rómo-Perez V, Virtuoso Júnior JS. Prevalência e fatores associados à percepção negativa da saúde em pessoas idosas no Bra-sil. Rev Bras Epidemiol 2012; 15(1):49-62.
Nunes APN, Barreto SM, Gonçalves LG. Relações so-ciais e autopercepção da saúde: Projeto Envelhecimen-to e Saúde. Rev Bras Epidemiol 2012; 15(2):415-428. Blazer DG. How do you fell about…? Health oput-comes in late life and self-perceptions of health and well-being. Gerontologist 2008; 48(4):415-422. Instituto Brasileiro de Geograia e Estatística (IBGE). Síntese de indicadores sociais: Uma análise das condi-ções de vida da população brasileira. Estudos & Pesqui-sas: Informação demográica e socioeconômica; 2010 [acessado 2011 maio 12 ]. Disponível em: http//www. ibge.gov.br
1.
2.
3.
4.
5.
6.
7.
8.
9. 10.
11. 12.
13.
14.
15.
16.
M
ant
o
v
Neri AL, Yassuda MS, Araújo LF, Eulálio MC, Cabral BE, Siqueira MEC, Santos GA, Moura JGA. Metodolo-gia e peril sociodemográico, cognitivo e de fragilidade de idosos comunitários de sete cidades brasileiras: Es-tudo FIBRA. Cad Saude Publica 2013; 29(4):778-792. Brucki SMD, Nitrini R, Caramelli P, Bertolucci PHF, Okamoto IH. Sugestões para o uso do Mini-Exame do Estado Mental no Brasil. Arq Neuropsiquiatr 2003; 61(3B):777-781.
Rauen MS, Moreira EAM, Calvo MCM, Lobo AS. Ava-liação do estado nutricional de idosos institucionaliza-dos. Rev. Nutrição 2008; 21(3):303-310.
World Health Organization (WHO). Obesity: prevent-ing and managprevent-ing the global epidemic. Geneva: WHO; 1998. Report of the WHO Consultation on Obesity. Lohman TG, Roche AF, Martorell R. Anthropometric Standardization Reference Manual. Champaign, Illi-nois: Human Kinetics; 1988.
Batistone S, Neri A, Cupertino A. Validade da escala de depressão do Center for Epidemiological Studies entre idosos brasileiros. Rev Saude Publica 2007; 41(4):589-605.
Lustosa L, Pereira D, Dias R, Britto R, Pereira L. Tradu-ção, adaptação transcultural e análise das propriedades psicométricas do Questionário Minnesota de Atividades Físicas e de Lazer. Belo Horizonte: Universidade Federal de Minas Gerais; 2010.
Ainsworth B, Haskell WL, Whitt MC, Irwin ML, Swartz AM, Strath SJ, O’Brien WL, Bassett DR Jr, Schmitz KH, Emplaincourt PO, Jacobs DR Jr, Leon AS. Com-pendium of physical activities: an update of activity codes and MET intensities. Med Sci Sports Exerc 2000; 32(Supl. 9):S498-516.
Guralnik JM, Simonsick EM, Ferrucci L, Glynn RJ, Berkman LF, Blazer DG, Scherr PA, Wallace RB. A short physical performance battery assessing lower extremity function: association with self-reported disability and prediction of mortality and nursing home admissions. J Gerontol Med Sci 1994; 49(2):85-94.
Lawton MP, Brody EM. Assessment of older people: self-maintaining and instrumental activities of daily living. Gerontologist 1969; 9(3):179-186.
Almeida OP, Almeida SA. Short versions of the geri-atric depression scale: a study of their validity for the diagnosis of a major depressive episode according to ICD-10 and DSM-IV. Int J Geriatr Psychiatry 1999; 14(10):858-865.
James BD, Boyle PA, Buchman AS, Bennett DA. Rela-tion of late-life social activity with incident disability among community dwelling older adults. J Gerontol Med Sci 2011; 66A(4):467-473.
18.
19.
20.
21.
22.
23.
24.
25.
26.
27.
28.
29.
Instituto Brasileiro de Geograia e Estatística. Indica-dores sociodemográicos e de saúde no Brasil. Rio de Janeiro: Instituto Brasileiro de Geograia e Estatística; 2009. (Estudos e Pesquisas: Informação Demográica e Socioeconômica, 25). [acessado 2011 maio 12]. Dispo-nível em: http//www.ibge.gov.br
Camarano AA, Kanso S, Mello JL, Pasinato MT. Famí-lias: espaço de compartilhamento de recursos e vulnera-bilidades. In: Caramano AA, organizadora. Os Novos Brasileiros: muito além dos 60? Rio de Janeiro: IPEA; 2004. p. 137-167.
Camarano MA, Ghouri SK. Família de idosos: ninhos vazios? 2003:1-20 [acessado 2013 jan 8]. Disponível em: http//www.ipea.gov.br
Almeida G, Sarti FM, Ferreira FF, Diaz MDM, Cam-pino AC. Analysis of the evolution and determinants of income-related inequalities in the brazilian health system, 1998-2008. Reva Panam Salud Publica 2013; 33(2):90-97.
Galenkamp H, Braam AW, Huisman M, Deeg DJ. So-matic multimorbidity and self-rated health in the old-er population. J Gerontol B Psychol Sci Soc Sci 2011; 66(3):380-386.
Pagotto V, Nakatani AYK, Silveira EA. Fatores associa-dos à autoavaliação de saúde ruim em iassocia-dosos usuários do Sistema Único de Saúde. Cad Saude Publica 2011; 27(8):1593-602.
Fonseca MGUP, Firmo JOA, Loyola-Filho AI, Uchoa E. Papel da autonomia na autoavaliação da saúde do ido-so. Rev Saude Publica 2010; 44(1):159-165.
Subramanian SV, Kubzansky L, Berkman L, Fay M, Kawachi I. Neighborhood effects on the self-rated health of elders: uncovering the relative importance of structural and service-related neighborhood environ-ments. J Gerontol B Psychol Sci Soc Sci 2006; 61(3):153-160.
Minayo MCS, Coimbra Júnior CE. Antropologia, Saúde e Envelhecimento. Rio de Janeiro: Editora Fiocruz; 2002.
Article submitted 01/07/2014 Approved 15/04/2015
Final version submitted 17/04/2015 30.
31.
32.
33.
34.
35.
36.
37.