Alcoholic beverage
consumption among
adults: sociodemographic
characteristics and trends
Consumo de bebidas alcoólicas
na população adulta brasileira:
características sociodemográficas
e tendência
Erly Catarina MouraI Deborah Carvalho MaltaII,III
IDepartment of Epidemiological research on Nutrition and Health at Universidade de São Paulo (USP) – São Paulo (SP), Brazil
IIGeneral Coordination of Non-Communicable Diseases and Conditions –
Secretariat of Health Surveillance – Ministry of Health – Brasília (DF), Brazil
IIINursing School at Universidade Federal de Minas Gerais (UFMG) –
Belo Horizonte (MG), Brazil
Study carried out at the Ministry of Health.
Finacial support: none.
Correspondence to: Erly Catarina Moura – SQSW 504 Bloco F apto 306 – CEP: 70673-506 – Brasília (DF), Brazil – E-mail: [email protected].
Conflict of interest: nothing to declare.
Abstract
Objective: To estimate the prevalence of alcohol consumption, identify the associ-ated sociodemographic characteristics in 2006, and evaluate consumption trends from 2006 to 2009. Methods: We evalu-ated 54,369 adults living in the 26 Brazilian state capitals and the Federal District. Usual consumption was related to drinking at least one dose of alcohol in the past 30 days, and binge consumption meant 5 or more doses for men and 4 or more for women at least once in the past 30 days. Results: he usual consumers represented 38.1% of the studied population and the binge drinkers were 16.2%; both frequencies were higher among men than women. he variables associated to the usual and abusive alcohol consump-tion were age, marital status and inserconsump-tion in the job market for both genders and skin color for women. Schooling was only associ-ated for usual consumers. Conclusion:
he trend of abusive alcohol consumption increased in both genders. Data endorse the need for national public policies aiming to prevent the abusive consumption of alcohol, mainly among the youngest.
Introduction
Alcohol consumption is a common and historical habit in many societies. However, excessive alcohol use is considered as the most important risk factor for early deaths and disabilities in the world, including heart, liver, nutritional diseases, and some types of cancer, besides causing chemical dependency and enabling the occurrence of violence and accidents1.
In the past decades, there has been the attempt to universalize the patterns of alcohol consumption, considering the consumed dose (alcohol content) and the frequency of consumption. Many deinitions have been established, from moderate to heavy (heavy drinking) and abusive (binge drinking), from sporadic to dependent. he Center for Disease Control and Prevention, which has been monitoring alcohol consumption in the United States since 1995, estimates the consumption of at least one dose in the past 30 days as intense (more than one dose a day for women and more than two doses a day for men), and as abusive (initially with four or more doses for women and ive or more doses for men at least once in the past 30 days)2. Nowadays,
ive or more doses are considered for both genders3, according to the National Institute
of Alcohol Abuse and Alcoholism4. However,
literature is controversial as to the beneits for the body, because even in small doses, alcohol consumption is not recommended in some situations: for children, adoles-cents, pregnant women, drivers, workers who deal with heavy equipment, people with depression, recovering alcoholics, among others5.
Data from the World Health Organization (WHO) show that excessive alcohol use has increased in the world, ranging from 1.4% in India to 31.8% in Colombia, with riskier and more frequent consumption patterns in low and middle-income countries6; thus, diferent
strat-egies to reduce the harmful consumption of alcohol have been discussed by WHO and established in many countries.
Resumo
Objetivo: Estimar o consumo de bebidas alcoólicas, identiicar as características sociodemográicas associadas a este mo em 2006 e avaliar a tendência de consu-mo de 2006 a 2009. Métodos: Foram avalia-dos, em 2006, 54.369 adultos residentes nas capitais de estados brasileiros e no Distrito Federal. Considerou-se consumo habitual a ingestão de qualquer quantidade de bebida alcoólica nos últimos 30 dias, e consumo abusivo a ingestão de mais de 5 doses para homens ou mais de 4 doses para mulheres em pelo menos uma ocasião nos últimos 30 dias. Resultados: O consumo habitual de bebidas alcoólicas atingiu 38,1% da popula-ção estudada e o de consumo abusivo 16,2%, sendo a frequência dos dois padrões maior em homens do que em mulheres. As variáveis associadas ao consumo de bebidas alcoólicas foram: idade, união conjugal, inserção no mercado de trabalho em ambos os sexos e cor de pele para mulheres nos dois padrões de consumo; escolaridade associou-se apenas para consumo habitu-al. Conclusão: A tendência de consumo abusivo de bebidas alcoólicas é crescente nos dois sexos. Os dados mostram a urgên-cia de políticas públicas nacionais voltadas para a prevenção do consumo excessivo de bebidas alcoólicas, especialmente junto à população mais jovem.
In 2006, the telephone-based risk factor surveillance system for chronic diseases (VIGITEL) was established in Brazil, and one of the assessed subjects was alcohol consumption, which enables the analysis of the patterns of alcohol use in the population aged 18 years or more7. he irst version of
VIGITEL8 analyzed the weekly frequency
of alcohol consumption for individuals who reported alcohol use in the past 30 days. For those who reported some weekly consumption, there was a question about consuming more than two doses on the same occasion for men and more than one for women. For those who answered “yes”, the analysis was about consuming more than ive doses on the same occasion for men and more than four doses for women. he second version9, in 2007, only
questioned maximum limits (ive and four doses for men and women, respectively), which remained the same in 200810. In the
fourth version of VIGITEL, in 200911, these
limits were altered to ive or more and four or more doses, which were also maintained in 2010. Such changes were made in order to adjust the analysis to the international standard, and reduce the duration of the interview, without losing minimum comparison.
herefore, this paper aimed to estimate alcohol use and identify the sociodemo-graphic characteristics associated with this consumption in the adult population of the 26 state capitals and the Federal District, besides evaluating the consumption trend from 2006 to 2009.
Methods
Each year, VIGITEL interviews over 54,000 individuals, performing at least 2,000 interviews per location, being considered as a cross-sectional study. he assessed population is obtained by a random sample of the households with at least one landline telephone line and by the selection of one adult living in each household to participate. In order to expand the data for the general population, VIGITEL uses
post-stratiication weighting factors that consist of the multiplication of the following ratios: number of adults in each household/ number of landline telephone lines in each household; frequency of speciic categories of gender, age and schooling identiied in Census 2000 in each city/frequency of the same categories analyzed by VIGITEL in each city; and number of adults identiied in each city in Census 2000/number of adults analyzed by VIGITEL in each city.
For this study, two patterns of alcohol use were considered: 1) usual – alcohol consumption in the past 30 days, regardless of the dose – and 2) abusive – consumption of more than 5 doses for men and more than 4 doses for women, in at least one occasion in the past 30 days. Alcohol consumption was considered as a dependent variable, categorized as present or absent according to each standard. Independent variables were: age (divided into six age groups: 18 to 24, 25 to 34, 35 to 44, 45 to 54, 55 to 64 or 65 years or older), ethnicity (divided into two groups, white or non-white), years of schooling (categorized in four groups: 0 to 4, 5 to 8, 9 to 11 or 12 years or more), stable union (categorized in two groups, yes or no), inclusion in the job market (categorized in two groups, yes or no).
Frequency estimates as to alcohol consumption were calculated according to independent variables, with a 95% coni-dence interval.
he year 2006 was chosen because of the basic alcohol consumption analyzed by VIGITEL. Crude and adjusted preva-lence ratios of alcohol consumption were separately calculated for men and women, considering a 5% signiicance level (p<0.05). Poisson regression was used to calculate the prevalence ratio. Calculations were performed with the software Stata, version 9.2 (Stata Corp, College Station, Texas, USA).
abusive consumption trend was presented between 2006 and 2009.
VIGITEL is approved by the Human Research Ethics Committee of the Ministry of Health, and the interviews were conducted only after verbal consent.
Results
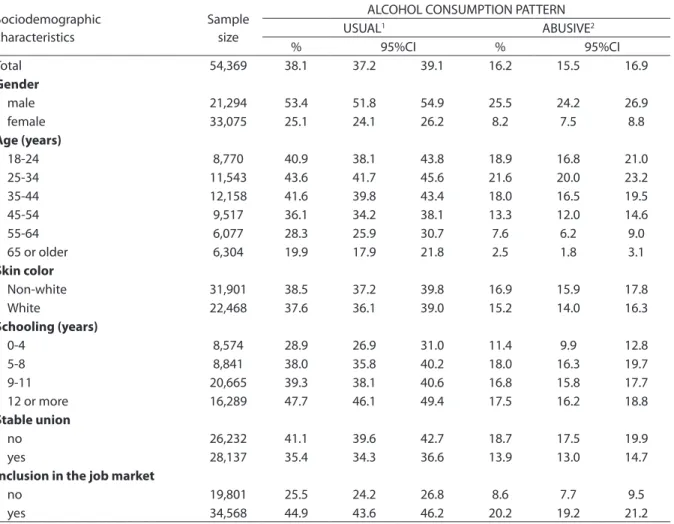
Table 1 shows the frequency of alcohol consumption according to the independent variables. The habit of
consuming alcohol reached 38.1% of the total population, out of which 42.0 (16.2% of the total) were regarded as abusive consumers. These numbers are usually higher among men: 2.1 times higher for usual and 3.1 times higher for abusive consumption. Alcohol use is more prevalent in the age group between 18 and 44 years, affecting approximately 42% of the population of usual consumption; after this age, the prevalence decreases and affects approximately 20% of those
Table 1. Frequency (%)* of alcoholic beverages consumption for adults (≥18 years of age) according to sociodemographic characteristics and consumption trend. Brazil, VIGITEL – 2006
Tabela 1. Frequência (%)* de consumo de bebidas alcoólicas em adultos (≥ 18 anos de idade) segundo características sociode-mográficas e padrão de consumo. Brasil, VIGITEL – 2006
*Percentage adjusted to represent the entire adult Brazilian population according to the Demographic Census of 2000 and to take into account the
population weight of each city;1one or more doses in the last 30 days; 2 more than five (men) or more than four (women) doses at least one occasion
in the last 30 days; VIGITEL– Brazilian surveillance of risk and protection factors for chronic non-communicable diseases throughout telephone survey; IC 95% – Confidence Interval of 95%
*Percentual ajustado para representar a população adulta total segundo o Censo Demográfico de 2000 e para levar em conta o peso populacional de cada
cidade; 1uma ou mais doses nos últimos 30 dias; 2mais de cinco (homens) ou mais de quatro (mulheres) doses em pelo menos uma ocasião nos últimos 30 dias; VIGITEL – Vigilância de fatores de risco e proteção para doenças crônicas não transmissíveis por inquérito telefônico; IC 95% – Intervalo de Confiança de 95%
Sociodemographic characteristics
Sample size
ALCOHOL CONSUMPTION PATTERN
USUAL1 ABUSIVE2
% 95%CI % 95%CI
Total 54,369 38.1 37.2 39.1 16.2 15.5 16.9
Gender
male 21,294 53.4 51.8 54.9 25.5 24.2 26.9
female 33,075 25.1 24.1 26.2 8.2 7.5 8.8
Age (years)
18-24 8,770 40.9 38.1 43.8 18.9 16.8 21.0
25-34 11,543 43.6 41.7 45.6 21.6 20.0 23.2
35-44 12,158 41.6 39.8 43.4 18.0 16.5 19.5
45-54 9,517 36.1 34.2 38.1 13.3 12.0 14.6
55-64 6,077 28.3 25.9 30.7 7.6 6.2 9.0
65 or older 6,304 19.9 17.9 21.8 2.5 1.8 3.1
Skin color
Non-white 31,901 38.5 37.2 39.8 16.9 15.9 17.8
White 22,468 37.6 36.1 39.0 15.2 14.0 16.3
Schooling (years)
0-4 8,574 28.9 26.9 31.0 11.4 9.9 12.8
5-8 8,841 38.0 35.8 40.2 18.0 16.3 19.7
9-11 20,665 39.3 38.1 40.6 16.8 15.8 17.7
12 or more 16,289 47.7 46.1 49.4 17.5 16.2 18.8
Stable union
no 26,232 41.1 39.6 42.7 18.7 17.5 19.9
yes 28,137 35.4 34.3 36.6 13.9 13.0 14.7
Inclusion in the job market
no 19,801 25.5 24.2 26.8 8.6 7.7 9.5
aged 65 years or older. The same pattern repeats itself for abusive consumption (ranging from 19% in the population aged 18 to 44 years to 2% after the age of 64). Schooling directly influences usual consumption, which ranges from 28.9% in lower levels of schooling to 47.7% in higher levels; abusive consumption increases from 11.4 to 17.5%. Those who are in a stable union demonstrated to consume less alcohol in both patterns, as well as those who work. In relation to
skin color, there were no differences as to consumption patterns.
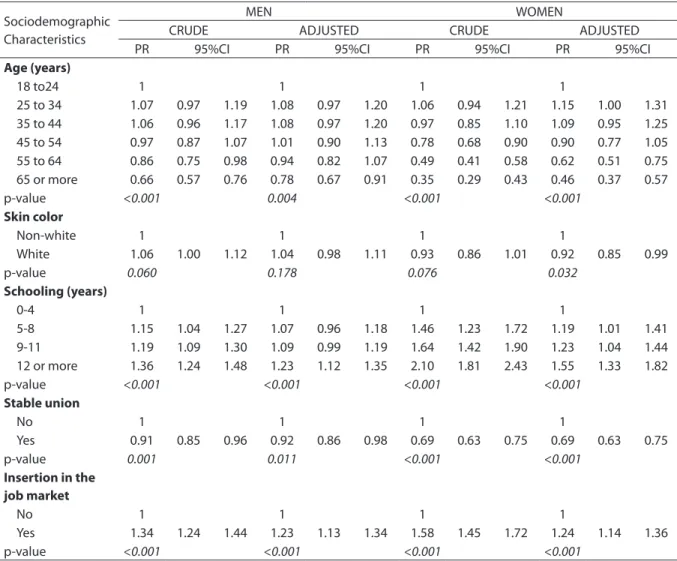
For both genders, the prevalence ratio of usual alcohol consumption decreases with age, increases with schooling, is lower for individuals in a stable union and higher among those who work. After adjustments regarding the females, the ratio is lower for those who have white skin (Table 2).
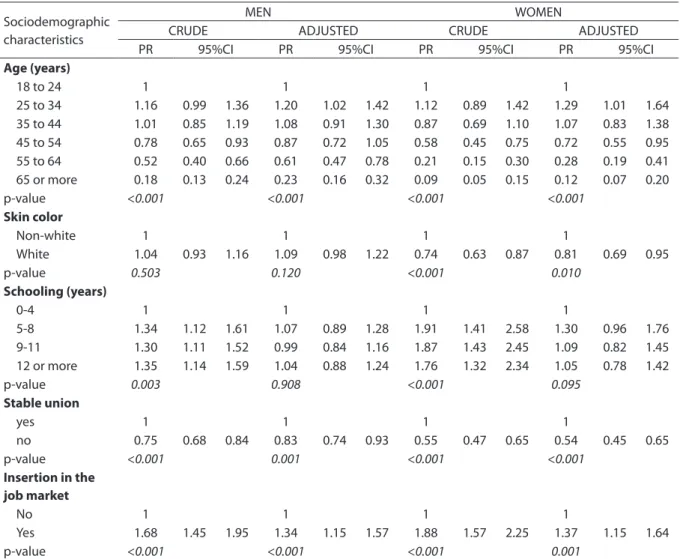
Abusive alcohol consumption (Table 3), both for men and women, shows that preva-lence ratio increases with aging, is lower for
Table 2. Prevalence Ratio (PR)* of usual** alcohol consumption for men and women (≥18 years of age) according to
socio-demographic characteristics and consumption patterns. Brazil, VIGITEL – 2006
Tabela 2. Razão de Prevalência (PR)* de consumo habitual** de bebidas alcoólicas em homens e mulheres (≥18 anos de idade) segundo características sociodemográficas e padrão de consumo. Brasil, VIGITEL – 2006
* Percentage adjusted to represent the entire adult Brazilian population according to the Demographic Census of 2000 and to take into account the
population weight of each city; **one or more doses in the last 30 days; VIGITEL – Brazilian surveillance of risk and protection factors for chronic
non-commu-nicable diseases throughout telephone survey; 95%CI – Confidence Interval of 95%
*Percentual ajustado para representar a população adulta total segundo o Censo Demográfico de 2000 e para levar em conta o peso populacional de cada cidade;
**uma ou mais doses nos últimos 30 dias; VIGITEL – Vigilância de fatores de risco e proteção para doenças crônicas não transmissíveis por inquérito telefônico; IC
95% – Intervalo de Confiança de 95%
Sociodemographic Characteristics
MEN WOMEN
CRUDE ADJUSTED CRUDE ADJUSTED
PR 95%CI PR 95%CI PR 95%CI PR 95%CI
Age (years)
18 to24 1 1 1 1
25 to 34 1.07 0.97 1.19 1.08 0.97 1.20 1.06 0.94 1.21 1.15 1.00 1.31 35 to 44 1.06 0.96 1.17 1.08 0.97 1.20 0.97 0.85 1.10 1.09 0.95 1.25 45 to 54 0.97 0.87 1.07 1.01 0.90 1.13 0.78 0.68 0.90 0.90 0.77 1.05 55 to 64 0.86 0.75 0.98 0.94 0.82 1.07 0.49 0.41 0.58 0.62 0.51 0.75 65 or more 0.66 0.57 0.76 0.78 0.67 0.91 0.35 0.29 0.43 0.46 0.37 0.57
p-value <0.001 0.004 <0.001 <0.001
Skin color
Non-white 1 1 1 1
White 1.06 1.00 1.12 1.04 0.98 1.11 0.93 0.86 1.01 0.92 0.85 0.99
p-value 0.060 0.178 0.076 0.032
Schooling (years)
0-4 1 1 1 1
5-8 1.15 1.04 1.27 1.07 0.96 1.18 1.46 1.23 1.72 1.19 1.01 1.41 9-11 1.19 1.09 1.30 1.09 0.99 1.19 1.64 1.42 1.90 1.23 1.04 1.44 12 or more 1.36 1.24 1.48 1.23 1.12 1.35 2.10 1.81 2.43 1.55 1.33 1.82
p-value <0.001 <0.001 <0.001 <0.001
Stable union
No 1 1 1 1
Yes 0.91 0.85 0.96 0.92 0.86 0.98 0.69 0.63 0.75 0.69 0.63 0.75
p-value 0.001 0.011 <0.001 <0.001
Insertion in the job market
No 1 1 1 1
Yes 1.34 1.24 1.44 1.23 1.13 1.34 1.58 1.45 1.72 1.24 1.14 1.36
people who are in a stable relationship and higher for those who work. However, after the adjustment, schooling loses signiicance for both genders. White women presented less chances of consuming alcohol (preva-lence ratio=0.81).
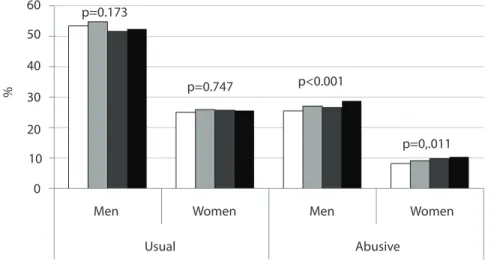
Figure 1 shows that the usual alcohol consumption in the assessed population remained constant from 2006 to 2009; however, abusive consumption increased for both genders.
Discussion
he habit of consuming alcohol at least once in the past 30 days was present in 38.1% of the adult population in the 26 state capitals and the Federal District, while the prevalence of abusive consumption (more than 5 doses for men and more than 4 doses for women at least once in the past 30 days) afected 16.2% of the total population, which represents more than
Table 3. Prevalence Ration (PR)* of alcohol abuse** in men and women (≥18 years of age) according to sociodemographic
characteristics and consumption trend. Brazil, VIGITEL – 2006
Tabela 3. Razão de Prevalência (PR)* de consumo abusivo** de bebidas alcoólicas em homens e mulheres (≥18 anos de idade) segundo características sociodemográficas e padrão de consumo. Brasil, VIGITEL – 2006
*Percentage adjusted to represent the entire adult Brazilian population according to the Demographic Census of 2000 and to take into account the
population weight of each city; ** more than five (men) or more than four (women) doses at least one occasion in the last 30 days; VIGITEL – Brazilian
surveillance of risk and protection factors for chronic non-communicable diseases throughout telephone survey; 95%CI – Confidence Interval of 95%
*Percentual ajustado para representar a população adulta total segundo o Censo Demográfico de 2000 e para levar em conta o peso populacional de cada cidade;
**mais de cinco (homens) ou mais de quatro (mulheres) doses em pelo menos uma ocasião nos últimos 30 dias; VIGITEL – Vigilância de fatores de risco e proteção
para doenças crônicas não transmissíveis por inquérito telefônico; IC 95% – Intervalo de Confiança de 95%
Sociodemographic characteristics
MEN WOMEN
CRUDE ADJUSTED CRUDE ADJUSTED
PR 95%CI PR 95%CI PR 95%CI PR 95%CI
Age (years)
18 to 24 1 1 1 1
25 to 34 1.16 0.99 1.36 1.20 1.02 1.42 1.12 0.89 1.42 1.29 1.01 1.64 35 to 44 1.01 0.85 1.19 1.08 0.91 1.30 0.87 0.69 1.10 1.07 0.83 1.38 45 to 54 0.78 0.65 0.93 0.87 0.72 1.05 0.58 0.45 0.75 0.72 0.55 0.95 55 to 64 0.52 0.40 0.66 0.61 0.47 0.78 0.21 0.15 0.30 0.28 0.19 0.41 65 or more 0.18 0.13 0.24 0.23 0.16 0.32 0.09 0.05 0.15 0.12 0.07 0.20
p-value <0.001 <0.001 <0.001 <0.001
Skin color
Non-white 1 1 1 1
White 1.04 0.93 1.16 1.09 0.98 1.22 0.74 0.63 0.87 0.81 0.69 0.95
p-value 0.503 0.120 <0.001 0.010
Schooling (years)
0-4 1 1 1 1
5-8 1.34 1.12 1.61 1.07 0.89 1.28 1.91 1.41 2.58 1.30 0.96 1.76 9-11 1.30 1.11 1.52 0.99 0.84 1.16 1.87 1.43 2.45 1.09 0.82 1.45 12 or more 1.35 1.14 1.59 1.04 0.88 1.24 1.76 1.32 2.34 1.05 0.78 1.42
p-value 0.003 0.908 <0.001 0.095
Stable union
yes 1 1 1 1
no 0.75 0.68 0.84 0.83 0.74 0.93 0.55 0.47 0.65 0.54 0.45 0.65
p-value <0.001 0.001 <0.001 <0.001
Insertion in the job market
No 1 1 1 1
Yes 1.68 1.45 1.95 1.34 1.15 1.57 1.88 1.57 2.25 1.37 1.15 1.64
Usual Men
0 10 20 30
%
40 50 60
2006 2007 2008 2009
Men Women
p=0.173
p=0.747 p<0.001
p=0,.011
Women
Abusive
40% of the usual consumers. his number is lower than that obtained in the irst national survey on alcohol consumption patterns, which identiied 28% of the adult population as heavy drinkers12, such
diference may be explained by the period of analysis, of 12 months, while our study was conducted in 30 days. he frequency of usual consumption in Brazil is approxi-mately 31% lower than in the United States, and the one related to abusive consumption is similar, using the same cuts and telephone interviews. Data from the United States2 concerning the year
2006 showed that 55.2% of the population was related to usual consumption, and 15.4% to abusive consumption, also showing that 4.9% of the total population were considered as heavy drinkers. hese numbers show that the frequencies of usual consumption remained the same (53.2% in 1995 and 53.9% in 2009), the frequencies
Figure 1. Prevalence (%*) of habitual1alcoholic beverage consumption and alcohol abuse2 in men
and women (≥ 18 years of age) according to gender and year of survey. Brazil, VIGITEL – 2006 Figura 1. Prevalência (%)* de consumo habitual1 e abusivo2 de bebidas alcoólicas em homens e
mulheres (≥18 anos de idade) segundo sexo e ano do inquérito. Brasil, VIGITEL – 2006
*Percentage adjusted to represent the entire adult Brazilian population according to the Demographic Census of 2000 and to
take into account the population weight of each city; 1one or more doses in the last 30 days; 2more than five (men) or more
than four (women) doses at least one occasion in the last 30 days; VIGITEL – Brazilian surveillance of risk and protection factors for chronic non-communicable diseases throughout telephone survey; 95%CI – Confidence Interval of 95%
*Percentual ajustado para representar a população adulta total segundo o Censo Demográfico de 2000 e para levar em conta
o peso populacional de cada cidade; 1uma ou mais doses nos últimos 30 dias; 2mais de cinco (homens) ou mais de quatro (mulheres) doses em pelo menos uma ocasião nos últimos 30 dias; VIGITEL – Vigilância de fatores de risco e proteção para doenças crônicas não transmissíveis por inquérito telefônico; IC 95% – Intervalo de Confiança de 95%
of heavy consumption increased (2.9% in 2995 and 5.1% in 200), as well as the abusive consumption (14.1% in 1995 and 15.5% in 2009). his trend was also observed in Brazil in 2009, with 37.9% of usual consumption and 18.8% of abusive consumption11.
Only a few Brazilian population studies with adults about alcohol consumption patterns have been published, which limits the comparison of prevalent consumption patterns with this study, especially regarding the development of indicators. Most13-15 use
the test recommended by WHO to identify problems related to alcohol consumption (Alcohol use disorders identiication test – AUDIT) that analyzes not only the frequency of consumption and dose, but also the lack of control over consumption, lack of commitment, oblivion, regret, concern by other people and involvement with violence and accidents16. his test was validated in
Despite the diferent classiications related to consumption, other Brazilian studies conducted with adults showed higher frequencies of alcohol consumption for men than for women, like the state of São Paulo in 1999, with 2,411 people aged from 12 to 65 years13, Rio Grande (RS), in 2000, with 1,260
people aged 15 years or older14, Salvador
(BA), in 2001, that investigated 2,302 adults aged 25 years or more18, Campinas (SP) in
2003, that assessed 515 individuals aged 14 years or more15, and the irst national survey
performed with 2,346 adults in 2005 and 200612. he study conducted in Salvador18
showed that, after adjustments related to gender, age, marital status and social class, being a male and having a high socioeco-nomic level were factors associated with the high alcohol consumption (at least 8 doses a week, connected with drunkenness). In Rio Grande, the following character-istics were associated with higher alcohol consumption after the adjustment of all these variables plus age14: being a male,
having a low socioeconomic level, smoking and presenting with some psychiatric disorder (anxiety/depression). However, the study from Campinas showed that gender was no longer signiicant after the adjustment for other variables, associating the following factors with higher alcohol consumption: young age, high income, low schooling, non-evangelical religion and use of illicit drugs15. he data related
to higher consumption rates among men are in accordance with the international literature19-21. Some characteristics that are
speciic to each location may explain these diferences, besides the diference of time between studies: Salvador has a coast, and Rio Grande has a broad rural area, which may justify the higher consumption among men, unlike Campinas, that has a lot of students due to its university.
As to age, alcohol consumption among adolescents is prevalent, especially abusive consumption, which is a concern and is similar to the indings in Campinas15, in
Brazilian surveys regarding drug use22,23
and the irst national survey12; this was
considered as a risk group for violent deaths, traic accidents, involvement in ights and use of illicit drugs. he analysis of data concerning more than 65,000 individuals aged 20 years or more in relation to the study of victims of accidents and violence in 2006 and 200724 shows that the report
of previous intake of alcohol was signii-cantly higher (p<0.001) among individuals younger than 40 years old (17.6%) than among those aged 40 years or more (12.0%). his situation is similar to that observed in 1998 and 1999 by Gazal-Carvalho et al.25
in the city of São Paulo. In Russia, a case-control study involving almost 50,000 deaths showed a risk approximately 6 times higher of deaths by accidents and violence in the group that presented high alcohol consumption, besides the risk for other diseases, especially chronic26.
Our data pointed to a higher prevalence of abusive alcohol consumption among young adults who are not in a stable union and those who work, especially men. hese indings are important to plan prevention campaigns directed to these population strata against the excessive alcohol consumption. In 2000, the equivalent to 4% of the world morbidity and mortality were related to alcohol consumption27; in
2002, this factor was responsible for 3.7% of global mortality and for 4.4% of disease load5, showing a clear increasing trend.
Another limiting factor in this study refers to the self-reported alcohol consumption, which may have been underestimated especially in relation to high doses, since there are social restrictions to this behavior. Finally, interviewing the residents of households with a landline telephone line excluded a signiicant part of the Brazilian population who do not have access to this service, especially in the North and Northeast regions, in which telephone coverage is low. his is partially adjusted by the post-stratiication weight, just as performed in Canada on a survey regarding this subject28, for example.
he increased abusive alcohol consumption in the country in the analyzed period may be justiied by the Brazilian culture, which socially accepts drinking. However, the limit dose for harmful consumption is not clear, especially among the young population. Also, the acceptance of excessive consumption is associated with the characteristics of the communities where the individual is inserted29, which
reinforces the need for directed actions,
besides the direct involvement of profes-sionals and managers of primary attention to health30 and public policies31.
Governmental strategies to control excessive alcohol consumption have been successfully established. One example is the law nº 11,705, established in 2008, which reduces the permissible limit of alcohol to zero, increases the penalty and criminalizes the person who drives with 0.6 dcg or more of alcohol per liter of blood32. As a result of
the publication of the law and the adhesion of the population, rates of people who drive after the abusive ingestion of alcohol have decreased33. he lack of inspection in relation
to restriction to alcohol and advertisement, according to law nº 9,294/1996, has enabled the advertisement of alcohol connected with the promotion of national sports events. Although there is a quiet campaign for not driving after drinking, it does not focus on age limits and amounts that are harmful to health, for example. More structured public policies, like the ones related to smoking, are necessary and urgent to control the excessive alcohol consumption.
References
1. WHO. World Health Organization. International guide for monitoring alcohol consumption and related harm. Geneva: WHO; 2000.
2. Behavioral Risk Factor Surveillance System. Prevalence and Trends Data. All States 2009. [cited 2010 Dez 02]. Available from: http://apps.nccd.cdc.gov/BRFSS/page.asp?cat=AC&yr =2009&state=All#AC.
3. Behavioral Risk Factor Surveillance System. Prevalence and Trends Data. All States 1995. [cited 2010 Dez 02]. Available from: http://apps.nccd.cdc.gov/BRFSS/page.asp?cat=AC&yr =1995&state=All#AC.
4. NIAAA. National Institute of Alcohol Abuse and Alcoholism. NIAAA council approves deinition of binge drinking. Newsletter 2004; 3:3.
5. WHO. World Health Organization. Strategies to reduce the harmful use of alcohol. Geneva; 2008. [http://apps.who.int/ gb/ebwha/pdf_iles/A61/A61_13-en.pdf ].
6. WHO. World Health Organization. Drinking and Driving: a road safety manual for decision-makers and practitioners. Geneva: Global Road Safety Partnership; 2007.
7. Moura EC, Morais Neto OL, Malta DC, Moura L, Silva NN, Bernal R, Claro R, Monteiro CA. Vigilância de fatores de risco para doenças crônicas por inquérito telefônico nas capitais dos 26 estados brasileiros e no Distrito Federal (2006). Rev Bras Epidemiol 2008;11 Suppl 1:20-37.
8. Brasil. VIGITEL Brasil 2006: vigilância de fatores de risco e proteção para doenças crônicas por inquérito telefônico. Brasília: Ministério da Saúde, 2007.
9. Brasil. VIGITEL Brasil 2007: vigilância de fatores de risco e proteção para doenças crônicas por inquérito telefônico. Brasília: Ministério da Saúde,2008.
10. Brasil. VIGITEL Brasil 2008: vigilância de fatores de risco e proteção para doenças crônicas por inquérito telefônico. Brasília: Ministério da Saúde,2009.
11. Brasil. VIGITEL Brasil 2009: vigilância de fatores de risco e proteção para doenças crônicas por inquérito telefônico. Brasília: Ministério da Saúde,2010.
13. Galduróz JC, Noto AR, Nappo SA, Carlini EL. First household survey on drug abuse in São Paulo, Brazil, 1999: principal indings. São Paulo Med J. 2003;121(6):231-7.
14. Mendoza-Sassi RA, Béria JU. Prevalence of alcohol use disorders and associated factors: a population based study using AUDIT in southern Brazil. Addiction. 2003;98:(6)799-804.
15. Barros MBA, Botega NJ, Dalgalarrondo P, Marín-León L, Oliveira HB. Prevalence of alcohol abuse and associated factors in a population-based study. Rev Saúde Pública. 2007;41(4):502-9.
16. Babor TF, Fuente JR, Saunders J, Grant M. AUDIT - he alcohol use disorders identiication test: guidelines for use in primary health care. World Health Organization/ PAHO–92; 4:1-29.
17. Lima CT, Freire AC, Silva AP, Teixeira RM, Farrell M, Prince M. Concurrent and construct validity of the audit in an urban Brazilian sample. Alcohol Alcohol. 2005; 40;(6)584-9.
18. Almeida-Filho N, Lessa I, Magalhães L, Araújo MJ, Aquino E, Kawachi I, et al. Alcohol drinking patterns by gender, ethnicity, and social class in Bahia, Brazil. Rev Saúde Pública 2004; 38(1):45-54.
19. National Institute on Alcohol Abuse and Alcoholism. Percentage of adults who reported binge drinking by state and gender, BRFSS, 1984–2008. [cited 2010 Dez 02]. Available from: http://www.niaaa.nih.gov/RESOURCES/ DATABASERESOURCES/QUICKFACTS/ADULTS/Pages/ brfss03.aspx.
20. Jhingan HP, Shyangwa P, Sharma A, Prasad KM, Khandelwal SK. Prevalence of alcohol dependence in a town in Nepal as assessed by the CAGE questionnaire. Addiction 2003; 98(3):339-43.
21. Malyutina S, Bobak M, Kurilovitch D, Nikitin Y, Marmot M. Trends in alcohol intake by education and marital status in urban population in Russia between the mid 1980s and the mid 1990s. Alcohol Alcohol. 2004;39(1):64-9.
22. Carlini EA, Galduróz JCF, Noto AR, Nappo AS. I Levantamento Domiciliar sobre o uso de Drogas Psicotrópicas no Brasil 2001. São Paulo: CEBRID, 2002.
23. Carlini EA; Galduróz JC; Noto AR; Carlini CM; Oliveira, LG; Nappo, SA; Moura YG; Sanchez, ZVDM. II Levantamento Domiciliar sobre o uso de Drogas Psicotrópicas no Brasil 2005. São Paulo: CEBRID, 2006.
24. Mascarenhas MDM; Malta DC; Silva MMA; Gazal-Carvalho C; Monteiro RA; Morais Neto, OL. Consumo de álcool entre vítimas de acidentes e violências atendidas em serviços de emergência no Brasil, 2006 e 2007. Ciênc Saúde Coletiva 2009;14(5):1789-96.
25. Gazal-Carvalho C, Carlini-Cotrim B, Silva OA, Sauaia N. Prevalência de alcoolemia em vítimas de causas externas admitidas em centro urbano de atenção ao trauma. Rev. Saúde Pública 2002; 36(1):47-54.
26. Zaridze D, Brennan P, Boreham J, Boroda A, Karpov R, Lazarev A, et al. Alcohol and cause-speciic mortality in Russia: a retrospective case-control study of 48,557 adult deaths. Lancet 2009; 373(9682):2201-14.
27. Meloni JN, Laranjeira R. Custo social e de saúde do consumo do álcool. Rev Bras Psiquiatr 2004; 26 Suppl 1:S7-10.
28. Zaho J, Stockwell T, Macdonald S. Non-response bias in alcohol and drug population surveys. Drug Alcohol Rev 2009;28(6):648-57.
29. Ahern J, Galea S, Hubbard A, Midanik L, Syme SL. “Culture of drinking” and individual problems with alcohol use. Am J Epidemiol 2008; 167(9):1041-9.
30. Ronzani TM, Mota DCB, Souza ICW. Prevenção do uso de álcool na atenção primária em municípios do estado de Minas Gerais. Rev Saúde Pública 2009;43 Suppl 1:51-61.
31. WHO. World Health Organization. Global strategy to reduce the harmful use of alcohol. Geneva: Global Road Safety Partnership; 2010.
32. Brasil. Lei nº 11.705, de 19 de junho de 2008. Altera a Lei nº 9.503, de 23 de setembro de 1997, que institui o Código de Trânsito Brasileiro, e a Lei nº 9.294, de 15 de julho de 1996, que dispõe sobre as restrições ao uso e à propaganda de produtos fumígeros, bebidas alcoólicas, medicamentos, terapias e defensivos agrícolas, nos termos do § 4º do art. 220 da Constituição Federal, para inibir o consumo de bebida alcoólica por condutor de veículo automotor, e dá outras providências. Diario Oicial da União. 2008 Jun 20; Seção 1:1.
33. Moura EC, Malta DC, Morais Neto OL, Penna GO, Temporão JG. Direção de veículos motorizados após consumo abusivo de bebidas alcoólicas, Brasil, 2006 a 2009. Rev Saúde Pública 2009;43(5):891-4.
Submitted on: 05/01/2011 Final version presented on: 08/02/2011