Benchmarking: An International Journal
Fl exibl e benchmarking: a new ref erence modelMarcos Ronaldo Albertin Heraclito Lopes Jaguaribe Pontes Enio Rabelo Frota Matheus Barros Assunção
Article information:
To cite this document:Marcos Ronaldo Albertin Heraclito Lopes Jaguaribe Pontes Enio Rabelo Frota Matheus Barros Assunção , (2015),"Flexible benchmarking: a new reference model", Benchmarking: An International Journal, Vol. 22 Iss 5 pp. 920 - 944
Permanent l ink t o t his document :
http://dx.doi.org/10.1108/BIJ-05-2013-0054
Downl oaded on: 03 August 2015, At : 09: 32 (PT)
Ref erences: t his document cont ains ref erences t o 24 ot her document s. To copy t his document : permissions@emeral dinsight . com
The f ul l t ext of t his document has been downl oaded 65 t imes since 2015*
Users who downloaded this article also downloaded:
Hepu Deng, (2015),"Multicriteria analysis for benchmarking sustainability development", Benchmarking: An International Journal, Vol. 22 Iss 5 pp. 791-807 http://dx.doi.org/10.1108/ BIJ-07-2013-0072
Hokey Min, Hyesung Min, (2015),"Benchmarking the service quality of airlines in the United States: an exploratory analysis", Benchmarking: An International Journal, Vol. 22 Iss 5 pp. 734-751 http:// dx.doi.org/10.1108/BIJ-03-2013-0029
Rameshwar Dubey, Sadia Samar Ali, (2015),"Exploring antecedents of extended supply chain performance measures: An insight from Indian green manufacturing practices", Benchmarking: An International Journal, Vol. 22 Iss 5 pp. 752-772 http://dx.doi.org/10.1108/BIJ-04-2013-0040
Access t o t his document was grant ed t hrough an Emeral d subscript ion provided by emeral d-srm: 327477 [ ]
For Authors
If you woul d l ike t o writ e f or t his, or any ot her Emeral d publ icat ion, t hen pl ease use our Emeral d f or Aut hors service inf ormat ion about how t o choose which publ icat ion t o writ e f or and submission guidel ines are avail abl e f or al l . Pl ease visit www. emeral dinsight . com/ aut hors f or more inf ormat ion.
About Emerald www.emeraldinsight.com
Emeral d is a gl obal publ isher l inking research and pract ice t o t he benef it of societ y. The company manages a port f ol io of more t han 290 j ournal s and over 2, 350 books and book series vol umes, as wel l as providing an ext ensive range of onl ine product s and addit ional cust omer resources and services.
Emerald is both COUNTER 4 and TRANSFER compliant. The organization is a partner of the Committee on Publication Ethics (COPE) and also works with Portico and the LOCKSS initiative for digital archive preservation.
*Rel at ed cont ent and downl oad inf ormat ion correct at t ime of downl oad.
Flexible benchmarking: a new
reference model
Marcos Ronaldo Albertin, Heraclito Lopes Jaguaribe Pontes,
Enio Rabelo Frota and Matheus Barros Assunção
Department of Industrial Engineering, Federal University of Ceará,
Fortaleza, Brazil
Abstract
Purpose–The purpose of this paper is to describe and propose a new way to do benchmarking. It describes an explanatory case study whereby data are collected through an internet benchmarking system with multi-criteria performance.
Design/methodology/approach–The research methodology was to conduct a literature review on international journals about evolution, typology and trends of benchmarking. Through a third year case study of Internet Benchmarking and Monitoring System of Productive Arrangements System the authors describe and propose a flexible benchmarking model.
Findings – The paper provides empirical insights about a new model of flexible benchmarking taking into account different demands, whereby partners’data are collected and processed according to their needs.
Research limitations/implications–For monitoring and trending analysis more data and time is needed. These three-year applications show that it takes a long time to build a database that can be meaningful for benchmarking and monitoring purposes management. It also requires management maturity, performance system and finally procedures to invite companies to collect and input online data.
Practical implications–The paper describes a flexible benchmarking, detailing its features in the form of a case study. The gap analysis shows the individual and collective gaps and requirements. Examples of practical use and reports generated“online”are presented.
Originality/value– The paper presents a new potential for the use of benchmarking tools. It is expected to contribute to the academic area, describing ways to achieve greater potential in the use of benchmarking tools, proposing a new way to do benchmarking.
KeywordsMonitoring, Model, Flexible benchmarking, Productive arrangement Paper typeCase study
1. Introduction
In recent decades, globalization has highlighted the inability of companies to aggregate all the skills necessary for their survival. As a result, corporate interrelationships are not only seen as trade relations but opportunities to add value and complementarities. Thus, there is a rapid growth in relationships as collaborative networks, supply chains, clusters, industrial agglomerations, among others studied with intensity in academic literature (Lehtinen and Ahola, 2010) and referred to in this work of productive arrangements (PAs).
Johnson (2008) notes that benchmarking surveys have been made with a focus on intra-relationships, instead of business interrelationships and business networks. Simatupang (2001) states that there is a positive correlation between collaboration and performance ratios and encourages collaborative efforts among the participants in a supply chain to improve its operating results.
Huang and Wang define benchmarking as a reference point where they can perform measurements and comparisons of every kind and nature. Benchmarking can be a tool to ensure that participating members are continually improving, in Benchmarking: An International
Journal Vol. 22 No. 5, 2015 pp. 920-944
© Emerald Group Publishing Limited 1463-5771
DOI 10.1108/BIJ-05-2013-0054 Received 9 May 2013 Revised 31 October 2013 Accepted 3 December 2013
The current issue and full text archive of this journal is available on Emerald Insight at:
www.emeraldinsight.com/1463-5771.htm
920
BIJ
22,5
other words implementing best practices. This tool stimulates mutual learning and bringing benefits to its participants.
Wong (2008) notes a new trend of research on benchmarking, from intra-relationships toward interrelationships with a holistic approach. In this case, a strategic and collaborative relationship among participants is necessary so that benchmarking activities can succeed and achieve meaningful results.
Routledge (2001) adds that it is likely that the success of benchmarking in recent years is due to the fact that it is a motivational process which happens in an environment that allows the exchange of knowledge. According to the same author, benchmarking helps to improve several business activities, such as learning and managerial processes.
Bogetoft and Nielsen (2005) states that the current potential of this tool has not been fully explored and it may be more useful if it is more flexible. There are restrictions on the use of the tool and accessibility to results that users often do not accept or would like to change, depending on each company’s goals and due dates. The author concludes that flexibility both in the actual benchmarking process and in its reports should be relevant to the design of any benchmarking.
It is observed that benchmarking can evolve further, becoming a more dynamic tool, becoming more comprehensive and more flexible, which will potentially provide better results for its users.
This paper describes the methodology of a computerized large scale benchmarking tool that innovates by its flexibility and by its approach on inter-organizational relationships. It discusses the use of information and communication technology (ICT) to facilitate the flexible collection, data processing and distribution of reports and results of benchmarking.
The objective is to describe a new type of flexible benchmarking, detailing its features in the form of a case study of a Internet Benchmarking and Monitoring System of Productive Arrangements (SIMAP), which in its third year of use has more than 300 registered companies. Through this analysis, is expected to contribute to the academic area, describing ways to achieve greater potential in the use of benchmarking tools, proposing a new generation of this tool.
The research methodology was to conduct a literature review on international journals about evolution, typology and trend of benchmarking. Keywords such as “flexibility” and “benchmarking” were researched in different scientific research portals like“Science Direct”and“Web of Science.”Priority was given to articles related proposition models, typologies and trends in benchmarking.
This paper is structured in five sections, including this introduction. The second section presents a framework on the evolution of benchmarking considering its application in collaborative systems, and the third describes the benchmarking tool SIMAP, emphasizing its flexibility in the classic steps of a benchmarking process. The fourth section presents the characteristics and features that suggest flexible benchmarking. Finally, the conclusions of this work are discussed.
2. Development of benchmarking
Comparisons occur among products, processes and business functions. The types of benchmarking can be defined by“what to benchmarking”and whom to benchmarking against”(Bhutta and Huq, 1999). With the evolution of benchmarking supported by ICT, it is proposed to complement and extend the previous statement both in the scope of comparison (what) as well as the application (whom) increasing flexibility in the use
921
Flexible
benchmarking
of a benchmarking tool. First, we emphasize the importance of benchmarking as a collaborative tool, followed by its evolution.
2.1 Collaborative benchmarking and existing methods
The collaboration in the supply chain enables companies to achieve better performance, but requires efforts from all the members. They seek new ideas and best practices through benchmarking (Simatupang, 2001). The process of comparing best practices among companies provides insights for a company to improve its performance, stimulating and motivating the learning in the process of improvement (Simatupang, 2001).
Benchmarking has been used to exchange experiences and information among companies of different organizational nature. In research conducted by Johnson (2008), using benchmarking on 150 companies, it is concluded that the effective exchange of information improves learning in the supply chain.
Clusters are comprised by businesses and organizations interrelated and geographically close to each other that are connected by their similarities and complementarities. However, the advantage of the external economy depends on relationships more than the spatial approximation (Porter, 1998). Carbonaraet al.(2002) describes industrial districts as small and medium enterprises located geographically close, specializing in one or more phases of a process that is integrated into a complex network of interrelationships. The most important factor of the success of this production model is the process of corporate network. The same author has identified different supply chain networks involved in different value adding processes in the industrial districts.
Industrial clusters such as industrial districts and local clusters have the concept of geographic concentration and intensive inter-organizational relationships. This idea leads agencies of public and private development to create and implement policies to increase competitiveness and support regional development. In this case, benchmarking can support the decision process of policy implementation through a collective process of gathering and processing data with territorial approach. This approach, regarding SIMAP, is tied to the methodology described in Section 3.
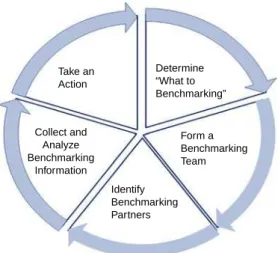
Bhutta and Huq (1999) note that there are several methods of benchmarking in the literature, whereby cases of companies using from four to 33 steps can be found. Camp (1989) and, later on, Bhutta and Huq (1999) used the method of PDCA (Plan, Do, Control, Act) to characterize the main stages of this process, such as: Plan: planning of the goal and type of benchmarking; Do: gathering and processing of data; Check: comparisons and gap analysis; Act: actions for improvement. Bhutta and Huq (1999) analyzed several cases and identified its five basic components in the form of a wheel (Figure 1) as: plan the study; form the benchmarking team; identify partners; collect and analyze information and adapt and improve.
2.2 Evolution and types of benchmarking
The performance evaluation and comparison of internal operations of a company with the best practices of other became popular since the 1980s, when significant performance improvements of products were obtained by Hewlett-Packard and Xerox through benchmarking studies (Camp, 1989). The methodology for comparing features and functions of a product with the competitors has been used to enhance its performance. First, however, benchmarking had been used informally, as is the classic
922
BIJ
22,5
case of the“principle of the supermarket”observed by Taichi Ohno, in 1958, in the USA, and built on the just in time system of the Japanese automotive industry (Ahmed and Rafiq, 1998 ). Since then, many types of benchmarking were identified by several authors, such as Camp (1989), Watson (1993) and Ahmed and Rafiq (1998).
The interest for benchmarking remains today with more challenging and innovative developments aided by ICT. Table I describes the main types of benchmarking found in the research. The types are found in consensus in the literature but differ classification criteria. It is noted that the comparisons have evolved, thus making the benchmarking object wider (what) and with larger scope (whom). The scope ranges from an internal business to external and global (e.g. economic blocks). The scope ranges from process, product, procedures, technologies, practices, competitors, among other possible.
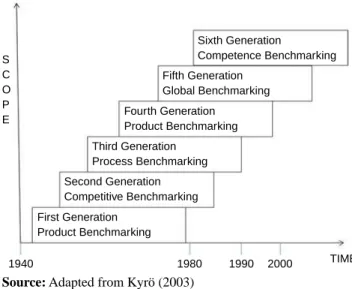
The types of benchmarking follow a trend characterizing new generations formulated and are also found in consensus in the literature. Watson (1993) and Ahmed and Rafiq (1998) identified the development of benchmarking in five generations that were complemented by Kyrö (2003), highlighting the benchmarking of competence (bench learning) and networks, as shown in Figure 2. A new generation does not eliminate or replace the previous one, but complements the range or variety of possible combinations of the tool.
The first generation “reverse engineering” has the focus on the features and functionality of competing products. The second generation compares the performance of competing companies, identifying the best practice. The third generation (1982-1988) “process” has an even more comprehensive, focussing on process and systems knowledge and also outside the industry (Ahmed and Rafiq, 1998). The fourth generation (1990) sought the learning of successful strategies from external partners complemented by the fifth generation with global geographic coverage, enabling comparison and learning from competence (Ahmed and Rafiq, 1998). The sixth generation of benchmarking proposes changes in the ability to face new challenges. The ability to learn with others and develop skills to implement the continuous learning process. Learn in a broader geographic scope may include business units, clusters, networks and economic blocks. The goal always is to compare with the best and learn from them.
Identify Benchmarking Partners
Form a Benchmarking Team Determine “What to Benchmarking”
Collect and Analyze Benchmarking
Information Take an Action
Source: Bhutta and Huq (1999)
Figure 1. The SIMAP benchmarking wheel
923
Flexible
benchmarking
Analyzing the generation and evolution of benchmarking, Kyrö (2003) proposes a new and more complete definition:
Benchmarking refers to evaluating and improving an organisation’s, its units’or a network’s performance, technology, process, competence and/or strategy with chosen geographical scope by learning from or/and with its own unit, other organisation or a network that is Classification
criteria Types Object of comparison References
Method Informal
Formal can be Best practices Performance
Unstructured
Systematic and conscious Tools Performance level GBN (2010) Partner Internal Competitive Functional General sector
Departments and internal units Best competitor
Technologies/processes in industry and other organizations
Different sectors and companies Same sectors
Huang and Wang Kyrö (2003)
General Internal and external Competitive Strategic
Product or reverse engineering General process Performance strategic
Intra- and interorganizational With the best activity or company Strategies and outcomes
Characteristics and performance of products
Different sectors and companies Processes and methods Indicators and indices Types of strategies
GBN (2010) Andersen and Pettersen (1994) Ahmed and Rafiq (1998)
Bhutta and Huq (1999)
Activity Process Competitive General
Business processes Practices and performances Practices and performances
Andersen and Pettersen (1994)
Activity Functional Functions and departments of several companies and sectors
Andersen and Pettersen (1994) Geographic
scope
Local, regional or national
International and global (economics block)
Performance, Technology, Processes, Competence and Strategies
Kyrö (2003)
Sector public or private
Private Public Public-private
Best service competitor Best possible service Both Kyrö (2003) Organizational structure Unit Organization network
Units and departments companies
Collaborative networks
Kyrö (2003)
Intra- and Inter-relationship Individual Collaborative Cooperative Business performance Collective performance Sharing experiences Simatupang (2001) Intelligence Natural Artificial Uni-and bidimensional Dynamic and multidimensional (DEA) and decision support
Laiet al.
Flexibility Rigid Flexible
Predefined comparisons
Simulations, comparisons and reports defined by multiple users
Proposed in this paper Source:Authors Table I. Benchmarking types
924
BIJ
22,5
identified as having best practices in its respective field as a competitor, as operating in the same industry, cluster or sector or in the larger context with chosen geographical scope (p. 222).
Lai et al. proposes a benchmarking supported by knowledge systems and artificial intelligence. This online data processing is performed by computational tools that support decision making, as an example, using the tool of data envelopment analysis (DEA). This tool uses the approach of linear processing and allows flexible use, comparing measures of output and input multicriteria and various scales. Thus, the benchmark tool becomes more versatile, and can be applied in various ways to meet the requirements of the improvement process for a greater number of organizations and challenges.
The last classification in Table I “flexibility” features a new reference type of benchmarking proposed by the authors in this paper, featuring a new way to use this tool. The“flexible benchmarking”is described in the next section through a case study exemplifying its features.
3. Benchmarking flexibility: the SIMAP case
In this section the characteristics that allow new comparisons and benchmarking typification are presented and exemplified.
3.1 SIMAP: context and application
The SIMAP computer system was designed for the purpose of diagnosing the following problem in Ceara (State of Brasil located in Northeast):“Why the supply from Ceara’s companies to the leading company Lubnor-Petrobras, in Ceara, was only 6.4% in 2006?”. In order to develop a possible dynamic and always current response, the local PA of oil and gas was mapped and the first phase of the system was developed. Through the online registration, any company can participate and analyze its performance compared with the average of the other, checking what are their performance gaps, i.e. requirements not met to supply the leading company.
1940 1980 1990 2000 TIME
S C O P E
Sixth Generation
Competence Benchmarking Fifth Generation
Global Benchmarking Fourth Generation
Product Benchmarking Third Generation
Process Benchmarking
First Generation Product Benchmarking
Second Generation Competitive Benchmarking
Source: Adapted from Kyrö (2003)
Figure 2. Benchmarking generations
925
Flexible
benchmarking
To meet other projects’ demand, the system was expanded by consolidating the development method represented by the adapted benchmarking wheel. The wheel, as seen previously, has been used in order to synthesize many kinds of benchmarking process. Figure 3 shows the model proposed by the SIMAP. The process starts with a (new) demand “what to compare,” identifying goals, potential partners, type of benchmarking and flexibility (i.e. ability to respond to changing demand) necessary for the common use of benchmarking studies.
In the second stage a team that will drive and support the benchmarking process is formed. It determines the performance indicators and its metrics (criteria), programs the internet tool for collecting and processing data on the web and provides the system for their partners. They participate in collecting data electronically and conduct their studies and simulations from the data entered and information processed by themselves. By means of the reports available, individual or collective actions for improvement can be proposed.
Demand is always related to a PA and starts with the mapping, which consists in identifying the activities or process (links) and the interrelationships among existing companies considering the agents of a PA, both processing (primary) and the support (secondary). The method can be suitably modified to accommodate any number of criteria, links given the structure of the PA as industrial agglomerations, industrial network and clusters.
The support companies is always considered because it often represents the innovative solution to the competitiveness of the processing chain (Albertin, 2003). Its importance on regional development is highlighted in concepts of the Triple Helix (Etzkowitz and Zhou, 2006; Johnson, 2008), clusters (Porter, 1998) and Systemic Competitiveness (Messner, 1996; Altenburget al., 1998).
The approach used to perform the mapping of a PA consists of: literature review, preliminary visits to companies of the sector, discussions with representation entities and consulting experts. The information obtained generates an initial version of the mapping of the PA, which must be validated by experts or businessmen. With this validation, this new PA must be registered in the system.
(New) Demand Goals Fexibility PA and Partners
Studies Improvements
Partners Collect Process Analyze Data
Form a Team Internet Programmes and Tools Identify
Partners and PA
Figure 3. The SIMAP methodologies
926
BIJ
22,5
It is observed that the inclusion of data in SIMAP occurs with the indication of the location, which can be territorial state, region or country, as represented in the axis “territory”in Figure 4. This figure illustrates the possible comparisons in SIMAP. The axis“activities”provides the benchmarking by activity (link) of a company compared to other links of the same or different PA. It is possible, for example, for a machining company to compare itself with the average performance of other states and countries, and with its direct competitors in the same PA (territory) or in the same country. It is possible to draw a value chain, a supply chain, cluster, or other types of PAs, and make restricted or unrestricted access comparisons.
The SIMAP does not make a distinction between leading and lagging regions in Brazil but makes the observation that while economic growth in regions is unbalanced, development can be inclusive. The flexible report makes comparisons between spatial areas as federal states. Therefore, increasing local interactions and reducing distances within a country and globally contributes to these virtuous circles and development.
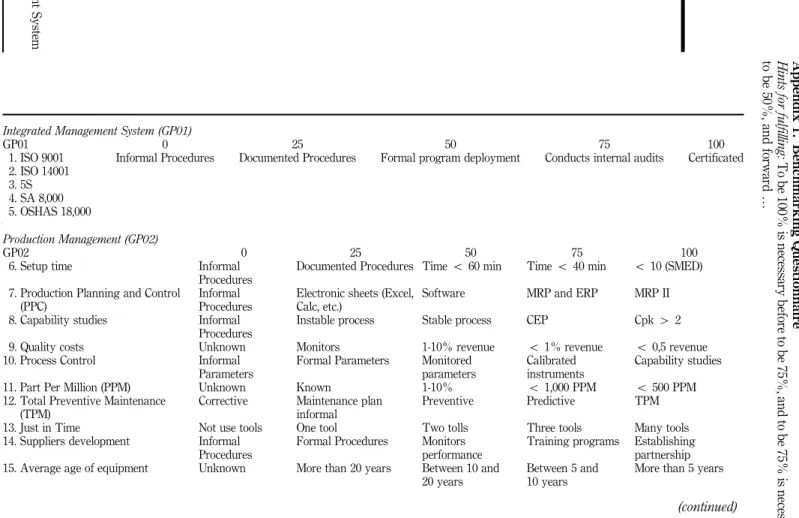
The 46 criteria (C1, C2,…, C46), shown in Figure 4 were grouped by similarity on seven subsystems, as described in the Appendix. Each criteria has a growing performance metric adapted from Likert scale of five levels (0,25,50,75,100), featuring categorized qualitative data. These criteria represent performance and best practices. There is the possibility of“not applicable”when the same cannot be implemented in a particular company. The criteria and performance levels derive from the requirements established in the Malcom Bridge Award, as well as in the Toyota Production System, ISO/TS 16949 and ISO 9001.
3.2 ICT and database
The SIMAP programming is done using free software with flexible tools that allow adjustments on demand. This makes the system more attractive, since different PA and customization can be defined and entered into the system. We adopted the open source tool LimeSurvey whose goal is the creation and management of online surveys with the following features: multilanguage, user management, creation of tokens, initial
Territory Productive arrangements (PAs) or
Activities (links)
Criteria (C1-C46)
Process or activity Comparisons
Local Regional
All companies or national companies
C1 C2 C3 C4 C5 C6....C46
PAs (cluster, supply chain, network, etc.)
Values (bar) and Average Performance
RequirementsGAPs
Source: Authors
Figure 4. Possible comparisons on SIMAP
927
Flexible
benchmarking
statistical analysis through easily export reports (LimeSurvey, 2009). The LimeSurvey is organized by questionnaires, focus groups, questions and answers. Within each of the levels and sublevels of administration, the following features are available (LimeSurvey, 2009):
(1) permission control, technical data visualization, database backup, labels management for questions and administration of questionnaires models; (2) general data editing, completed questionnaire testing, generating printable
version, excluding the questionnaire, excluding rules for the questionnaire, results exporting, changing the display order of the groups, managing the responses from each questionnaire, and managing access tokens to the questionnaire;
(3) change the order in which the questions appear within the group, removing a group, and change the basic data of a group; and
(4) edition of basic information about the question, removing question, duplicating an existing question, creating rules for the question, test the question.
The information collected in the on line survey is stored in a database, which is a structured collection of records allowing further consultations and reports. The Database System Manager (DBMS) is responsible for storing and querying data stored using it for a relational structure, where tables have links to each other. The DBMS used was MySQL (free software available under the GPL license). There is a specific table in this database where all survey responses are stored and centralized, facilitating recovery and data analysis. The other LimeSurvey table applications serve as the management resource of tokens, users, profiles, themes, graphics, besides the more specific attributes of each: group question and answer.
The information captured by the system must meet the relationship between the entities as described in Figure 5, which states that: the activities (links) are associated directly to PA, and the criteria directly linked to the associated subsystems management. Other deductions from this figure are: one PA has many links, one link can only be in one PA, one subsystem has many criteria, one criteria can only belong to a subsystem, one criteria or one link has many performance information (since there are several companies and several criteria) and one company has many performance information (since there are various links and various criteria).
The storage of information in the database the way it was modeled ensures that the system is resilient to events such as the creation or extinction of a PA, an activity, a subsystem or even a criterion. This flexibility gives survival to information already captured and the system administrator, or even the companies themselves, must update the records already made in the system, thus preventing the need for collecting any information again.
3.3 Flexibility of SIMAP
The SIMAP allows online benchmarking analysis indicating the need for improvements in the 46 performance criteria. This tool collects, processes and reports information in real time to any company in any benchmarking partner. The greater the number of registered companies the greater the possibilities of comparison and the more representative the database will be. The database can be continually updated by the companies, enabling individual and collective tracking of the PA.
928
BIJ
22,5
The freedom to access SIMAP through the internet allows the partner firm to perform the following comparisons and simulations:
• positioning the company relative to the average performance of competitors and
to the benchmarking company;
• performance of a company against the average of all companies in the same
activity in the same PA, in the same local or country;
• comparative acting against other activity, PAs or location;
• performance of a firm against the average of all listed companies;
• performance of the benchmarking company against the average of all companies
in the same activity, in the same AP, in the same state or country; and
• the gaps to supply a given focal (leading) company.
These information are highlighted in the form of four reports, using a graphics package called“Fusion Charts”of SIMAP. These are as follows.
(a) Bar and sequential reports
A company can analyse its performance against the average performance of others working in the same PA or in the same activity (link). On the proposed methodology, the company may register in more than one PA. The following information can be obtained online (Figure 6):
• individual performance in 46 criteria and their seven subsystems;
• average performance of companies registered in the same PA, or even in the
same activity or in the same state (territory);
• individual and collective gaps analyses;
• simulation of competitive positioning in other PAs, regions or countries; and
• visualization of competitive positioning after some actions.
It is observed in Figure 6 the performance of a company (bar chart) and the mean comparison of performance in the GP01 to GP07 subsystems (see the Appendix) of all registered companies on the local automotive supply chain in State of Ceara. Similar reports can be generated online by activities (links) or in others PAs.
PAs
Links
Performance
Criteria
Subsystem
Company n 1
n 1 n 1 n 1 n 1
Source: Authors
Figure 5. Entity diagram and relationship among system’s main entities
929
Flexible
benchmarking
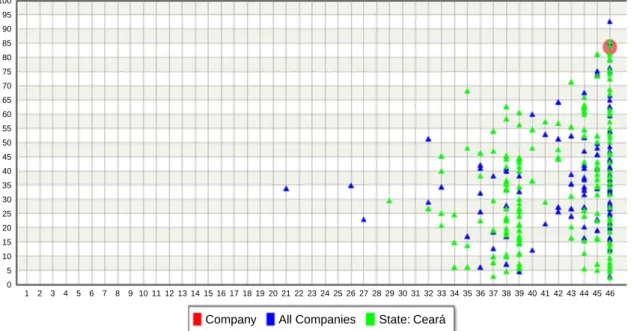
(b) DEA
This report processed“on line”allows to compare the performance of a company with other considering the PA, the territorial location or activity, as shown in Figure 7. On thexaxis is shown the number of criteria applicable (maximum 46) and on they
axis is shown their average performance (0-100 percent).
The application of DEA with categorized qualitative data presented good results with the following changes:
• the Likert scale (0-25-50-75-100 percent) was replaced by the scale (1-2-3-4-5);
and
• it was necessary to transform multidimensional inputs (criteria) in
one-dimensional for better identification of the benchmarking company.
The DEA report allows the same simulations just as the report of bars and sequential. In the case of the example company, this can be compared with competitors in three APs as automotive supply chains, oil and gas and refractories. In these chains, it is possible to compare to direct competitors (same activity or process) or to the company average of all companies registered in a state (territory) or to the average of all registered companies.
(c) Flexible report with“restricted access”
The third report has multiple parameters that can be used to create flexible statistical reports. To build these reports, the analyst chooses what statistics is wanted (i.e. demand or question that will be analyzed), and that filter will be used. The filters act as aggregators of logical types“AND”and“OR.”The first restricts the size of the sample, while those of type“OR”expand. Thus, by combining parameters, the analyst can perform other analyzes such as:
• comparisons between companies in different countries (or states), PAs or
activity’s;
• comparisons also considering the company size (small, medium and large);
and
• comparisons considering only international capital firms and many other.
GP01 GP02 GP03 GP04 GP05 GP06 GP07
Gaps Registered company
Average of registered companies in the same activity and local
Average of companies in the same PA and local
Focal company
requirement (e.g. OEM) P
E R O R M A N C E
0% 25% 50% 75% 100%
Figure 6. Individual performance (bars) and the average performance (line) of Ceara automotive supply chain
930
BIJ
22,5
Company
0
1 2 3 4 5 6 7 8 9 10 11 12 13 14 15 16 17 18 19 20 21 22 23 24 25 26 27 28 293031 32 33 34 35 36 37 38 394041 42 43 44 45 46 5
10 15 20 25 30 35 40 45 50 55 60 65 70 75 80 85 90 95 100
All Companies State: Ceará
Figure
7.
Applicatio
n
of
DEA
931
Flexible
benchmarking
Figure 8 shows in a simplified fashion the main information present on the flexible report. These are:
• the special information are made by the number of countries across the globe(P),
the number of regions of Brazil (R), and number of states (E);
• the organization’s information comprises the number of different classifications
of size of company (T), amount of existing capital (M) and the number of options of market segment (A);
• information on how many PAs were mapped (C) and how many activities exist in
each chaini(Ci).
• the performance according to the quantity of subsystems (S) and the number of
applicable criteria for each subsystemj(Sj).
The combination of information from mutually exclusive group (groups of elements with empty intersection) through aggregation “AND” brings to null results. For example, in“Spatial Information”on the same search, it makes no sense for a company to be located in Brazil“and”in China.
First, it is analyzed the total combinations of filters at the flexible report, named
TotS, when there is no aggregation (Equation (1)). In this case, the objective is to search for a single aspect individually:
TotS¼C1PþC1RþC1EþC1MþC1AþC1CþX
C
i¼1
C1Ci
þC1SþX
S
j¼1
C15Sj
(1)
To analyze the total filter combinations when there is aggregation of type “AND,” calledTotAND(Equation (6)), as discussed previously requires extra care when dealing with mutually exclusive sets. To better present this formula, it will be decomposed in terms of clusters of Figure 8: spatial information (Equation (2)), company information
Spatial Information
Countries (P )
Regions (R )
States (E )
Market Segment (A)
Existing Capital (M ) Company Size
(T )
Subsystems (S) PAs
(C )
Criteria (Sj) Links
(Ci) Company
Information
PAs Information
Criteria Information
Source: Authors
Figure 8. Combination of comparisons on SIMAP on flexible report for
administrative area
932
BIJ
22,5
(Equation (3)), PA information (Equation (4)) and criteria information (Equation (5)):
TotE1¼C1PþCR1þC1Eþ1 (2)
TotE2¼C1TþC1MþCA1þC1TC1AþC1MC1AþC1TC1MþCT1C1MC1Aþ1 (3)
TotE3¼X
c
i¼1
CiC
Y
c
i¼1
C1C
iþC 2
Ciþ ... þC
Ci Ci
(4)
TotE4¼Y
s
j¼1
C15S
jþC 2
5Sjþ ... þC
5Sj 5Sj
(5)
ToE¼ðTotE1TotE2Þ þðTotE1TotE3Þ þðTotE1TotE4Þ
þðTotE2TotE3Þ þðTotE2TotE4Þ þðTotE3TotE4Þ
þðTotE1TotE2TotE3Þ þðTotE1TotE2TotE4Þ
þðTotE1TotE4TotE3Þ þðTotE2TotE4TotE3Þ
þðTotE1TotE2TotE4TotE3Þ (6)
To analyze the total filter combinations when there is aggregation of type“OR,”called
TotOR, the number of possibilities increases even further because there is no elimination of mutually exclusive sets. To better present this formula, it will be decomposed in terms of clusters of D1 (Figure 9): countries (Equation (7)), states (Equation (8)), regions (Equation (9)), composition of capital (Equation (10)), size (Equation (11)), market segments (Equation (12)), PAs (Equation (13)), activities
Spatial Information
Countries (P )
Regions (R )
States (E )
Size (T )
Activities Links
(Ci) PAs (C ) Company
Information
PAs Information
Source: Authors
Figure 9. Possible comparisons on SIMAP using the flexible report open to companies
933
Flexible
benchmarking
(Equation (14)), subsystems (Equation (15)) and criteria (Equation (16)):
TotOR1¼X
P 1
k¼1
CkP (7)
TotOR2¼X
E 1
m¼1
CmE (8)
TotOR3¼X
R 1
o¼1
CoR (9)
TotOR4¼X
M 1
n¼1
CnM (10)
TotOR5¼X
T 1
l¼1
ClT (11)
TotOR6¼X
A 1
p¼1
CpA (12)
TotOR7¼X
C 1
q¼1
CqC (13)
TotOR8¼X
S 1
r¼1
CrS (14)
For each PAi, the quantity of activities in thisPA(Ci) generates the quantity of filters
described by Equation (15):
TotORC ¼ XC
i¼1 X Ci 1
k¼1
CkCi (15)
For each subsystem j, the quantity of criteria of this subsystem (Sj) generates the
quantity of filters described by Equation (16):
TotORS¼ XS
j¼1 X 5j 1
l¼1
Cl5Sj (16)
Observing the quantities obtained in Equations (7-16) as a set of elements of a setZ
(Equation (17)), each element ofZis known asZw, and |Z|¼8+C+S, it is possible to
934
BIJ
22,5
perform combinations among the different elements ofZ, generating a much larger number of filters calledTotOU(Equation (18)):
z¼fTotOU1; TotOU2; TotOU3; TotOU4; TotOU5; TotOU6; TotOU7;
TotOU8; TotOU _C; TotOU _Sg (17)
TotOU¼X
Z j j
w¼2
Cwj jZ (18)
Given the current scenario of the SIMAP system, with the possibility of tracking 195 countries, five regions, 27 states, three possible sizes of companies, two types of composition of capital, three classes of markets, 16 supply chains, 323 distributed links in these chains, seven subsystems with 230 and levels of impact on these subsystems’ criteria; it gives a very large number of filters. To simplify the dimensioning of the number of possible combinations from the flexible reports, we propose a limited scenario considering only: ten countries, no region, ten states, no size of business possible, no composition of capital, no class of market segment, ten chains, each chain with ten links. Also for this more restricted scenario, he filters from the 46 criteria is not considered. Table II presents the number of possible filters within the system for this more restricted scenario applicability.
Our experience with the use of flexible reports indicates that comparisons usually combine only two different types of information: i.e. small businesses in the automotive supply chain of state São Paulo and Ceará. In a new scenario, limiting the possibilities to only four countries, three Brazilian States, 16 PAs we would have the number of possible filters shown in Table III, representing a more current scenario.
In another example, you can find among the companies part of SIMAP, which ones are certified by ISO 9001“AND”the ones located in the countries studied. The answer is presented in Table IV.
(d) Flexible reports open to companies (on line)
Type of filter to be applied Quantity
No aggregation 130
Aggregation“AND” Over 871033
Aggregation“OR” Over 3.511056
Source:Authors
Table II. Benchmarking possibilities on wide scenario
Type of filter to be applied Quantity
Analysis of a given size (small, medium or large)“AND”of certain state (SP, RJ,…)
C1TC
1
E¼9
Analysis of certain PA“AND”of a particular country C1CC
1
E¼163¼48
Analysis of two certain AP (type“OR”)“AND”a given state C2CC
1
E¼252 Source:Authors
Table III. Examples of benchmarking analysis for current scenario
935
Flexible
benchmarking
The fourth report of the flexible type “on line “with multiple parameters is used to create statistical reports combining information of the space, the PAs and the company, as shown in Figure 9. It also uses aggregators such as “AND”and “OR.” Further analysis can be performed, such as:
• What is the performance of the PA in which the company operates, compared
with other PAs in which the company has an interest in acting?
• What is the performance average of the subsystems on the machining chain
“AND”that operates in the state of Ceará“AND”has small size (Figure 10)?
• What is the performance average of the subsystems on the automobile chain
“AND”that operates in the Ceará“AND”has small size (Figure 10)?
• What is the performance average of the subsystems on the automobile chain
“AND” that operates in the Rio Grande do Sul (RS) “AND” has small size (Figure 10)?
• What is the performance average of the subsystems on the machining chain
“AND”that operates in the Ceará“AND”has large size (Figure 10)?
The difference between Figures 8 and 9 is that the second does not show individual data with company names maintaining the confidentiality of the data. The results are
Answer Quantity %
Brazil 20 90.91
Spain 1 4.55
USA 1 4.55
Source:Authors Table IV.
Companies certified by on SIMAP
PA: Automotive Supply Chain of Ceara and RGS Performance in 7 Subsystems
Small and Ceara
Small and Ceara
C 40 0% 25% 50% 75% 100% 25% 50% 75% 100%
C 41 C 42
GP01 GP02 GP03 GP04 GP05 GP06 GP07
Small and RS
Small and RS Large and Ceara
Large and Ceara
Performance in GP06 Subsystem
Figure 10. Display of flexible comparisons available to companies
936
BIJ
22,5
illustrated in Figure 10 by comparing the average performance of small businesses of automotive supply chain of RS (State of Brazil located in South) and Ceará.
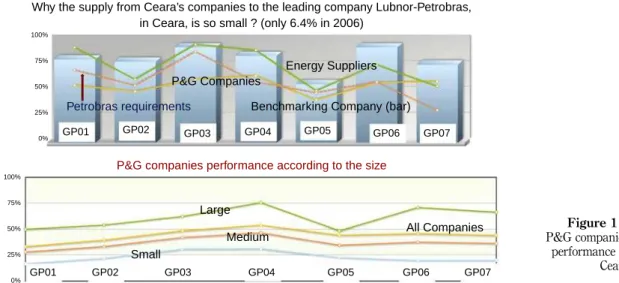
The Figure 11 was extracted from the flexible report“and/or”and represents the average performance of seven subsystems of P&G companies from Ceara. In this study, companies were separated by size, as the“number of employees”(small 1-99; medium 100-499; large up to 500). It shows that small and medium sized companies have a performance around 25-50 percent and Petrobras requirements are from 50 to 75 percent.
4. Conclusion
The proposal for a new type of benchmarking aims to draw attention to the potential use of this new tool. Through a literature review, the types of existing benchmarking and its evolution were identified and classified as six generations. The continuous trend of increasing scope and comprehensiveness is noted. The benchmarking progresses from product to strategies and from internal processes to comparisons of PAs and economic blocks. A model of flexible benchmarking has been characterized and exemplified through a case study of SIMAP, which presented the following main features:
• it allows continuous use and provides access and data processing by partners;
• meets the different demands and may be programmable varying range and
scope; and
• data processing and decision support tools allow varied reports and simulations.
The great differential presented by SIMAP is the flexibility to generate analysis for enterprise and dynamism in the collection and updating of data in the system. Another positive feature of the developed system is that it is developed on free software platforms, which reduces development costs.
SIMAP can be a tool for promoting local and regional competitiveness, innovation and growth, as well as for identifying best practice and sharing information about
Large
All Companies Medium
Small
GP01 0% 25% 50% 75% 100%
GP02 GP03 GP04 GP05 GP06 GP07
P&G companies performance according to the size
Energy Suppliers P&G Companies
Benchmarking Company (bar)
0% 25% 50% 75% 100%
Petrobras requirements
GP01 GP02 GP03 GP04 GP05 GP06 GP07 Why the supply from Ceara’s companies to the leading company Lubnor-Petrobras,
in Ceara, is so small ? (only 6.4% in 2006)
Figure 11. P&G companies performance in Ceara
937
Flexible
benchmarking
improvement strategies. Online services will also allow academics and practitioners to interact on a larger scale than otherwise possible.
After reporting the case study, the goal is to synthesize the characteristics of flexible benchmarking (Table V) exemplified in SIMAP through the steps of “benchmarking wheel.”
Throughout three years the SIMAP has evolved successfully meeting the demands of different projects with expansions of scope and range. This performance shall be deposited in the flexibility of its conception and use.
References
Ahmed, P.K. and Rafiq, M. (1998),“Integrated benchmarking: a holistic examination of select techniques for benchmarking analysis”,Benchmarking: An International Journal, Vol. 5 No. 3, pp. 225-242.
Albertin, M.R. (2003), “O processo de governança de arranjos produtivos: O caso da cadeia automotiva do RGS”, UFGRS, Tese de doutorado, Porto Alegre.
Altenburg, T., Hillebrand, W. and Meyer-stamer, J. (1998),“Building systemic competitiveness”, reports and working papers, German Development Institute, Berlin.
Andersen, B. and Pettersen, P. (1994),“The basics of benchmarking: what, when, how, and why”, Pacific Conference on Manufacturing,Djakarta.
Bhutta, K.S. and Huq, F. (1999), “Benchmarking – best practices: an integrated approach”, Benchmarking: An International Journal, Vol. 6 No. 3, pp. 254-268.
Bogetoft, P. and Nielsen, K. (2005), “Internet based benchmarking”, Group Decision and Negotiation, Vol. 14, May, pp. 195-215.
Camp, R.C. (1989), Benchmarking: The Search for Industrial Best Practices that Lead to Superior Performance, Quality Resources and ASQC Quality Press, New York, NY and Milwaukee, WI.
Carbonara, N., Giannoccaro, I. and Pontrandolfo, P. (2002), “Supply chains within industrial districts: a theoretical framework”,Production, Vol. 76, pp. 159-176.
Etzkowitz, H. and Zhou, C. (2006),“Triple helix twins: innovation and sustainability”,Science and Public Policy,Vol. 33 No. 1.
Steps Characteristics Examples
Demand identification
Continuous and adaptable Allows change of range and scope
New research, new PA and activities
Programming Flexible and customized tools LimeSurvey
Data gathering Benchmarking partners and others Restriction of individual data from other companies
Partners Online and continuous access Figure 3 Data processing Online
Parametric and nonparametric data
Various types of reports Bars, average, percentage, DEA Measurement
system
Unidimensional, bidimensional and multidimensional
Quantitative and qualitative variables
Electronic Survey Criteria
Reports Allow comparisons and simulations Decision support
Flexible reports with conditional filters: and/or/na
Parametric and nonparametric tools Source:Authors
Table V. Characteristics of flexible benchmarking
938
BIJ
22,5
GBN (2010),“GBN survey results: business improvement and benchmarking”, available at: www. globalbenchmarking.org accessed (Ferbruary 2010).
Johnson, W.H.A. (2008), “Roles, resources and benefits of intermediate organizations supporting triple helix collaborative R&D: the case of Precarn”,Technovation, Vol. 28, pp. 495-505.
Kyrö, P. (2003), “Revising the concept and forms of benchmarking”, Benchmarking: An International Journal, Vol. 10 No. 3, pp. 210-225.
Lehtinen, J. and Ahola, T. (2010), “Is performance measurement suitable for an extended enterprise?”, International Journal of Operations & Production Management, Vol. 30, pp. 181-204.
LimeSurvey (2009), “Artigo disponível em”, available at: www.limesurvey.org/ (accessed February 17).
Messner, D. (1996), “Die bedeutung von staat, markt und netzwerksteurung für systemische wettbewerbsfärigkeit”, INEF Report. Heft15Gerhard Universität, Duisburg.
Porter, M.E. (1998),“Clusters and the new economics of competition”,Harvard Business Review, Vol. 76 No. 6, pp. 77-90.
Routledge, P. (2001),“A heuristic model for benchmarking SME hotel and restaurant businesses on the internet”,Journal of Quality Assurance in Hospitality & Tourism.
Simatupang, T.M. (2001), “Benchmarking supply chain collaboration an empirical study”, International Journal.
Watson, G.H. (1993),Strategic Benchmarking: How to Rate Your Company’s Performance Against the World’s Best, John Wiley and Sons Inc., New York, NY.
Wong, W.P. (2008), “A review on benchmarking of supply chain performance measures”, International Journal, Vol. 15, pp. 25-51.
Further reading
Andersen, B., Fagerhaug, T., Randmñl, S. and Prenninge, R.J. (1999), “Benchmarking supply chain management: finding best practices”,Journal of Business, Vol. 14 No. 5, pp. 378-389.
Camarinha-matos, L.M., Afsarmanesh, H., Galeano, N. and Molina, A. (2009),“Computers & industrial engineering collaborative networked organizations –concepts and practice in manufacturing enterprises”,Computers & Industrial Engineering, Vol. 57 No. 1, pp. 46-60, available at: http://dx.doi.org/10.1016/j.cie.2008.11.024
Johnson, A., Chen, W.C., Mcginnis and Leon, F. (2010),“Large-scale internet benchmarking: technology and application in warehousing operations”,Computers in Industry, Vol. 61, pp. 280-286.
Zhou, H. and Benton, W.C. Jr (2007),“Supply chain practice and information sharing”,Journal of Operations Management, Vol. 25 No. 6, pp. 1348-1365.
(The Appendix follows overleaf.)
939
Flexible
benchmarking
Appendix 1. Benchmarking Questionnaire Hints for fulfilling: To be 100% is necessary before to be 75%, and to be 75% is necessary before to be 50%, and forward …
Integrated Management System (GP01)
GP01 0 25 50 75 100
1. ISO 9001 2. ISO 14001 3. 5S 4. SA 8,000 5. OSHAS 18,000
Informal Procedures Documented Procedures Formal program deployment Conducts internal audits Certificated
Production Management (GP02)
GP02 0 25 50 75 100
6. Setup time Informal
Procedures
Documented Procedures Timeo60 min Timeo40 min o10 (SMED)
7. Production Planning and Control (PPC)
Informal Procedures
Electronic sheets (Excel, Calc, etc.)
Software MRP and ERP MRP II
8. Capability studies Informal
Procedures
Instable process Stable process CEP CpkW2
9. Quality costs Unknown Monitors 1-10% revenue o1% revenue o0,5 revenue
10. Process Control Informal
Parameters
Formal Parameters Monitored
parameters
Calibrated instruments
Capability studies
11. Part Per Million (PPM) Unknown Known 1-10% o1,000 PPM o500 PPM
12. Total Preventive Maintenance (TPM)
Corrective Maintenance plan
informal
Preventive Predictive TPM
13. Just in Time Not use tools One tool Two tolls Three tools Many tools
14. Suppliers development Informal
Procedures
Formal Procedures Monitors
performance
Training programs Establishing
partnership
15. Average age of equipment Unknown More than 20 years Between 10 and
20 years
Between 5 and 10 years
More than 5 years
(continued) Table AI. Integrated Management System
(GP01)
940
22,5
BIJ
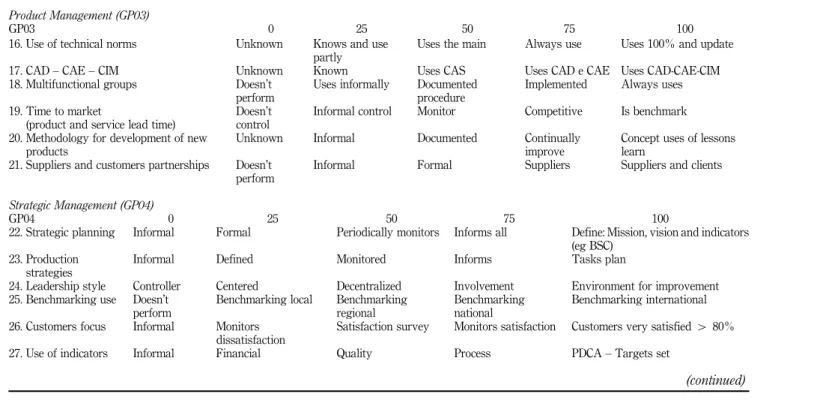
Product Management (GP03)
GP03 0 25 50 75 100
16. Use of technical norms Unknown Knows and use
partly
Uses the main Always use Uses 100% and update
17. CAD–CAE–CIM Unknown Known Uses CAS Uses CAD e CAE Uses CAD-CAE-CIM
18. Multifunctional groups Doesn’t
perform
Uses informally Documented
procedure
Implemented Always uses
19. Time to market
(product and service lead time)
Doesn’t
control
Informal control Monitor Competitive Is benchmark
20. Methodology for development of new products
Unknown Informal Documented Continually
improve
Concept uses of lessons learn
21. Suppliers and customers partnerships Doesn’t
perform
Informal Formal Suppliers Suppliers and clients
Strategic Management (GP04)
GP04 0 25 50 75 100
22. Strategic planning Informal Formal Periodically monitors Informs all Define: Mission, vision and indicators
(eg BSC) 23. Production
strategies
Informal Defined Monitored Informs Tasks plan
24. Leadership style Controller Centered Decentralized Involvement Environment for improvement
25. Benchmarking use Doesn’t
perform
Benchmarking local Benchmarking
regional
Benchmarking national
Benchmarking international
26. Customers focus Informal Monitors
dissatisfaction
Satisfaction survey Monitors satisfaction Customers very satisfiedW80%
27. Use of indicators Informal Financial Quality Process PDCA–Targets set
Table
AI.
(continued)
941
Flexible
benchmarking
Logistic Management (GP05)
GP05 0 25 50 75 100
28. Stock control Low control,
WITHOUT using specific systems or spreadsheets
Documented control, ONLY the finished product, with the use of spreadsheets
Documented control of the finished product and intermediate stocks
Use of interdependent systems of control stocks
Stock Integrated management (integrated suppliers)
29. Stock rotativity Low spin, without
monitoring
Monitoring partial Turnover of stocks of 1 to 12
times a year
Turnover of stocks of 12 to 24 times a year
Turnover of stocks more than 24 times a year
30. Logistics Services Not considered
important and has its own fleet
Uses only carrier outsourced
Uses transport contractors and other service
Use logistics operator with at least three functions
Uses the operator logistics as integrator (all channel)
31. Handling Do not use
machines
Use few machines, default kind, with much human interference (manual)
Uses standard machines and few specific machines, with much human intervention (manual)
Semi-automated system, with little human interference, customized tools for handling
Specialized machinery, use of fully automated systems and robotics
32. Unitization Do not use any kind Use pallets of any kind Use specific pallet, shelves
and others
Use specific pallets, also uses larger stents
Use of various types of stents, with
standardization focused on the final transport
33. Material flow Manual Visual
control
Electronic Sheet and software
Use of bar code RFID and GPS Intelligent container
34. Information flow Consultation over
cell phone
Consultation over internet and email
EDI Satellite tracking Date basis integrated in
the supply chain
35. Financial flow informal individual Partial integrated Sharing databases Total integrated
36. Commerce transaction
Manual Computer assister
ordering
RC or VMI ECR and CRM Marketplace
37. Warehouse control Manual Visual Control
Electronic Sheet and software
Use of bar code Cell phone tracking or
Picking voice or RFID
Warehouse Management System 38. Transportation system Informal Electronic
Sheet and software
Milk-run GPS, Routing software Transportation
Management System 39. Supply chain
relationship
Arms length relationship
Partnership Long period partnership Supplier Relationship
Management
Strategic partnership
(continued)
Table
AI.
942
22,5
BIJ
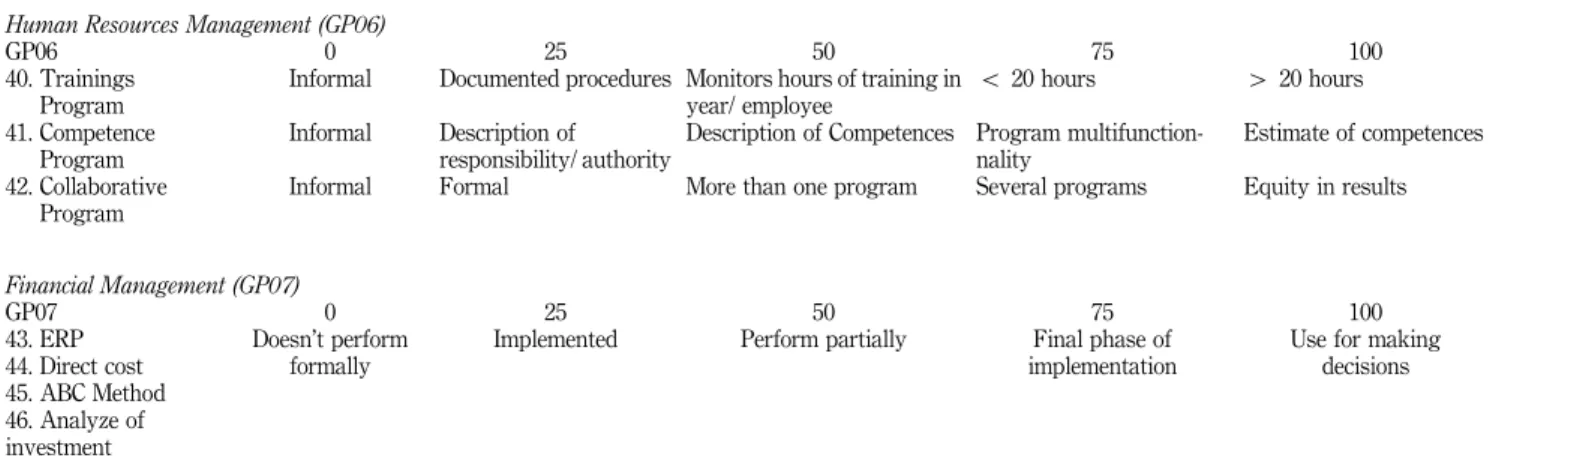
Human Resources Management (GP06)
GP06 0 25 50 75 100
40. Trainings Program
Informal Documented procedures Monitors hours of training in
year/ employee
o20 hours W20 hours
41. Competence Program
Informal Description of
responsibility/ authority
Description of Competences Program multifunction-nality
Estimate of competences
42. Collaborative Program
Informal Formal More than one program Several programs Equity in results
Financial Management (GP07)
GP07 0 25 50 75 100
43. ERP 44. Direct cost 45. ABC Method 46. Analyze of investment
Doesn’t perform
formally
Implemented Perform partially Final phase of
implementation
Use for making decisions
Table
AI.
943
Flexible
benchmarking
About the authors
Dr Marcos Ronaldo Albertin, has an Engineering Degree from the Pontifícia Católica University of Rio Grande do Sul (1983), received a Master’s Degree in Industrial Engineering from the Bochum Universität (1993) and Doctoral Degree in Industrial Engineering from the Federal University of Rio Grande do Sul (2003). He has been an Adjunct Director at the Technological Center at the Federal University of Ceará. He has many years of experience in industrial engineering with an emphasis in benchmarking and quality control, acting mainly in: ISO 9001, TS 16949, Toyota Production System and integrated management system. Dr Marcos Ronaldo Albertin is the corresponding author and can be contacted at: [email protected]
Dr Heraclito Lopes Jaguaribe Pontes, has an Industrial Engineering Degree at the Federal University of Ceará (2003), received a Master’s Degree in Manufacturing Engineering from the University of São Paulo (2006) and a Doctoral Degree in Manufacturing Engineering from the University of São Paulo (2012). Currently, he is the Coordinator and an Associate Professor at the Federal University of Ceará. He has experience in industrial engineering with emphasis in logistics, production management, computer simulation and information technology.
Enio Rabelo Frota was born in Fortaleza, Brazil in 1989. He is an Undergraduate Student in Industrial Engineering at the Federal University of Ceará. He also went to study at the Industrial Engineering Department of North Carolina A&T State University (2012) as part of the Brazil Science Without Borders Scholarship Program, where he was certified as a Six Sigma Green Belt and worked as a Research Assistant, running experiments, collecting and analyzing data in projects addressing human-machine interaction. He has experience in industrial engineering working in local factories applying concepts of production systems and quality management.
Matheus Barros Assunção was born in Fortaleza, Brazil in 1992. He is an Undergraduate Student in Industrial Engineering at the Federal University of Ceará. Also, he spent one year in the USA as an exchange student at the Iowa State University through the Science Without Borders Program, by the Brazilian Government.
For instructions on how to order reprints of this article, please visit our website:
www.emeraldgrouppublishing.com/licensing/reprints.htm
Or contact us for further details:[email protected]