Predicting Fluctuating Rates of
Hospitalizations in Relation to Influenza
Epidemics and Meteorological Factors
Radia Spiga1*, Mireille Batton-Hubert2, Marianne Sarazin3,4,5,6
1Service de Santé publique et d’information médicale, Centre Hospitalo-Universitaire, Saint-Etienne, France,2Ecole Nationale Supérieure des Mines, Unité Mixte de Recherche 6158, Institut Fayol, Saint-Etienne, France,3Institut National de la Santé et de la Recherche Médicale, Unité Mixte de Recherche en Santé 1136, Paris, France,4Sorbonne Universités, Université Pierre et Marie Curie Paris 06, Paris, France,
5Centre Ingénierie et Santé, Ecole Nationale Supérieure des Mines, Saint Etienne, France,6Département d’Information Médicale, Centre Hospitalier, Firminy, France
Abstract
Introduction
In France, rates of hospital admissions increase at the peaks of influenza epidemics. Pre-dicting influenza-associated hospitalizations could help to anticipate increased hospital activity. The purpose of this study is to identify predictors of influenza epidemics through the analysis of meteorological data, and medical data provided by general practitioners.
Methods
Historical data were collected fromMeteo France, the Sentinelles network and hospitals’
information systems for a period of 8 years (2007–2015). First, connections between
meteo-rological and medical data were estimated with the Pearson correlation coefficient, Principal component analysis and classification methods (Ward and k-means). Epidemic states of tested weeks were then predicted for each week during a one-year period using linear dis-criminant analysis. Finally, transition probabilities between epidemic states were calculated with the Markov Chain method.
Results
High correlations were found between influenza-associated hospitalizations and the vari-ables: Sentinelles and emergency department admissions, and anti-correlations were found between hospitalizations and each of meteorological factors applying a time lag of: -13, -12 and -32 days respectively for temperature, absolute humidity and solar radiation. Epidemic weeks were predicted accurately with the linear discriminant analysis method; however there were many misclassifications about intermediate and non-epidemic weeks. Transition probability to an epidemic state was 100% when meteorological variables were below: 2°C, 4 g/m3and 32 W/m2, respectively for temperature, absolute humidity and solar
radiation. This probability was 0% when meteorological variables were above: 6°C, 5.8g/m3
and 74W/m2.
a11111
OPEN ACCESS
Citation:Spiga R, Batton-Hubert M, Sarazin M (2016) Predicting Fluctuating Rates of
Hospitalizations in Relation to Influenza Epidemics and Meteorological Factors. PLoS ONE 11(6): e0157492. doi:10.1371/journal.pone.0157492
Editor:Jeffrey Shaman, Columbia University, UNITED STATES
Received:January 12, 2016
Accepted:May 30, 2016
Published:June 16, 2016
Copyright:© 2016 Spiga et al. This is an open access article distributed under the terms of the
Creative Commons Attribution License, which permits unrestricted use, distribution, and reproduction in any medium, provided the original author and source are credited.
Data Availability Statement:Meteorological data are available from the "Meteo France" Institutional
Data Access:http://www.meteofrance.com/.
Sentinelles data data are available from the "Sentinelles" Network Institutional Data Access:
https://websenti.u707.jussieu.fr/sentiweb/. Hospital data are available from Public Health and Medical Informatics Unit of Saint Etienne university hospital:
http://www.chu-st-etienne.fr/, and the informatic department of Firminy Hospital: http://www.hopital-lecorbusier.fr/.
Conclusion
These results confirm a good correlation between influenza-associated hospitalizations, meteorological factors and general practitioner’s activity, the latter being the strongest
pre-dictor of hospital activity.
Introduction
In France, rates of hospitalizations depend primarily on admissions from hospital emergency departments. Anticipating the flux in the number of hospitalizations is usually done daily and
contextually based on empiric evidence [1]. Among the hypotheses considered to explain the
observed fluctuations, two major factors appear to be the climate and epidemics. Indeed, an increase in hospitalizations is observed during epidemic peak periods of certain viral infections
[2,3]. This phenomenon is observed particularly for outbreaks of influenza that occur
season-ally, peaking during the winter season in temperate regions. Although benign, influenza repre-sents a public health problem with an important morbidity and mortality rate in high risk
individuals [4–7]. Despite gains in clinical knowledge and the existence of vaccines, influenza
reappears every year as a seasonal epidemic with variable duration and intensity [8,9]. This
phenomenon is in part explained by the characteristic of the virus: it is an enveloped RNA
virus that is member of theOrthomyxoviridaefamily and genusinfluenzaeof which there are
three types A, B and C, and the first two are found in humans. These viruses are very unstable because of gene mutations that prevent a permanent immunization of infected individuals
[10–12]. Virus A (H1N1 and H3N2) and B are primarily active during epidemics [13].
In order to explain the seasonality of the flu, two other hypotheses have been made. The first, the seasonal variation of the host’s immune status may be linked to sun exposure and the photosynthesis of vitamin D. Vitamin D plays a role in regulating acquired immunity and in
reinforcing the innate immune system [14–16].
The second hypothesis is that both temperature and humidity may contribute to the
trans-missibility and viability of the virus. In their study on domestic guinea pigs, Lowenet al[17]
have shown that viral transmission increases at temperatures below 5°C and in low humidity conditions. The formation and stability of air-born droplet nuclei that contain the virus are
favoured in this environmental context [18]. Other studies on flu epidemic modeling and
pre-diction have confirmed the role of temperature and absolute humidity (AH) in the spread of
the virus on outpatients [19–24].
Based on these findings, the purpose of this study is to predict an influenza epidemic hospi-tal status. This is achieved by identifying the strongest predictors, and establishing the time lags required to have an effect on hospital epidemic outbreak. To this end, two approaches may be used: the Linear Discriminant Analysis (LDA) including meteorological and outpatient data, and the Markov Chain method to calculate the transition probability from an epidemic state to another. Using these methods as predictive tools would allow a better management at a hospi-tal level. This study was undertaken in France in the department of the Loire (Rhône-Alpes region, in East-central France), and represents a first step in the prediction of operational man-agement of hospital emergency services.
Materials and Methods
Source Data
All data were collected during the period spanning the 1st week of 2007 to the 8thweek of 2015
and in a geographically confined territory: the southern part of the department of the Loire Competing Interests:The authors have declared
located in the Rhône-Alpes region of France, with 750 000 inhabitants. The average distance
from the two main hospitals of the studied area is about 20 km [25]. Data were collected in
aggregated form (patient number per week) and did not require approval from an ethics committee.
Meteorological Data. Data were taken from the Andrézieux Station managed byMétéo France[26]. Variables considered were temperature in degrees Celsius (°C) and relative humid-ity in percent measured as a daily average, as well as the daily solar duration time in minutes.
Epidemic Data. Data for this study were obtained from the European network Sentinelles
[27]. Sentinelles is a network of 1300 private practice doctors and volunteers, spread across
Metropolitan France, that collects information on an on-going basis on eight health indicators, including influenza, that are encountered in daily practice. Information includes the age, sex, immunization status of patients presenting influenza-like symptoms who are seen during con-sultations with general practitioners. Forty-two general practitioners, dispersed evenly over the territory concerned, were involved in the collection of data. The total weekly incidence rate of influenza-like-illness (ILI) over the territory was calculated using the adjustment method for the usual general population of the Sentinelles network.
Hospital Data. Patient data were provided by the health record systems of the two main hospitals in the geographical zone concerned: The University-Hospital of Saint Etienne and Firminy Hospital. Previously anonymized using the official national French insurance
encryp-tion software [28,29], they were extracted in an aggregated form (weekly data). The data
col-lected were age, sex and diagnosis coded according to the 10threvision of the International
Classification of Diseases (ICD-10). Three groups of patients were established:
• Influenza-associated hospitalizations (IAH): Hospitalized patients with a diagnosis of viral
influenza or ILI as a primary or accompanying diagnosis, for a length of stay of less than a week. Codes and decision-making algorithms used to characterize this state were based on a
previous study [30].
• Hospitalized patients admitted by emergency departments for all causes (ED admission).
• Patients who visited emergency departments, but who were not subsequently hospitalized
(ED visit)
Variables Transformation. To coincide with the available weekly data of Sentinelles net-work, meteorological data were aggregated into weekly averages.
Furthermore, the absolute humidity in g/m3was calculated using relative humidity
accord-ing to the Clausius-Clapeyron equation [20], and solar radiation was converted to W/m2using
the Angström equation [31].
The hospital epidemic threshold was characterized for each week by taking the quartiles of hospitalizations associated to the influenza variable (IAH). A categorical variable was consti-tuted taking the value 0 or non-epidemic state for case volumes below the first quartile, the
value 1 or intermediate state (volumes between the 1stand 2ndquartile), and the value 2 or
epi-demic state (volumes above the 3rdquartile).
Data Analysis
assessed by the Pearson correlation coefficient applying a time lag corresponding to the latent influence of meteorological and epidemic factors on hospitalizations: assuming that explicative variables effects on IAH’s are not immediate time lags have been tested to improve correlations. The Kruskal-Wallis test was used to verify the comparability between each group according to the weekly epidemic states, and according to age groups.
A principal component analysis (PCA) identified some common groups in the data and
cor-relations between the variables. The n individuals correspond to the weeks (from the 1stweek
of 2007 to the 8thweek of 2015); the p variables correspond to the meteorological, Sentinelles,
and hospital data.
Two methods of classification: Ward’s hierarchical clustering then the k-means classifica-tion, where performed to obtain the maximal similarity of n individuals within clusters, and
maximal dissimilarity of individual profiles between clusters [32].
The Ward’s method consists in aggregating two clusters such that the growth of within-inertia is minimum at each step of the algorithm. The within-within-inertia characterizes the homoge-neity of a cluster. The hierarchy is represented by a dendrogram which is indexed by the gain of within-inertia. The hierarchical clustering here is performed onto the principal components. The partition obtained from the cut of the hierarchical dendrogram, is introduced as the initial partition of the K-means algorithm.
The K-means algorithm is a partitioning classification algorithm which iteratively regroups into K clusters a set of n individuals characterized by m variables. Each cluster is centred around a point, called the cluster centroid, which represents the average coordinate of the clus-ter’s elements. Centroids are recalculated at each iteration and these steps are repeated until the centroids no longer move.
Predictive analysis
A Fisher’s linear discriminant analysis (LDA) made it possible to define discriminant functions and then to predict the membership group of the weeks (epidemic, intermediate or
non-epi-demic) based on predictor variables [33].
LDA builds j = min(k-1,p) discriminant functions that estimate discriminant scores (D ji)
for each ofi = 1,. . .,nindividuals classified into k groups, from p linearly independent predictor
variables (X) as
Dji¼wi1X1iþwi2X2iþ þwipXpi
[i= 1,. . .,nandj= 1,. . .,min(k−1,p)]
Discriminant weights (w ij) are estimated by ordinary least squares so that the ratio of the
variance within the k groups to the variance between the k groups is minimal. The classification function is:
Cji¼cj0þcj1X1iþcj2X2iþ þcjpXpi
Each of the j = 1,. . .,k groups can therefore be constructed from the discriminant scores.
The coefficients of the classification function for the jthgroup are estimated from the within
sum of squares matrixes (W) of the discriminant scores for each group and from the vector of
the p discriminant predictors means in each of the classifying groups (M) asCj=W−1M
withcjo=logp−12/CjMj
The prediction was tested on each year using as training sample the remaining six years. Then the confusion matrix determined the number of successful recognitions, and identified the incorrect match confused with another word. In general, for N number of words, the
For alli = j, the value of pijindicates the number of correct recognitions, while for i6¼j, the
value of pijindicates the confusion trend.
Finally, to predict the probability of transition from one epidemic state to another, a Markov chain model was used. This method aims to specify a system of transitions, yielding
probabilis-tic trajectories connecting current and previous or future states [34]. Identifying the transition
as a random process, the Markov dependency theory emphasizes "memoryless property" i.e. the next state of any process strictly depends on its current state but not its past sequence of states noticed over time:
PðXnþ1¼xnþ1=X1¼x1;X2¼x2;
. . .Xn¼xnÞ ¼PðXnþ1¼xnþ1=Xn¼xnÞ
The Markov chain method was used for winter weeks (in December, January and February), and for different meteorological conditions. The thresholds established to classify the meteoro-logical variables were the quartiles of their values during the winter period.
Data processing and analysis were performed using R 3.1.2 software.
Results
Description of the Data
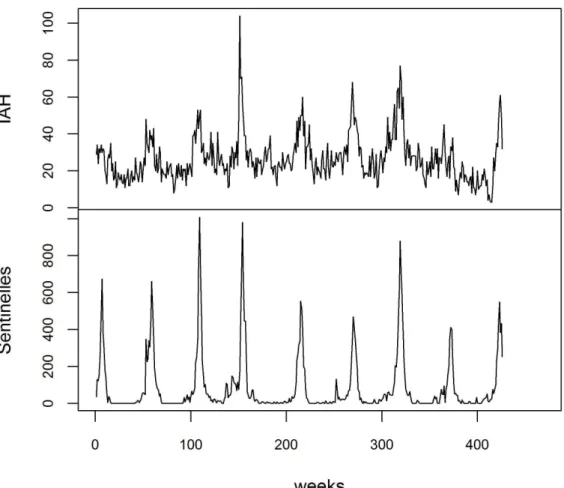
Between 2007 and 2015, there were 11,389 IAH with a minimum of 3 IAH /week and a
maxi-mum of 104 IAH/week (Table 2), the number of hospitalizations varied according to the years
and seasons (Fig 1) with a weekly average of 31 IAH in the winter and 19 IAH for the
remain-der of the year, and according to age groups with a consiremain-derably larger number of people over
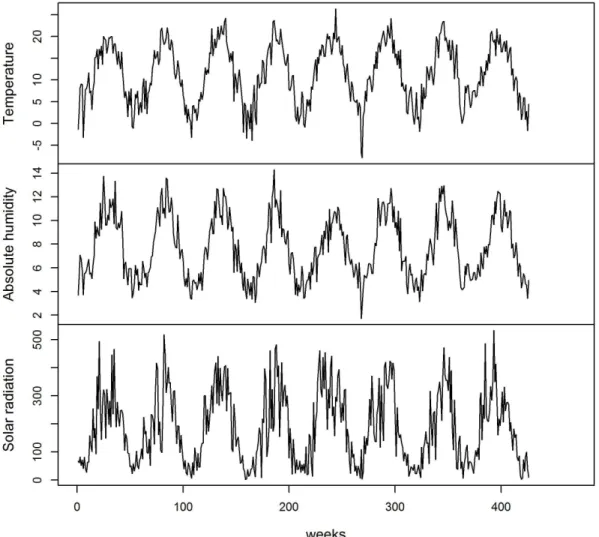
65 (p<0.001); During the same period the average values of temperature, absolute humidity
and solar radiation were respectively 11.33°C (95% CI: 10.69–11.98), 7.68 g/m3(95% CI: 7.43–
7.94) and 185.80 W/m2(95% CI: 173.54–198.06) in the department of the Loire (Table 2and
Fig 2).
We found a negative correlation between IAH and meteorological factors (p<0.001), which
increases when taking into account a time lag of -13 days for temperature, -12 days for absolute
humidity and -32 days for solar radiation (Table 3). We also observed a close correlation
Table 1. Confusion matrix.
TRUE VALUES
PREDICTED VALUES P11 P12 . . . P1N
PREDICTED VALUES P21 P22 . . . P2N
PREDICTED VALUES . . . .
PREDICTED VALUES PN1 PN2 . . . PNN
doi:10.1371/journal.pone.0157492.t001
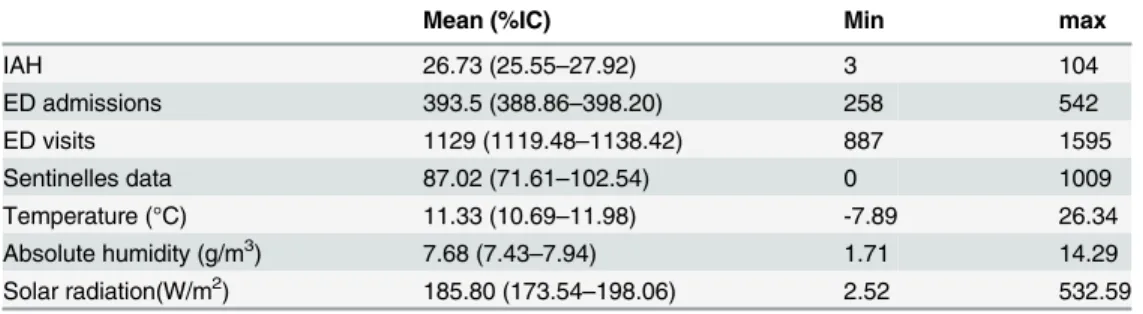
Table 2. Descriptive statistics of epidemic and meteorological variables.
Mean (%IC) Min max
IAH 26.73 (25.55–27.92) 3 104
ED admissions 393.5 (388.86–398.20) 258 542
ED visits 1129 (1119.48–1138.42) 887 1595
Sentinelles data 87.02 (71.61–102.54) 0 1009
Temperature (°C) 11.33 (10.69–11.98) -7.89 26.34
Absolute humidity (g/m3) 7.68 (7.43
–7.94) 1.71 14.29
Solar radiation(W/m2) 185.80 (173.54
–198.06) 2.52 532.59
between IAH and two clinical variables: hospital emergency intakes (0.53 p<0.001) and the
Sentinelles data particularly when these lag by -1 week (0.70, p<0.001), (Table 3).
The Kruskal Wallis test results showed that, among IAH cases, the 65+ age group is
signifi-cantly more frequent than other age groups (p<0.001). In contrast, for influenza cases treated
by general practitioners (Sentinelles data), people under 65 are significantly more
preponder-ant (p<0.001) (Fig 3). Our analysis also showed a notable difference in the relation between
the meteorological data and the presence or absence of an epidemic state in a hospital: the mea-sured values for each meteorological variable are significantly lower during the weeks that are
considered as epidemic (p<0.001).
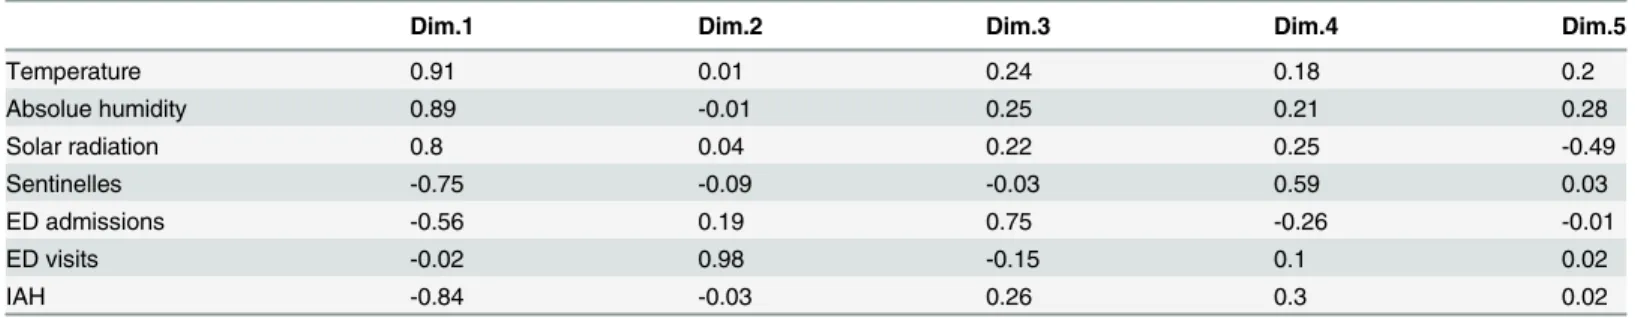
PCA results: the first two PCA factorial axes explain 69.5% of the information and 55.03% from axis 1 with a larger contribution from temperature and absolute humidity meteorological
data (Table 4). The variables projection on the planes of the first two PCA factorial axes
indi-cates an anti-correlation between the meteorological variables and the clinical variables (IAH, Sentinelles data and emergency data). There is no correlation between short stays and the other
variables and, a non-correlation between short stays and meteorological variables (Fig 4).
Using Ward’s clustering method and K-means cluster analysis the subjects could be
orga-nized into three groups (Fig 5). These groups are essentially differentiated by the temperature
factor: the first group is defined by epidemic weeks with an average temperature of 2.62°C; the second group corresponds to weeks of intermediate epidemic state with an average
Fig 1. Evolution of Influenza-Associated Hospitalizations (IAH) and Sentinelles data from the first week of 2007 to 8thweek of 2015
Fig 2. Evolution of meteorological variable values from the first week of 2007 to 8thweek of 2015
doi:10.1371/journal.pone.0157492.g002
Table 3. Correlation matrix (delays in parentheses when applied).
IAH Sentinelles data
Sentinelles (-7days)
ED visits
ED admissions
Temperature (-13days)
Absolute humidity (-12days)
Solar radiation (-32days)
IAH 1 0.68 p<0.001 0.70 p<0.001 -0.01 p = 0.9
0.53 p<0.001 -0.63 p<0.001 -0.61 p<0.001 -0.55 p<0.001
Sentinelles data 0.68 1 0.91 p<0.001 0.02 p = 0.9
0.29 p<0.001 -0.61 p<0.001 -0.55 p<0.001 -0.50 p<0.001
Sentinelles (-7days)
0.70 0.91 1 -0.01
p = 0.9
0.27 p<0.001 -0.59 p<0.001 -0.55 p<0.001 -0.48 p<0.001
ED Visits -0.01 0.02 -0.01 1 0.06 p = 0.9 -0.01 p = 0.9 -0.04 p = 0.9 0.00 p = 0.9
ED admissions 0.53 0.29 0.27 0.06 1 -0.39 p<0.001 -0.38 p<0.001 -0.34 p<0.001 Temperature
(-13days) -0.63 -0.61 -0.59 -0.01 -0.39 1 0.93 p
<0.001 0.73 p<0.001
Absolute Humidity
(-12days) -0.61 -0.55 -0.55 -0.04 -0.38 0.93 1 0.70 p
<0.001
Solar radiation
(-32days) -0.55 -0.50 -0.48 0.00 -0.34 0.73 0.70 1
temperature of 7.62°C; and the third group corresponding principally to non-epidemic weeks with an average temperature of 17.47°C.
Prediction Methods
Linear discriminant analysis. For each year predicted, the rate of prediction error varied from 11% to 19%. The best results were obtained when the prediction was tested during 2014. The coefficients of explanatory variables on the two LDA axes for each year, are represented inTable 5, which shows that the variable with the larger coefficient is the incidence of influenza (Sentinelles data). LDA provides correct predictions of epidemic weeks: only two epidemic weeks were wrongly classified as intermediate epidemic week in 2011 and 2012. However, according to the predicted year, misclassification numbers varied between six and ten: they cor-responded in most cases to non-epidemic and intermediate epidemic weeks, in addition, for all the years considered, ten intermediate epidemic weeks, were classified as epidemic week (Table 6).
Fig 3. A: Influenza-Associated Hospitalizations (IAH) boxplot according to age groups; B: Boxplots of influenza incidence values (from Sentinelles network) by age groups.
doi:10.1371/journal.pone.0157492.g003
Table 4. PCA—Contribution of variables in PCA first five dimensions.
Dim.1 Dim.2 Dim.3 Dim.4 Dim.5
Temperature 0.91 0.01 0.24 0.18 0.2
Absolue humidity 0.89 -0.01 0.25 0.21 0.28
Solar radiation 0.8 0.04 0.22 0.25 -0.49
Sentinelles -0.75 -0.09 -0.03 0.59 0.03
ED admissions -0.56 0.19 0.75 -0.26 -0.01
ED visits -0.02 0.98 -0.15 0.1 0.02
IAH -0.84 -0.03 0.26 0.3 0.02
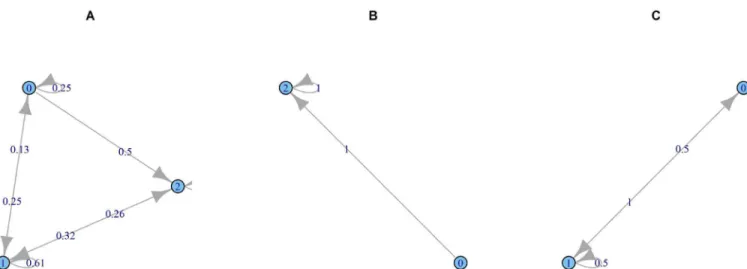
Markov Chain Prediction. Our data analysis showed that during the winter all three states can occur (epidemic, intermediate or non-epidemic) but with lower probabilities of changing
to a non-epidemic week or remaining non-epidemic (Fig 6A). Probabilities of transitioning
from one epidemic state to another change with the weather conditions. When the three
weather variables are very low, respectively below 32 W/m2, 2°C and 4 g/m3for solar radiation,
temperature and absolute humidity, the probability of changing from a non-epidemic to an
epidemic week, or remaining non-epidemic is 1 (Fig 6B). When these variables are above the
highest threshold, respectively 74W/m2, 6°C and 5.8g/m3for solar radiation, temperature and
absolute humidity, the probability of changing to an epidemic week becomes nil (Fig 6C).
Discussion
This study, carried out in France in a continental climate, reports on a new statistical method allowing to characterize the links between meteorological factors, incidence of influenza treated in non-hospital settings and hospital visits for influenza or its effects. This innovative approach
Fig 4. Projection of variables on the first two PCA factorials.IAH = Influenza-Associated Hospitalizations; ED = Emergency Department; AH = Absolute Humidity; SR = Solar Radiation; T = Temperature.
based on previously published findings [17,20,35] proposes an interesting predictive method to anticipate hospital management of influenza.
The high correlation between the number of cases of influenza treated by general practition-ers and the fluctuating rates of hospital emergency services entries due to influenza confirms the important role of anticipation in the management of flu epidemics. Hospitals are becoming more and more overcrowded by an influx of patients, particularly in winter and their
Fig 5. Ward’s clustering method (dendrogram) consolidated by k-means classification (colored individuals)
doi:10.1371/journal.pone.0157492.g005
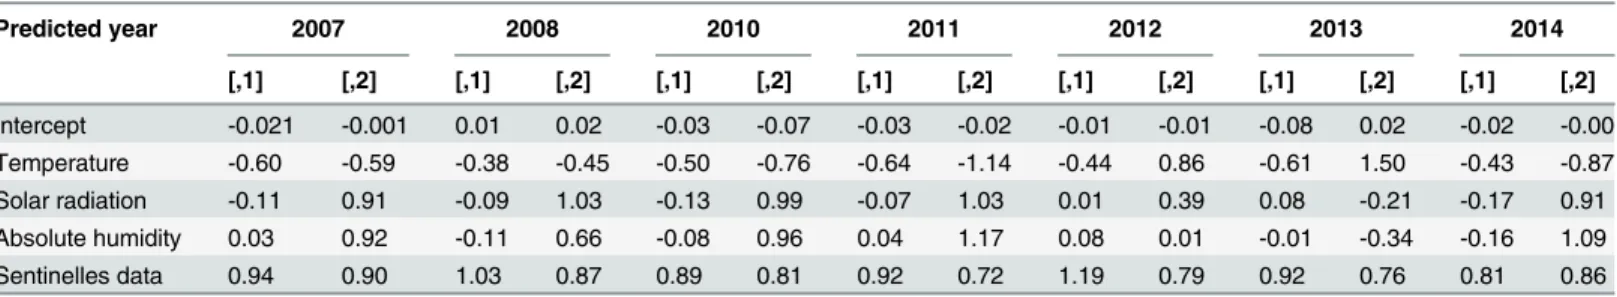
Table 5. LDA—Coefficients of discriminant factor son the two discriminant function axes, for each year predicted.
Predicted year 2007 2008 2010 2011 2012 2013 2014
[,1] [,2] [,1] [,2] [,1] [,2] [,1] [,2] [,1] [,2] [,1] [,2] [,1] [,2]
Intercept -0.021 -0.001 0.01 0.02 -0.03 -0.07 -0.03 -0.02 -0.01 -0.01 -0.08 0.02 -0.02 -0.00 Temperature -0.60 -0.59 -0.38 -0.45 -0.50 -0.76 -0.64 -1.14 -0.44 0.86 -0.61 1.50 -0.43 -0.87 Solar radiation -0.11 0.91 -0.09 1.03 -0.13 0.99 -0.07 1.03 0.01 0.39 0.08 -0.21 -0.17 0.91 Absolute humidity 0.03 0.92 -0.11 0.66 -0.08 0.96 0.04 1.17 0.08 0.01 -0.01 -0.34 -0.16 1.09
Sentinelles data 0.94 0.90 1.03 0.87 0.89 0.81 0.92 0.72 1.19 0.79 0.92 0.76 0.81 0.86
management requires a growing number of tools to facilitate prediction of patient numbers so
that the necessary human and technical resources can be adapted [36]. While the Sentinelles
network’s aim is to characterize an epidemic state in the general population in France, this study proposes a novel method of prediction to allow characterization of an epidemic state within hospitals.
Table 6. Predictive LDA- Confusion matrix, for each predicted year.
True Error rate
Predicted Non-epidemic Intermediate Epidemic
2007 Non-epidemic 37 2 0 15.4%
2007 Intermediate 5 7 0
2007 Epidemic 0 1 0
2008 Non-epidemic 34 3 0 17.3%
2008 Intermediate 3 6 0
2008 Epidemic 0 2 4
2010 Non-epidemic 32 5 0 19.2
2010 Intermediate 5 9 0
2010 Epidemic 0 0 1
2011 Non-epidemic 28 4 0 17.3%
2011 Intermediate 0 8 1
2011 Epidemic 0 4 7
2012 Non-epidemic 19 1 0 15.4
2012 Intermediate 4 13 1
2012 Epidemic 0 2 12
2013 Non-epidemic 26 3 0 15.4%
2013 Intermediate 5 9 0
2013 Epidemic 0 0 9
2014 Non-epidemic 39 0 0 11.3%
2014 Intermediate 5 4 0
2014 Epidemic 0 1 4
doi:10.1371/journal.pone.0157492.t006
Fig 6. Markov Chain—A-Probability of transition for different winter epidemic states, 0 = non-epidemic, 1 = intermediate, 2 = epidemic; B—When the values of meteorological variables are below the lower thresholds: solar radiation<32 W/m2, temperature<2°C and AH<4 g/m3; C- When the values of meteorological variables are above the upper threshold: solar radiation>74 W/m2, temperature>6°C and AH>5.8 g/m3.
As described earlier, the effects of meteorological factors on flu epidemic in non-hospital and in hospital settings happen with a clinically and scientifically coherent delay. A lag of thirty-two days between sunny weather and the number of influenza-associated hospitalization can be explained by the time required for photosynthesis to occur and the release of vitamin D
into the blood stream [14,37]. As to temperature and absolute humidity, these act on the virus
viability and transmissibility. Even considering an incubation time of 48 hours and a latency period of a few days before consulting a physician, both related to the clinical progression of influenza, the 13 and 12 day intervals before hospitalization that were observed for these two factors appear high. However, IAH’s occur mainly among seniors (65 years and older). For this category of patients, influenza occurs later with higher risks of complication, requiring
hospi-talization [4,5,38]. This hypothesis is supported by the better correlation we observed when the
outpatient treatment data provided by the Sentinelles network precede the IAH data by a week
(Pearson correlation = 0.70,Table 3).
With the objective of predicting IAH, a first approach was to use a linear discriminant anal-ysis at specific time intervals in order to predict the epidemic state in future weeks based on the values of explanatory variables. This method shows a good predictive accuracy to indicate epi-demic weeks. The second approach examined, using Markov chains, aimed at predicting tran-sitional states (epidemic/intermediate/non-epidemic) which are the most interesting to anticipate in terms of health planning. This method showed higher probabilities when the weather conditions are considered in the analysis; this demonstrates the usefulness of close interactions with Meteorological centres for predicting hospitalizations for hospital manage-ment purposes.
The use of these approaches is indeed possible, especially as the different data producers (Météo France and Sentinelles network) operate in such a way that each variable is provided within a time frame compatible with the application of this method. In addition, taking into consideration the week delay for Sentinelles network data supports the predictive role of such a model. Based on our results, it is possible to consider designing computerized tools for hospital use. However, this process depends on the timely availability of hospital data which remains slow in relation to the required prediction timelines and might limit the software’s
effective-ness. The implementation of an individual billing plan in health establishments known as
“Fac-turation Individuelle Des Etablissement de Santé”(FIDES) in France [39] that will soon be
adapted to hospital stays, opens up the prospect of using such tools in real time.
This study has some limitations. It covers only seven epidemic events, integrating more years would reinforce the reliability of the model and provide better hindsight into the data analyses. Each year a predominant virus type may affect the clinical virulence and it would be interesting to take the virus type into consideration. In addition, other factors that could also be linked to epidemics have not been tested, including the behavioural variables such as mode of
transporta-tion, place and type of work, hand washing or immunization status of the individuals [40,41].
These elements, while difficult to collect, affect the spread of an epidemic and could reinforce the predictive accuracy of the proposed model at a population level rather than individual.
Conclusion
Acknowledgments
We thank all data producers: the French meteorological serviceMétéo France, The French
Sen-tinellesnetwork, and information departments of the University Hospital of Saint Etienne and the Firminy Hospital.
Author Contributions
Conceived and designed the experiments: RS MBH MS. Performed the experiments: RS MBH MS. Analyzed the data: RS MBH MS. Contributed reagents/materials/analysis tools: RS MBH MS. Wrote the paper: RS MBH MS.
References
1. Rapport Carli 2013_aval des urgences—Rapport_Carli_2013_aval_des_urgences.pdf. Available: http://www.sante.gouv.fr/IMG/pdf/Rapport_Carli_2013_aval_des_urgences.pdf
2. Altizer S, Ostfeld RS, Johnson PTJ, Kutz S, Harvell CD. Climate Change and Infectious Diseases: From Evidence to a Predictive Framework. Science. 2 août 2013; 341(6145):514‑9. doi:10.1126/ science.1239401PMID:23908230
3. Fleming DM, Elliot AJ. Lessons from 40 years’surveillance of influenza in England and Wales. Epide-miol Infect. 30 nov 2007. Available:http://www.journals.cambridge.org/abstract_S0950268807009910
4. Dao CN, Kamimoto L, Nowell M, Reingold A, Gershman K, Meek J, et al. Adult Hospitalizations for Lab-oratory‐Positive Influenza during the 2005–2006 through 2007–2008 Seasons in the United States. J Infect Dis. 15 sept 2010; 202(6):881‑8. doi:10.1086/655904PMID:20677944
5. Mertz D, Kim TH, Johnstone J, Lam P-P, Science M, Kuster SP, et al. Populations at risk for severe or complicated influenza illness: systematic review and meta-analysis. BMJ. 23 août 2013; 347(aug23 1): f5061‑f5061. doi:10.1136/bmj.f5061PMID:23974637
6. Zhou H, Thompson WW, Viboud CG, Ringholz CM, Cheng P-Y, Steiner C, et al. Hospitalizations Asso-ciated With Influenza and Respiratory Syncytial Virus in the United States, 1993–2008. Clin Infect Dis. 10 avr 2012; 54(10):1427‑36. doi:10.1093/cid/cis211PMID:22495079
7. Jhung MA, D’Mello T, Pérez A, Aragon D, Bennett NM, Cooper T, et al. Hospital-onset influenza hospi-talizations—United States, 2010–2011. Am J Infect Control. janv 2014; 42(1):7‑11. doi:10.1016/j.ajic. 2013.06.018PMID:24183534
8. Cannell JJ, Zasloff M, Garland CF, Scragg R, Giovannucci E. On the epidemiology of influenza. Virol J. 2008; 5(1):29.
9. Bresee J, Hayden FG. Epidemic Influenza—Responding to the Expected but Unpredictable. N Engl J Med. 2013; 368(7):589‑92. doi:10.1056/NEJMp1300375PMID:23343038
10. Cox NJ, Subbarao K. Global epidemiology of influenza: past and present. Annu Rev Med. 2000; 51
(1):407‑21.
11. Tong S, Li Y, Rivailler P, Conrardy C, Castillo DAA, Chen L-M, et al. A distinct lineage of influenza A virus from bats. Proc Natl Acad Sci. 27 févr 2012; 109(11):4269‑74. doi:10.1073/pnas.1116200109 PMID:22371588
12. Fouchier RAM, Munster V, Wallensten A, Bestebroer TM, Herfst S, Smith D, et al. Characterization of a Novel Influenza A Virus Hemagglutinin Subtype (H16) Obtained from Black-Headed Gulls. J Virol. 11 févr 2005; 79(5):2814‑22. PMID:15709000
13. Finkelman BS, Viboud C, Koelle K, Ferrari MJ, Bharti N, Grenfell BT. Global patterns in seasonal activ-ity of influenza A/H3N2, A/H1N1, and B from 1997 to 2005: viral coexistence and latitudinal gradients. PloS One. 2007; 2(12):e1296. PMID:18074020
14. Cannell JJ, Vieth R, Umhau JC, Holick MF, Grant WB, Madronich S, et al. Epidemic influenza and vita-min D. Epidemiol Infect. déc 2006; 134(6):1129‑40.
15. Beard JA, Bearden A, Striker R. Vitamin D and the anti-viral state. J Clin Virol. mars 2011; 50 (3):194‑200. doi:10.1016/j.jcv.2010.12.006PMID:21242105
16. Borella E, Nesher G, Israeli E, Shoenfeld Y. Vitamin D: a new anti-infective agent?: Vitamin D: a new anti-infective agent? Ann N Y Acad Sci. mai 2014; 1317(1):76‑83.
17. Lowen AC, Mubareka S, Steel J, Palese P. Influenza virus transmission is dependent on relative
humid-ity and temperature. PLoS Pathog. 19 oct 2007; 3(10):1470‑6. PMID:17953482
19. Shaman J, Pitzer V, Viboud C, Lipsitch M, Grenfell B. Absolute Humidity and the Seasonal Onset of Influenza in the Continental US. PLoS Curr. 18 déc 2009; 1:RRN1138.
20. Shaman J, Kohn M. Absolute humidity modulates influenza survival, transmission, and seasonality. Proc Natl Acad Sci. 2009; 106(9):3243‑8. doi:10.1073/pnas.0806852106PMID:19204283
21. Shaman J, Jeon CY, Giovannucci E, Lipsitch M. Shortcomings of Vitamin D-Based Model Simulations
of Seasonal Influenza. PLoS ONE. 3 juin 2011; 6(6):e20743. doi:10.1371/journal.pone.0020743PMID: 21677774
22. Shaman J, Karspeck A. Forecasting seasonal outbreaks of influenza. Proc Natl Acad Sci. 26 nov 2012;
109(50):20425‑30. doi:10.1073/pnas.1208772109PMID:23184969
23. Yaari R, Katriel G, Huppert A, Axelsen JB, Stone L. Modelling seasonal influenza: the role of weather and punctuated antigenic drift. J R Soc Interface. 15 mai 2013; 10(84):20130298‑20130298. doi:10. 1098/rsif.2013.0298PMID:23676899
24. Axelsen JB, Yaari R, Grenfell BT, Stone L. Multiannual forecasting of seasonal influenza dynamics reveals climatic and evolutionary drivers. Proc Natl Acad Sci. 2014; 111(26):9538‑42. doi:10.1073/ pnas.1321656111PMID:24979763
25. Insee—Département de La Loire (42)—Chiffres clés Évolution et structure de la population—2012. Available:http://www.insee.fr/fr/themes/tableau_local.asp?ref_id=POP&millesime=2012&typgeo= DEP&search=42
26. PREVISIONS METEO FRANCE—Site Officiel de Météo-France—Prévisions gratuitesà10 jours sur la France et le monde. Available:http://www.meteofrance.com/accueil
27. Réseau Sentinelles>France>Accueil. Available:https://websenti.u707.jussieu.fr/sentiweb/
28. Bulletin Officiel n°2001–13. Available:http://social-sante.gouv.fr/fichiers/bo/2001/01-13/a0130896.htm
29. - chainage_pluriannuel_maj_2013.pdf. Available:http://www.atih.sante.fr/sites/default/files/public/ content/1809/chainage_pluriannuel_maj_2013.pdf
30. Boyle JR, Sparks RS, Keijzers GB, Crilly JL, Lind JF, Ryan LM. Prediction and surveillance of influenza epidemics. Med J Aust. 21 févr 2011; 194(4):S28‑33.
31. Hufty A. Introductionàla climatologie: le rayonnement et la température, l’atmosphère, l’eau, le climat et l’activité humaine. Presses Université Laval; 2001. 596 p.
32. Husson F, Josse J, Pages J. Technical Report–Agrocampus.
33. McLachlan G. Discriminant Analysis and Statistical Pattern Recognition. John Wiley & Sons; 2004. 552 p.
34. Davies R, Johnson D, Farrow S. Planning Patient Care with a Markov Model. Oper Res Q 1970–1977. 1975; 26(3):599‑607.
35. van Noort SP, Águas R, Ballesteros S, Gomes MGM. The role of weather on the relation between influ-enza and influinflu-enza-like illness. J Theor Biol. avr 2012; 298:131‑7. doi:10.1016/j.jtbi.2011.12.020 PMID:22214751
36. Schanzer DL, Schwartz B. Impact of seasonal and pandemic influenza on emergency department vis-its, 2003–2010, Ontario, Canada. Acad Emerg Med Off J Soc Acad Emerg Med. avr 2013; 20(4):388– 97.
37. Juzeniene A, Ma L-W, Kwitniewski M, Polev GA, Lagunova Z, Dahlback A, et al. The seasonality of pandemic and non-pandemic influenzas: the roles of solar radiation and vitamin D. Int J Infect Dis. 2010; 14(12):e1099–105. doi:10.1016/j.ijid.2010.09.002PMID:21036090
38. Olson DR, Heffernan RT, Paladini M, Konty K, Weiss D, Mostashari F. Monitoring the impact of influ-enza by age: emergency department fever and respiratory complaint surveillance in New York City. PLoS Med. 2007; 4(8):e247. PMID:17683196
39. Le projet FIDES—Performance des établissements de santé - Ministère des Affaires sociales, de la Santé et des Droits des femmes. Available: http://social-sante.gouv.fr/professionnels/gerer-un- etablissement-de-sante-medico-social/performance-des-etablissements-de-sante/article/le-projet-fides
40. Garza RC, Basurto-Dávila R, Ortega-Sanchez IR, Carlino LO, Meltzer MI, Albalak R, et al. Effect of
Winter School Breaks on Influenza-like Illness, Argentina, 2005–2008. Emerg Infect Dis. juin 2013; 19 (6):938–44. doi:10.3201/eid1906.120916PMID:23735682
41. te Beest DE, van Boven M, Hooiveld M, van den Dool C, Wallinga J. Driving Factors of Influenza