ABAH BIOFLUX
Animal Biology & Animal Husbandry
International Journal of the Bioflux Society
Study on some milk production indices of
Romanian buffalo
1
Aurelia Coroian,
1Cristian O. Coroian,
2Dan C. Vodnar,
3Monica Trif,
1Vioara Mireşan,
1Camelia Răducu, and
1Stelian Dărăban
1University of Agricultural Sciences and Veterinary Medicine Cluj-Napoca, Faculty of Animal Husbandry and Biotechnology, Cluj-Napoca, Romania; 2University of Agricultural Sciences and Veterinary Medicine Cluj-Napoca,
Faculty of Agriculture, Cluj-Napoca, Romania;
3The German Institute of Food Technologies, Bremen, Germany. Corresponding author: coroian.aurelia@gmail.com
Abstract. This study evaluated the milk production performances of the Romanian dairy breed of buffaloes from three important areas of Sălaj county from north-western Romania. This county has one of the valuable buffalo herds from Romania. Comparative analysis in the direction of the main characteristics of buffalo milk production were conducted on a herd of 65 buffaloes exploited in extensive traditional conditions. In terms of milk production total lactation it ranks highest value in lactation VIII i.e. 1679.92 kg in area I, 1675.79 kg in lactation VI in area II, respectivelly 1442.53 kg in lactation VI in area III. Differences are less than 1% from normal lactation, with small variations from one lactation to another. These small differences between buffaloes and lactations emphasizes the use of buffaloes for other destinations (traction). The calving interval in buffaloes in this study presents the highest values i.e. 485.26 days in lactation VI, area I.
Key Words: buffaloes, milk, calving interval.
Introduction. Romanian buffalo has breeded in the current Romanian area of approximately 1,500 years. The origins of Romanian buffalo are indian wild buffalo Bubalus arni, respectively the domestic buffalo Bubalus microceros. Genetically and ecological Romanian buffalo belongs to river type buffalo, respectively Mediterranean buffalo (Velea et al 1983).
In 1987 has been officially recognized Romanian buffalo breed (homologated by professor Velea Constantin). The main directions in exploitation were milk and meat. The continuous process of high dairy animal selection and continuous increasing of buffalo livestock until around 228 000 heads in 1980 (OCP 2004) represented a very important phase of species evolution in Romania. In present, the livestock is about 20,000 heads, which represents only 9.1% from the highest value registered 30 years ago (ANARZ 2009).
Buffalo milk has a high content of fat: 7.2-9.9% with an average of 7.5%, total proteins: 3.8-4.5%, lactose: 4.1% and mineral salts: 0.7% (Moldoveanu et al 1973 cited by Bud 1984; Bud 1984).
Some Romanian buffalo herds have a variable percent of genetic amount from Murrah breed of buffaloes. Dairy production of this herds is higher comparing to the average production of Romanian buffalo (Velea & Margineanu 2006).
In the world, buffaloes have been contributing to about 12% of the world milk production and India is producing 60% of the world’s buffalo milk. India ranks first in terms of milk production in the world with a production of 100 million tonnes and buffalo milk contributes to more than 50% of the total milk produced in India (GOI 2006). About 57% of world buffalo population is in India and a growth rate of 1.26 % per year is seen in this decade in India (Prasad et al 2010).
Total duration of the lactation is a parameter which can provide useful information in dairy improvement process. In Romanian buffaloes the average duration of lactation has about 280 days (Velea & Margineanu 2006).
It is important to highlight the significance of the effect of calving year (CY) and calving season (CS) and their interraction. CS had a significant effect on calving interval (CI), with lowest values in rainy season, as also reported by (Mourad et al 1989) and (Bello 2003). CI is considered to be a good one when fits between 12 and 13 months (Shah et al 1991).
Udder and teat characteristics/measurements could be used as a reliable criteria in selection of buffaloes for milk production at the field level as was also opined by Lin et al (1987), Winter (1987) and Gajbhiye et al (2007) for cows that udder measurements could be reliable criteria while selecting cows for milk production. Regarding the reproductive traits, which are directly linked with dairy production, species comparisons showed that through all years and in all areas a significantly larger number of cows were inseminated in spring and summer relative to autumn and winter.
Material and Method. The study was conducted to characterize the main features of milk production in buffalo population bred in private farms from Salaj County, stating that investigations were conducted on three different growth areas: area I - Surduc and Brâglez - 23 heads; area II - Buciumi and Zalha - 20 heads, respectively area III - Cuzăplac and Almaș - 22 heads.
In order to characterize the direction of the main characteristics of buffalo milk production in the study were submitted a total of 65 buffaloes in eight lactations. Aims pursued following traits: milk quantity (kg) on total duration of lactation and normal lactation interval (in days), the percentage of fat in milk, calving interval (CI) dynamics and resting breast (RB) interval.
The biological material included in this study has registered in Official Control of Production (OCP). In terms of working methodology used to determine the direction of milk production skills, specific methods were used for official control of the milk production.
In all cases, obtained results were statistically processed and interpreted. In order to establish differences and their significance we used the Prism program.
Results and Discussion. Among the main indicators of milk production which have a major influence in quantitative production of milk is overall duration of lactation, showing lowest values in following lactations: 278.15 days in lactation III - area I, 287.38 days in lactation I - area II and 251.48 days in lactation II - area III (Figure 1). The range of variation in days of total lactation length is between 251.48 days in lactation II area III and a maximum of 352.34 days in lactation VI area II.
Lactation
295,82 341,28
281,24 283,72
287,59 278,15
297,53 280,45
302,89 310,75
352,34 311,49
287,68 320,71
318,19 287,38
278,11 280,66
297,12 282,91
280,88 258,16
251,48 260,18
0 100 200 300 400 500 600 700 800 900 1000
I II III IV V VI VII VIII
Area I Area II Area III
Figure 1. Total lactation length (in days).
The quantity of milk production on total lactation varied depending on the lactation of reference, namely: if the first area has the lowest value of 1210.72 kg in lactation I and the highest of 1679.92 kg in lactation VIII in area II, lowest value for lactation I is a quantity of 1450.35 kg in highest lactation VI to 1675.79 kg (Figure 2). The buffaloes from area III had the lowest value in milk quantity in total lactation V i.e. 1285.56 kg and the highest of 1442.53 kg in lactation VI.
Lactation
1679,92 1591,56
1572,81 1480,33
1357,17 1430,15
1355,21 1210,72
1657,19 1580,34
1675,79 1569,82
1462,46 1594,66
1516,29 1450,35
0 200 400 600 800 1000 1200 1400 1600 1800
I II III IV V VI VII VIII
Area I Area II Area III
Figure 2. Milk quantity in total lactation (kg).
Lactation
1454,19 1460,72
1355,18 1386,29
1295,54 1345,71
1280,63 1155,46
1546,31 1523,29
1432,71 1486,56
1535,17 1492,23
1365,66 1430,38
0 200 400 600 800 1000 1200 1400 1600 1800
I II III IV V VI VII VIII
Area I Area II Area III
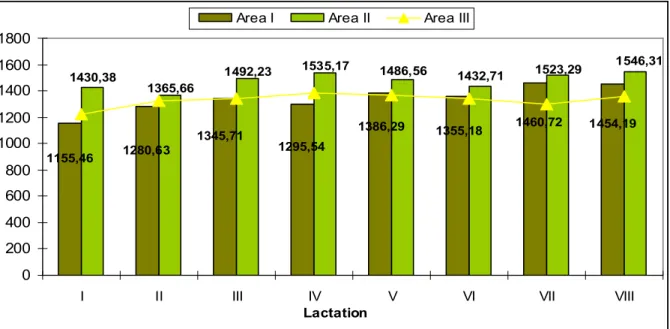
Figure 3. Milk quantity on normal lactation (kg).
Dynamics of normal lactation length is shown in Figure 4. Normal lactation has an increasing aspect with age. Buffaloes growing in age determine a longer period of lactation, although Cady et al (1983) reported that lactation length decreased with increase in parity in Nili Ravi buffaloes. Azfal et al (2007) presumed that lactation length did not differ among buffaloes of different parities in Nili Ravi buffaloes.
Lactation
291,33
271,61 279,66
268,45 278,32
285,19
270,35 265,24
302,15 295,38
293,56 290,62
287,59
279,45 285,32
281,17
240 250 260 270 280 290 300 310
I II III IV V VI VII VIII
230 240 250 260 270 280 290 Area I Area II Area III
Figure 4. Normal lactation length (days).
Calving intervals and milk production records of 1000 Nili Ravi buffaloes from the Okara Group of Government Farms were obtained. These farms are adjacent to each other under one management with total herd size of about 5000 milking buffaloes. The length of calving interval with the highest yearly income was defined as optimal. Losses due to the forced replacement were calculated by a model by Renkema & Stelwagen (1979) and Dijkhuizen et al (1985).
The first calving interval in Murrah and Nili Ravi buffaloes varies between 480-573 days (Singh & Barwal 2010). In Bhadawari buffaloes it was 525 days. Average calving interval (ACI) in Surti buffaloes was 462 days. Buffaloes continue to come in heat regularly in all months, highest being in October and lowest in April.
However, Singh & Barwal (2010) reported that around 75 percent of total calving took place during July to January (the most calving season) and 25 percent during February to June (the least calving season) suggesting that buffaloes are seasonal breeder. Buffaloes come in oestrus in cold month and are sub-fertile during hot month. Sub-fertility in the buffaloes it is also induced by poor nutrition.
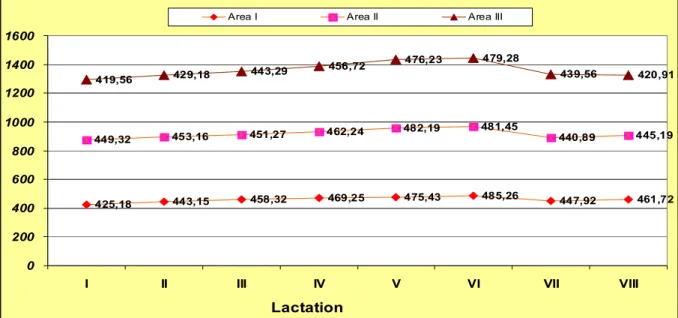
In the same time it is appropriate to highlight that if the total duration of lactation is positive, the interval between births is high, exceeding the duration of 485.26 days for buffaloes in the area I - lactation VI, 482.19 days for buffaloes in area II - lactation V, respectively 479.28 days - area III in lactation VI (Figure 5).
Lactation
425,18 443,15 458,32 469,25 475,43 485,26 447,92 461,72
449,32 453,16 451,27 462,24 482,19 481,45 440,89 445,19
419,56 429,18 443,29 456,72
476,23 479,28
439,56 420,91
0 200 400 600 800 1000 1200 1400 1600
I II III IV V VI VII VIII
Area I Area II Area III
Figure 5. Calving interval to buffaloes according to the areas (days).
The optimal CI for dairy buffaloes is found to be 12-13 months. The persistency of the lactation curve has a strong influence on the losses due to longer calving intervals as compared to change in milk prices (Shah et al 1991).
In the autumn season, which is usually hot and humid, the occurrence of estrus in the buffalo starts to increase sharply while in cows it is decreasing (Shah et al 1989). In general, our results are similar to those reported by other authors in similar conditions, indicating a strong seasonality in buffalo herds (Figure 5). Calving interval (CI) reflects reproductive or management problems, related with decisions in culling of unproductive animals.
The gestation period for buffaloes averages 308 to 318 days. The age of the heifer at her first calving is usually around 37-40 months (3 to 3.5 years). Calving interval is closely related to lactation length and milk yield. The longer the calving interval, the longer the lactation and the higher the lactation yield.
the fourth lactation whereafter it declines. The shape of the lactation curve depends on factors such as feed, management, milking frequency, diseases among others. The optimum lactation length in the Murrah has been reported to be 262 to 295 days (Högberg 2003).
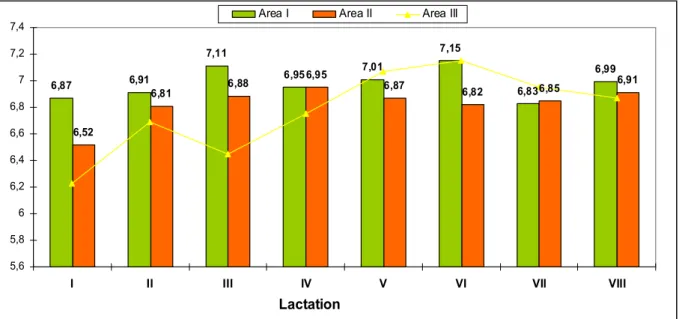
An interesting aspect is the milk fat content in the sense that its lowest point is observed to the herd of buffaloes from area III, 6.23% comparing to 6.52% in the area II and 6.83% in area I. The differences are due mainly to nutrition techniques, particularly structural changes in the ratio from one period to another. Graphical representation of the fat content according to lactation and the reference is shown in Figure 6. Fat content is quite low, the main causes are not of genetic origin, but mostly due to particular feeding technique and the fact that these buffaloes are used for traction purposes also.
Lactation
6,87 6,91
7,11
6,95 7,01
7,15
6,83
6,99
6,52
6,81 6,88
6,95
6,87 6,82 6,85 6,91
5,6 5,8 6 6,2 6,4 6,6 6,8 7 7,2 7,4
I II III IV V VI VII VIII
Area I Area II Area III
Figure 6. Buffalo milk fat content according to lactation and areas ().
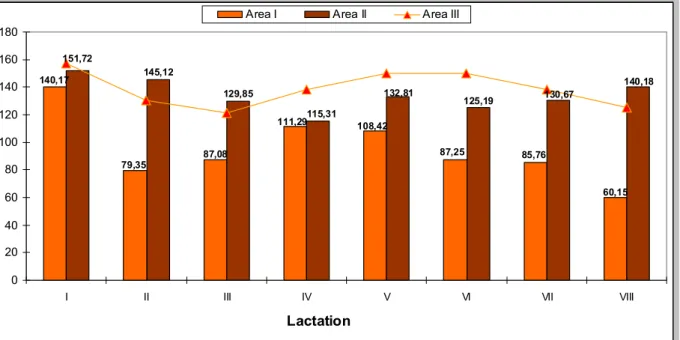
Resting breast (RB) is one of the most important indicator of dairy production. Shortening RB to a minimal value elongates the economical exploitation of dairy buffaloes. The shortest RB is present in area I and the highest in area III (Figure 7). On lactations, starting with second lactation RB is reduced to a minimal value which can be considered a good one (79.35 days in lactation II area I). In lactation VIII in area I the RB has a value of 60.15 days, statistically significant comparing with buffaloes from area II, respectively area III. In general has observed a shortening of RB after the second birth. Excepting area I, RB is above 100 days, considered too long even for traditional breeding system.
Conclusions. We believe that the total duration of lactation is normal and good. Alimentation is a major factor influencing the dairy production. Romanian buffalo alimentation in traditional breeding system has a lean energetic-protein ratio and low mineral intake during the whole year, which should be improved. There should be mentioned another factor which led to decreasing of milk production: traction usage of the buffaloes.
Calving interval has an average above 450 days (454.02 days), which is considered a normal one for Romanian buffalo. For optimal exploitation in dairy buffaloes it is recommended a shorter calving interval.
Lactation 151,72
60,15 85,76
87,25 108,42
111,29
87,08 79,35
140,17 145,12
129,85
115,31
132,81
125,19 130,67
140,18
0 20 40 60 80 100 120 140 160 180
I II III IV V VI VII VIII
Area I Area II Area III
Figure 7. Resting breast according to lactation and areas (days).
Resting breast has an average value of 122.54 days. Buffaloes from area I seemed to be selected for reproductive traits. For the buffaloes from area II and III resting breast should be included in an improvement process of selection, in order to reduce it.
A less positive aspect is the milk fat content which has the lowest percentage of fat by 6.23% for buffaloes in lactation I from area III and that also has a rather large individual variability. Alimentation technologies and energetic intake of fodder could raise up fat content of buffalo milk.
Because lately herds of buffaloes were sharply certain programs that are necessary to encourage farmers to protect the buffalo species by providing grants and subsidies should be encouraged. Salaj County still has a strong genetic variety of Romanian buffalo. For maintaining this livestock there are required special measurements and strong associations of buffaloes. The official control of production in buffaloes is done in a very low percentage of about 1%. In this case, genetic conservation of the Romanian buffaloes is needed.
Acknowledgements. Financial support has granted from Romanian Ministry of Education, Research and Innovation, project PN II-RU-TE No 108/2010.
References
Azfal M., Anwar M., Mirza M. A., 2007 Some factors affecting milk yield and lactation length in Nili ravi buffaloes. Pakistan Veterinary Journal 27(3):113-117.
Bello R., 2003 Factores no genéticos que afectan el intervalo entre partos y peso al destete en un rebaño de búfalos (Bubalus bubalus) en el estado Guárico. Tesis Ing. Agr. Mención Zootecnia. Facultad de Agronomía, Universidad Central de Venezuela 40 p.
Bud I., 1984 [Contributions to morphological characterization of buffalos in the north-western Transylvania. Summary of PhD Thesis], tipo Agronomia, Cluj-Napoca. [In Romanian]
Dijkhuizen A. A., Stelwagen J., Renkema J. A., 1985 Economic aspects of reproductive failure in dairy cattle. 1. Financial loss at farm level. Preventive Veterinary Medicine 3:251-263.
Gajbhiye A. R., Wanjari B. V., Chavan M. S., Jadhao S. G., Sahare T. Y., 2007 Udder measurements and its correlation with milk productivity in crossbred cattle. Indian Journal of Field Veterinarians 3:39-40.
Högberg M. S., 2003 Buffalo Milk Production - Chapter 2: Reproduction and Breeding, milkproduction.com.
Lin C. Y., Lee A. J., McAllister A. J., Batra T. R., Roy G. L., Vesely J. A., Wauthy J. M., Moldoveanu G., Dincă G., Georgescu G., Petrescu A., 1973 [Romanian Livestock - Cattle], Editura Academică, Bucharest. [In Romanian]
Mourad K. A., Khattab A. S., Ibrahim M. A. R., 1989 Effect of genetic and non-genetic factors on reproduction traits in Egyptian buffaloes. Buffalo Bulletin 8(1):9-12.
Prasad R. M. V., Sudhakar K., Raghava-Rao E., Ramesh B., 2010 Studies on the udder and teat morphology and their relationship with milk yield in Murrah buffaloes. Livestock Research for Rural Development 22(1):2010.
Renkema J. A., Stelwagen J., 1979 Economic evaluation of replacement rastes in dairy herds. Reduction of replacement rates through imorved health. Livestock Production Sciences 6:15-27.
Shah S., Hussain N., Dijkuizan A. A., Willemse A. H., van de Wiel D. F. M., 1991 Economic aspects of reproductive failure in dairy buffaloes of Pakistan. Preventive Veterinary Medicine 11:147-155.
Shah S., Hussain N., Van de Wiel D. F. M., Willemse A. H., Engel B., 1989 Opposite breeding season in Dairy Zebu Cows and Dairy River Buffaloes as assessed by the first insemination records. Animal Reproduction Science 21:25-35.
Singh C. V., Barwal R. S., 2010 Buffalo Breeding Research and Improvement Strategies in India. 9th World Buffalo Congress, The Buffalo in the World, Argentina, 2010. Velea C., Bud I., Tăpălagă A., 1983 [Buffalo Breeding], Editura Ceres, Bucharest. [In
Romanian]
Velea C., Marginean G., 2006 [News and perspective in raising buffaloes], Editura Agrotehnica, Bucharest. [In Romanian]
Winter K. A., 1987 Intercorrelations among milk production traits and body and udder measurements in Holstein heifers. Journal of Dairy Science 70:2385–2393.
*** WBC - 9th World Buffalo Congress, The Buffalo in the World, Argentina, 2010. *** Official Control of Productions, 2004 Buffalo Livestock.
*** ANARZ - National Agency for Reproduction and Selection in Animal Husbandry, Ministry of Agriculture and Rural Development, Romania. Annual Report 2009. *** GOI, 2006 Basic Animal Husbandry Statistics. Ministry of Agriculture. Department of
Animal Husbandry, Dairying and Fisheries Krishi Bhavan, New Delhi http://dahd.nic.in.
Received: 15 November 2010. Accepted: 10 December 2010. Published online: 11 December 2010. Authors:
Aurelia Coroian, University of Agricultural Sciences and Veterinary Medicine Cluj-Napoca, Faculty of Animal Husbandry and Biotechnology, 3-5 Mănăştur Street, 400372, Cluj-Napoca, Romania, e-mail:
coroian.aurelia@gmail.com
Cristian Ovidiu Coroian, University of Agricultural Sciences and Veterinary Medicine Cluj-Napoca, Faculty of Animal Husbandry and Biotechnology, 3-5 Mănăştur Street, 400372, Cluj-Napoca, Romania, e-mail: cristian_coroian@yahoo.com
Dan Cristian Vodnar, University of Agricultural Sciences and Veterinary Medicine Cluj-Napoca, Faculty of Agriculture 3-5 Mănăştur Street, 400372, Cluj-Napoca, Romania, e-mail: Vodnar_dan@yahoo.oo.uk
Monica Trif, The German Institute of Food Technologies, Hermann-Koehl Strasse 7, 28199 Bremen, Germany, e-mail: monica_trif@hotmail.com
Vioara Mireşan, University of Agricultural Sciences and Veterinary Medicine Cluj-Napoca, Faculty of Animal Husbandry and Biotechnology, 3-5 Mănăştur Street, 400372, Cluj-Napoca, Romania, e-mail:
vmiresan@usamvcluj.ro
Camelia Răducu, University of Agricultural Sciences and Veterinary Medicine Cluj-Napoca, Faculty of Animal Husbandry and Biotechnology, 3-5 Mănăştur Street, 400372, Cluj-Napoca, Romania, e-mail:
craducu2001@yahoo.com How to cite this article: