Iron Metabolism and Related Mechanism
Shu-yang Yu1, Li Sun1, Zhuo Liu1, Xi-yan Huang1, Li-jun Zuo1, Chen-jie Cao1, Wei Zhang1*,
Xiao-min Wang2
1Department of Neurology, Beijing Tiantan Hospital, Capital Medical University, Beijing, China,2Department of Physiology, Capital Medical University, Beijing, China
Abstract
Objective:To investigate clinical features, iron metabolism and neuroinflammation in Parkinson’s disease (PD) patients with sleep disorders (SD).
Methods: 211 PD patients were evaluated by Pittsburgh Sleep Quality Index (PSQI) and a body of scales for motor symptoms and non-motor symptoms. 94 blood and 38 cerebral spinal fluid (CSF) samples were collected and iron and its metabolism-relating proteins, neuroinflammatory factors were detected and analyzed.
Results:136 cases (64.5%) of PD patients were accompanied by SD. Factor with the highest score in PSQI was daytime dysfunction. Depression, restless leg syndrome, autonomic symptoms and fatigue contributed 68.6% of the variance of PSQI score. Transferrin level in serum and tumor necrosis factor–a level in CSF decreased, and the levels of iron, transferrin, lactoferrin and prostaglandin E2 in CSF increased in PD patients with SD compared with those without SD. In CSF,
prostaglandin E2level was positively correlated with the levels of transferrin and lactoferrin, and tumor necrosis factor–a
level was negatively correlated with the levels of iron, transferrin and lactoferrin in CSF.
Conclusions:Depression, restless leg syndrome, autonomic disorders and fatigue are the important contributors for the poor sleep in PD patients. Abnormal iron metabolism may cause excessive iron deposition in brain and be related to SD in PD patients through dual potential mechanisms, including neuroinflammation by activating microglia and neurotoxicity by targeting neurons. Hence, inhibition of iron deposition-related neuroinflammation and neurotoxicity may cast a new light for drug development for SD in PD patients.
Citation:Yu S-y, Sun L, Liu Z, Huang X-y, Zuo L-j, et al. (2013) Sleep Disorders in Parkinson’s Disease: Clinical Features, Iron Metabolism and Related Mechanism. PLoS ONE 8(12): e82924. doi:10.1371/journal.pone.0082924
Editor:Oscar Arias-Carrion, Hospital General Dr. Manuel Gea Gonza´lez, Mexico
ReceivedJuly 2, 2013;AcceptedOctober 30, 2013;PublishedDecember 23, 2013
Copyright:ß2013 Yu et al. This is an open-access article distributed under the terms of the Creative Commons Attribution License, which permits unrestricted use, distribution, and reproduction in any medium, provided the original author and source are credited.
Funding:This work was supported by the National Basic Research Program of China (2011CB504100, http://www.973.gov.cn/AreaAppl.aspx), the National Natural Science Foundation of China (81071015, http://www.nsfc.gov.cn/Portal0/default152.htm), High Level Technical Personnel Training Project of Beijing Health System (2009-3-26, http://www.bjwsrc.org/hhrnew/), Capital Clinical Characteristic Application Research (Z121107001012161, http://www.bjkw.gov.cn/ n8785584/index.html), the National Natural Science Foundation of China (81030062, http://www.nsfc.gov.cn/Portal0/default152.htm), and Basic-Clinical Research Cooperation Funding of Capital Medical University (10JL49, http://www.ccmu.edu.cn/). The funders had no role in study design, data collection and analysis, decision to publish, or preparation of the manuscript.
Competing Interests:The authors have declared that no competing interests exist. * E-mail: [email protected]
Introduction
Sleep disorders (SD) is one of the most common and incapacitating non-motor symptoms in Parkinson’s disease (PD), with an estimated prevalence of 50% [1], and is recognized as an important independent determinant for impaired activity of daily living and quality of life [2]. However, clinical features of SD, particularly the relationship of SD with motor symptoms and other non-motor symptoms are not profoundly recognized yet. More-over, few investigations focused on the potential etiology and underlying mechanisms of SD in PD patients.
Increasing pathological and autopsy studies on PD patients observed an excessive iron deposition in substantia nigra, which might be caused by iron metabolism dysfunction due to gene mutations involving iron metabolism-relating proteins [3] or excessive iron uptake [4]. Deposited iron in substantia nigra of PD brain was demonstrated to induce progressive dopaminergic
neurodegeneration, and propagate motor symptoms through neuroinflammatory mechanism [5]. Neuroinflammatory mecha-nism characterized by microglia activation plays an important role in PD,leading to progressive degeneration and death of dopami-nergic neurons in substantia nigra. However, what role it plays in SD of PD is not clear yet. The questions raised here are whether iron deposition is a potential etiology of PD-SD, and whether neuroinflammation is the underlying mechanism of PD-SD? These issues almost haven’t been studied before and remain enigmas yet.
Methods
Subjects
211 PD patients were consecutively recruited from the Department of Neurology, Beijing Tiantan Hospital, Capital Medical University from April 2010 to April 2012. PD was diagnosed according to UK Parkinson’s Disease Society Brain Bank [6].
Among 211 PD patients, 112 cases (53.1%) were male and 90 cases (46.9%) were female; patients’ age were 35–85 years with an average of 60.2 years; disease duration was from one month to 26 years with an average of 2.0 years. All PD patients were evaluated by Pittsburgh Sleep Quality Index (PSQI), and recruited in SD group (with PSQI$5 points) and NSD (with no SD) groups (PSQI,5 points), respectively.
Ethics Statement
This study was approved by Beijing Tiantan Hospital review board. Written informed consents were obtained from all participants in this study.
Assessments of Clinical Features
Motor symptoms and motor complications. Motor symp-toms in SD and NSD groups was evaluated by the Unified Parkinson’s Disease Rating Scale III, Hohen and Yahr Stage and Modified Webster Scale. Motor complications were assessed by Unified Parkinson’s Disease Rating Scale IV and Wearing –Off Scale.
Non-motor symptoms. Non-motor symptoms were screened by Non-motor Symptoms Quest followed by series of scales, including Montreal Cognitive Assessment and Mini-Mental State Examination for cognitive impairment, Hamilton Depres-sion Scale -24 items for depresDepres-sion, Hamilton Anxiety Scale -14 items for anxiety, The Scale For Outcomes in PD For Autonomic Symptoms for autonomic dysfunction, Restless Leg Syndrome Rating Scale for restless leg symptom and Fatigue Sale-14 items for fatigue.
Sample Collections
Blood sample collection. Anti-parkinsonian drugs were stopped for 12–14 hours if patients’ condition allowed. 3 ml blood was taken under fasting condition, followed by being centrifuged in 4uC at 3000 r/min for 10 minutes. Supernatant was preserved at280uC for detection.
Cerebrospinal fluid sample collection. Procedure was the same as 3.1 blood sample collection except that 3 ml cerebrospinal fluid was collected through lumbar puncture.
Detection of Iron and its Metabolism-relating Proteins Iron and its metabolism-relating proteins, including transferrin, lactoferrin and ferritin in serum and CSF from PD patients were detected by Enzyme Linked Immunosorbent Assay. Ab83366 kit for iron, Ab108837 kit for ferritin and Ab108911 kit for transferrin were all from Abcam Company (British). E01L0224 kit for lactoferrin was from Shanghai Lanji Biological Limited Company (China).
Detection of Neuroinflammatory Factors
Tumor necrosis factor-a, interleukin-1b and prostaglandin E2. Tumor necrosis factor-a, interleukin-1b
and prostaglandin E2in serum and CSF from PD patients were detected by enzyme linked immunosorbent assay. 1R350 kit for tumor necrosis factor-a and 1R040 kit for interleukin-1b were
both from Rapidbio Company (USA). CSB-E07965h kit for prostaglandin E2was from Cusabio Company (China).
Hydrogen peroxide. Hydrogen peroxide in serum and CSF from PD patients were detected by chemical colorimetric method. A064 kit was from Nanjing Jiancheng Biological Engineering Research Institute (China).
Nitric oxide. Nitric oxide in serum and CSF from PD patients were detected by chemical colorimetric method. A012 kit was from Nanjing Jiancheng Biological Engineering Research Institute (China).
Data Analyses
Statistical analyses were performed with SPSS Statistics 20.0 (IBM Corporation, New York, USA). Demographic information, disease features, motor symptoms, motor complications, non-motor symptoms, biochemical factors in serum and CSF were compared between SD and NSD groups. Multiple linear analyses were performed between SD and related factors. Spearman correlation analyses were made among biochemical factors. Continuous variables were presented as means 6 standard deviations and compared by 2-tailed T test if they were normally distributed, and presented as median (quartile) and compared by nonparametric test if they were not normally distributed. Discrete variables were compared by Chi square test. Bonferroni correction was performed in the assessment of clinical symptoms. We selected 12 factors that might affect sleep as independent variables (sex, age, age of onset, educational level, disease duration, onset lateralization, clinical phenotype, motor symptoms, motor com-plications, autonomic dysfunction, abnormal sensory disorders and neuropsychiatric symptoms), and found that the corrected P value was significant when it was less than 0.004. In the detection of biochemical factors, P value was significant when it was less than 0.05.
Results
Incidence of SD in PD Patients
136 of 211 (64.5%) PD patients had SD, among them, 32 cases(15.2%)had SD before motor symptoms.
Assessment of Sleep Status of PD Patients
The average scores of PSQI and its seven factors were compared between SD and NSD groups (Table 1). Daytime dysfunction ranked the top of PSQI, followed by sleep distur-bances and sleep latency. Seven factors of PSQI were all significantly impaired in SD group.
Comparisons of Demographics Information, Disease Features and Non-motor Symptoms between SD and NSD Groups
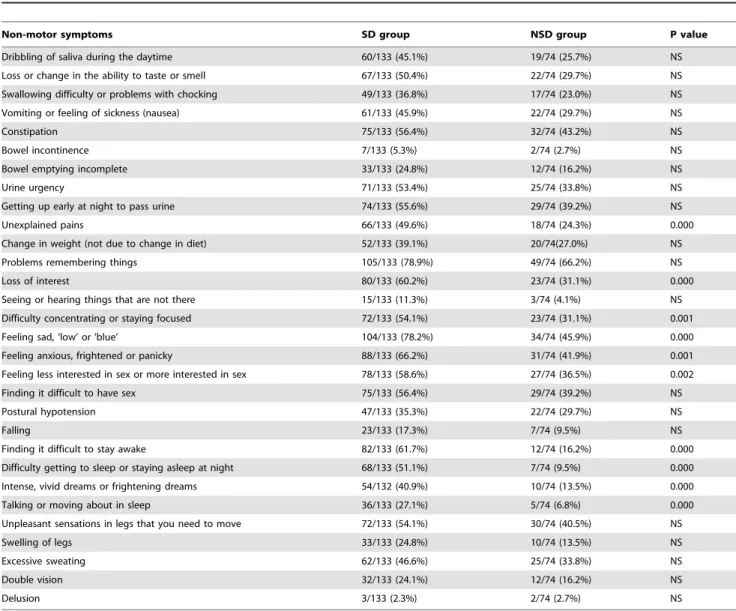
Demographics information, disease features and non-motor symptoms were compared between SD and NSD groups (Table 2, 3). Results showed that SD group had significantly more severe motor symptoms and more non-motor symptoms than NSD group. The incidences of psychiatric symptoms (loss of interest, difficulty concentrating or staying focused, feeling sad, feeling anxious, frightened or panicky, feeling less interested in sex or more interested in sex) and abnormal sensory (unexplained pains) were increased in NSD group.
Related Factors of SD in PD Patients
disease duration, numbers of non-motor symptoms, scores of scales for motor symptoms, motor complications and non-motor symptoms) (Table 4). Results revealed that depression, restless leg symptom,autonomic dysfunction and fatigue significantly influenced PSQI score, which explained 68.6% variance of total PSQI score.
Levels of Iron and its Metabolism-relating Proteins The levels of iron, transferrin, lactoferrin and ferrtin in serum and CSF were compared between SD and NSD groups (Table 5). Data showed that transferrin level in serum decreased and the levels of iron, transferrin and lactoferrin in CSF increased in SD group.
Levels of Neuroinflammatory Factors and their
Correlations with the Levels of Iron and its Metabolism-relating Proteins
The levels of neuroinflammatory factors, including tumor necrosis factor-a, prostaglandin E2, interleukin-1b, hydrogen peroxide and nitric oxide in serum and CSF were compared between SD and NSD groups (Table 5). An elevated PGE2level in CSF was found in SD group compared with NSD group. Further analyses demonstrated positive correlations between the levels of prostaglandin E2 and transferrin (r = 0.335, P = 0.009), prostaglandin E2and lactoferrin (r = 0.290, P = 0.026) in CSF. A declined tumor necrosis factor-a level in CSF was found in SD group compared with NSD group. Subsequent analyses indicated negative correlations between the levels of tumor necrosis factor-a and iron (r =20.421, P = 0.001), tumor necrosis factor-a and
Table 1.Pittsburgh Sleep Quality Index and its seven factors in SD group and NSD group.
Pittsburgh Sleep Quality Index Total PD SD group NSD group P value
(Mean) [Median(quartile)] [Median(quartile)]
Sleep quality 1.2 1.0 (1.0,2.0) 1.0 (0.0,1.0) 0.000
Sleep latency 1.2 2.0 (1.0,3.0) 0.0 (0.0,1.0) 0.000
Sleep duration 0.8 1.0 (0.0,2.0) 0.0 (0.0,0.0) 0.000
Habitual sleep efficiency 0.8 1.0 (0.0,2.0) 0.0 (0.0,0.0) 0.000
Sleep disturbances 1.3 1.0 (1.0,2.0) 1.0 (1.0,1.0) 0.000
Use of sleeping medication 0.4 0.0 (0.0,0.8) 0.0 (0.0,0.0) 0.000
Daytime dysfunction 1.6 2.0 (1.0,3.0) 1.0 (0.0,1.0) 0.000
SD: sleep disorders; NSD: no sleep disorders. doi:10.1371/journal.pone.0082924.t001
Table 2.Demographics information, disease features in SD group and NSD group.
SD group NSD group P value
Female/Total [case/total (%)] 72/136 (52.9%) 40/75 (53.3%) NS
Age [median (quartile)] 60.0 (4.0,67.0) 60.0 (52.3,68.0) NS
Educational level NS
Primary school and below [case/total (%)] 52/136 (38.2%) 20/75 (26.7%) Middle and high school [case/total (%)] 65/136 (47.8%) 34/75 (45.3%) Bachelor and above [case/total (%)] 19/136 (14.0%) 21/75 (28.0%)
Age of onset (years, mean6SD) 56.669.8 56.5611.1 NS
Disease duration [median (quartile)] 2.0 (1.0,4.5) 3.0(1.0,5.8) NS
Onset lateralization NS
Lest side [case/total (%)] 60/123 (48.8%) 29/66 (43.9%)
Right side [case/total (%)] 55/123 (44.7%) 30/66 (45.5%)
Both sides [case/total (%)] 8/123 (6.5%) 7/66 (10.6%)
Clinical phenotype NS
Tremor type [case/total (%)] 10/99 (10.1%) 6/46 (13.0%)
Rigidity-bradykinesia type [case/total (%)] 20/99 (20.2%) 4/46 (8.7%)
Mixed type [case/total (%)] 69/99 (69.7%) 36/46 (78.3%)
Unified Parkinson’s Disease Rating Scale III [median (quartile)] 26.0(18.0,35.0) 21.0(13.5,30.0) 0.001
Unified Parkinson’s Disease Rating Scale IV [median (quartile)] 0(0,3.0) 0(0,2.0) NS
Numbers of non-motor symptoms [median (quartile)] 13.0(10.0,16.8) 7.0(4.0,10.0) 0.000
transferrin (r =20.777, P = 0.000), tumor necrosis factor-a and lactoferrin (r =20.509, P = 0.000) in CSF.
Discussion
In this investigation, SD incidence reached to 64.5%, demon-strating that SD was a very common non-motor symptom in PD
patients. The scores of seven factors of PSQI in SD group were significantly higher than that in NSD group (Table 1), illustrating that all these aspects were dramatically impaired. Daytime dysfunction, ranking the top of PSQI, might be related to poor nocturnal sleep, disease progression and daily L-dopa dose [7]. Sleep disturbances ranked the second place, affecting 74%–88% PD patients [8]. Sleep disturbances can be induced by impaired
Table 3.Incidences of non-motor symptoms in SD group and NSD group [case/total (%)].
Non-motor symptoms SD group NSD group P value
Dribbling of saliva during the daytime 60/133 (45.1%) 19/74 (25.7%) NS Loss or change in the ability to taste or smell 67/133 (50.4%) 22/74 (29.7%) NS Swallowing difficulty or problems with chocking 49/133 (36.8%) 17/74 (23.0%) NS Vomiting or feeling of sickness (nausea) 61/133 (45.9%) 22/74 (29.7%) NS
Constipation 75/133 (56.4%) 32/74 (43.2%) NS
Bowel incontinence 7/133 (5.3%) 2/74 (2.7%) NS
Bowel emptying incomplete 33/133 (24.8%) 12/74 (16.2%) NS
Urine urgency 71/133 (53.4%) 25/74 (33.8%) NS
Getting up early at night to pass urine 74/133 (55.6%) 29/74 (39.2%) NS
Unexplained pains 66/133 (49.6%) 18/74 (24.3%) 0.000
Change in weight (not due to change in diet) 52/133 (39.1%) 20/74(27.0%) NS
Problems remembering things 105/133 (78.9%) 49/74 (66.2%) NS
Loss of interest 80/133 (60.2%) 23/74 (31.1%) 0.000
Seeing or hearing things that are not there 15/133 (11.3%) 3/74 (4.1%) NS Difficulty concentrating or staying focused 72/133 (54.1%) 23/74 (31.1%) 0.001
Feeling sad, ‘low’ or ‘blue’ 104/133 (78.2%) 34/74 (45.9%) 0.000
Feeling anxious, frightened or panicky 88/133 (66.2%) 31/74 (41.9%) 0.001 Feeling less interested in sex or more interested in sex 78/133 (58.6%) 27/74 (36.5%) 0.002
Finding it difficult to have sex 75/133 (56.4%) 29/74 (39.2%) NS
Postural hypotension 47/133 (35.3%) 22/74 (29.7%) NS
Falling 23/133 (17.3%) 7/74 (9.5%) NS
Finding it difficult to stay awake 82/133 (61.7%) 12/74 (16.2%) 0.000 Difficulty getting to sleep or staying asleep at night 68/133 (51.1%) 7/74 (9.5%) 0.000 Intense, vivid dreams or frightening dreams 54/132 (40.9%) 10/74 (13.5%) 0.000
Talking or moving about in sleep 36/133 (27.1%) 5/74 (6.8%) 0.000
Unpleasant sensations in legs that you need to move 72/133 (54.1%) 30/74 (40.5%) NS
Swelling of legs 33/133 (24.8%) 10/74 (13.5%) NS
Excessive sweating 62/133 (46.6%) 25/74 (33.8%) NS
Double vision 32/133 (24.1%) 12/74 (16.2%) NS
Delusion 3/133 (2.3%) 2/74 (2.7%) NS
SD: sleep disorders; NSD: no sleep disorders; NS: not significant, P.0.004. doi:10.1371/journal.pone.0082924.t003
Table 4.Multiple linear regression analysis between SD and related factors.
Factors related to Pittsburgh Sleep Quality Index b P gR
2 Adjusted R2
Hamilton Depression Scale 0.227 0.000 0.467 0.453
Restless Leg Syndrome Rating Scale 0.205 0.001 0.593 0.571
The Scale For Outcomes in PD For Autonomic Symptoms 0.223 0.002 0.649 0.620
Fatigue Sale-14 items 20.489 0.006 0.718 0.686
SD: sleep disorders.
thalamocortical arousal system, degeneration of sleep-wakefulness regulatory centers in brainstem, motor symptoms, non-motor symptoms and dopaminergic medication, which may coexist and amplify the effect of each other during SD progression [9]. Sleep latency was in the third place, indicating less impairment in falling sleep than sleep disturbances which was supported by other studies [10]. Sleep duration and habitual sleep efficiency also declined in SD group. Sleep quality was barely acceptable and poor in PD patients with SD. The frequency of taking sleep pills in PD patients in this study was less than once a week, indicating an insufficient therapy for SD in PD patients.
Comparison of demographic information displayed no signifi-cant difference in sex, age, age of onset and educational level (Table 2) between SD and NSD groups, demonstrating that demographic information was not related to PD-SD. Onset lateralization, disease duration and clinical phenotype were not different between SD and NSD groups, consistent with the previously published data [11,12]. It was motor symptoms evaluated by UPDRS III score but not motor complications assessed by UPDRS IV score impaired the sleep strikingly (Table 2).
We found more non-motor symptoms in SD group than NSD group (Table 2). The incidences of non-motor symptoms, such as psychiatric symptoms and abnormal sensory in SD group were all significantly higher than NSD group (Table 3). However, the incidence of autonomic dysfunction, was not significantly different between the two groups, which might be because that autonomic dysfunction presented earlier than SD according to Braak stage [13]. Other symptoms showed no significant difference between the two groups, e.g. hallucination, delusion, falling, diplopia and body weight change, etc, which are generally common in the later
stage of PD and occur after SD, and thus they might not play causative role in PD-SD. Multiple linear regressions analysis indicated that non-motor symptoms were more pivotal than motor symptoms or motor complications for PD-SD (Table 4).
Pathology and autopsy studies observed excessive iron deposi-tion in substantia nigra, with total iron elevated by 25% to 100% and iron ions by 225% [14,15]. Peripheral iron is transferred into brain through blood-brain barrier. In brain, capillary endothelial cells absorb iron-bound transferrin from blood via receptor-mediated endocytosis. Iron then is released from endosome into interstitial fluid by iron exporter ferroportin [16]. Iron in brain interstitium may bind to large molecules, such as transferrin or lactoferrin, and then is transported into neurons by related receptors. Excessive intake of exogenous iron [17], gene mutation of iron metabolism-relating proteins [3] and blood-brain barrier impairment [18] may induce redundant iron deposition in the brain. Studies on iron and PD-SD patients mainly focused on restless leg symptom [19,20],and found that iron deposition in substantia nigra was negatively correlated with restless leg symptom. Presently, no exploration has been conducted between iron metabolism and PD-SD assessed by PSQI.
Here, we found that iron level in CSF in PD-SD group was dramatically elevated compared with PD-NSD group (Table 5), implying an excessive iron deposition in brain. The level of lactoferrin in CSF in PD-SD group was obviously enhanced compared with PD-NSD group, suggesting an abnormal iron metabolism in brain. Iron level in serum in PD-SD group wasn’t different with PD-NSD group, indicating that elevated iron in brain wasn’t resulted from iron elevation in the peripheral system. Transferrin level in serum was significantly decreased, reflecting that the enhanced brain iron might due to the translocation of
Table 5.Levels of iron and its metabolism-relating proteins, and neuroinflammatory factors in serum and cerebral spinal fluid in SD group and NSD group.
Serum NSD group (64 cases) SD group (31 cases) P value
Iron (nmol) 2.98861.537 3.22161.460 NS
Transferrin (ug/ml) 1.590 (0.124,4.761) 0.095 (0.065,4.450) 0.041
Lactoferrin (ug/ml) 61.430 (51.594,88.021) 62.384 (45.202,90.399) NS
Ferrtin (ng/ml) 8.951 (6.143,13.855) 9.223 (6.646,14.068) NS
Tumor necrosis factor-a(pg/ml) 63.317 (49.430,68.023) 64.884 (52.813,74.446) NS
Prostaglandin E2(pg/ml) 8.145 (4.457,14.021) 5.619 (3.763,10.770) NS
Interleukin-1b(pg/ml) 8.480 (5.471,74.171) 12.042 (6.154,165.780) NS
Hydrogen peroxide (mmol/l) 28.882 (23.938,35.316) 28.025 (24.593,30.312) NS
Nitric oxide (mmol/l) 44.851628.426 52.784629.106 NS
Cerebral spinal fluid NSD group (12 cases) SD group (26 cases) P value
Iron (nmol) 0.357 (0.280,0. 393) 0.496 (0.322,0.579) 0.004
Transferrin (ug/ml) 0.152 (0.139,0.281) 0.301(0.154,0.363) 0.041
Lactoferrin (ug/ml) 118.885646.098 171.359645.357 0.002
Ferrtin (ng/ml) 3.766 (3.091,12.667) 11.756 (2.356,16.023) NS
Tumor necrosis factor-a(pg/ml) 515.147(482.967,636.290) 45.700 (32.809,479.859) 0.001
Prostaglandin E2 (pg/ml) 5.142 (4.643,5.767) 6.074 (4.363,11.273) 0.022
Interleukin-1b(pg/ml) 9.026 (6.296,76.186) 27.702 (8.576,165.393) NS
Hydrogen peroxide (mmol/l) 1.973 (1.349,2.368) 1.973 (1.432,2.106) NS
Nitric oxide (mmol/l) 56.705620.705 53.793628.746 NS
transferrin from peripheral system to central system, a process that highly contributed to iron accumulation in brain. Hence, abnormal iron metabolism in brain might cause iron overload and be related to PD-SD.
Mesocorticolimbic dopamine system, a part of thalamocortical arousal system, which is originated from ventral tegmental area and innervates to thalamus and hippocampus [21,22]. Dysfunc-tion of mesocorticolimbic dopamine system is featured by a lack of normal rhythms during night time and an excessive sleepiness during daytime [23], indicating a key role of dopamine system in sleep control, specifically in wakefulness maintainance and sleep regulation. Iron often deposit in the areas containing the cells enriched in dopamine, such as substantia nigra, and the fibers innervated from dopaminergic neurons, such as mesocorticolimbic dopamine system [21], which might be relevant to PD-SD. Moreover, Lewy bodies were observed in the sleep-regulating centers [21], including locus coeruleus, raphe dorsal, laterodorsal tegmental nucleus/pedunculopontine tegmental nucleus, tubero-mammillary nucleus and ventrolateral preoptic nucleus [24],with PD pathology progression [25] and meanwhile, iron was found inside Lewy bodies in above sleep-regulating centers [26], which implied that iron might be relevant to PD-SD. Therefore, inhibition of iron deposition might serve as a target for PD-SD therapy.
Compared with PD-NSD group, prostaglandin E2level in PD-SD group was significantly elevated in CSF but not in serum, indicating a potential role of neuroinflammation in the brain of PD patient with SD. A study revealed that prostaglandin E2 was elicited by insufficient sleep [27]. Elevated prostaglandin E2might propagate the deterioration of PD-SD, which might induce further release of PGE2, forming a vicious cycle for PD-SD progression.
Tumor necrosis factor-a level in CSF in PD-SD group was strikingly declined compared with PD-NSD group. However, tumor necrosis factor-a level in serum in PD-SD group wasn’t prominently different with PD-NSD group. It was found that tumor necrosis factor-a was linked to sleep promotion [24]. Administration of exogenous tumor necrosis factor-a increased slow wave sleeps and inhibition of tumor necrosis factor-a significantly reduced sleep amount [24]. Thus, the decreased tumor necrosis factor-alevel in CSF was relevant to PD-SD due to its less sleep-promoting effect.
Although interleukin-1bwas thought to be linked to sleep [24], we observed no differences in the levels of interleukin-1bas well as nitric oxide and hydrogen peroxide in both serum and CSF between SD and NSD groups, indicating that they were not the potential indicators for PD-SD.
Further analysis showed significant positive correlations be-tween the levels of prostaglandin E2 and transferrin (r = 0.335, P = 0.009), and the levels of prostaglandin E2 and lactoferrin (r = 0.290, P = 0.026) in CSF, indicating iron overload might be relevant to PD-SD by inducing neuroinflammation [28,29]. Additionally, we found negative correlations between the levels of tumor necrosis factor-aand iron (r =20.421, P = 0.001), tumor necrosis factor-a and transferrin (r =20.777, P = 0.000), tumor necrosis factor-a and lactoferrin (r =20.509, P = 0.000) in CSF. Although tumor necrosis factor-a was produced by catalyzing intracellular reactive oxygen species in alveolar macrophages [[28,29], we failed to find that iron increased the level of tumor necrosis factor-a, suggesting that iron might cause direct neurotoxicity instead of activating microglia and producing tumor necrosis factor-a. Neuroinflammatory factors detected here showed different patterns of production, which reasons remain unclear yet and need to be figured out in the near future.
In summary, PD patients have high SD incidences. Depression, restless leg symptom, autonomic dysfunction and fatigue are the main contributors for PD-SD. we for the first time find that abnormal iron metabolism may cause iron deposition in brain and be related to PD-SD through dual mechanisms of neuroinflamma-tion by activating microglia and neurotoxicity by targeting neurons. Hence, inhibition of excessive iron deposition-induced neuroinflammation [30,31] and neurotoxicity may cast a new light for drug development for PD-SD.
Acknowledgments
We thank Ms Run-hua Zhang for giving help in statistics analysis and Dr. Yang Hu for providing advice for English writing.
Author Contributions
Conceived and designed the experiments: WZ XW. Performed the experiments: SY LS ZL XH LZ CC. Analyzed the data: SY. Wrote the paper: SY WZ.
References
1. Riedel O, Klotsche J, Spottke A, Deuschl G, Forstl H, et al. (2010) Frequency of dementia, depression, and other neuropsychiatric symptoms in 1,449 outpatients with Parkinson’s disease. J Neurol 257: 1073–1082.
2. Scaravilli T, Gasparoli E, Rinaldi F, Polesello G, Bracco F (2003) Health-related quality of life and sleep disorders in Parkinson’s disease. Neurol Sci 24: 209–210. 3. Borie C, Gasparini F, Verpillat P, Bonnet AM, Agid Y, et al. (2002) Association study between iron-related genes polymorphisms and Parkinson’s disease. J Neurol 249: 801–804.
4. Salazar J, Mena N, Hunot S, Prigent A, Alvarez-Fischer D, et al. (2008) Divalent metal transporter 1 (DMT1) contributes to neurodegeneration in animal models of Parkinson’s disease. Proc Natl Acad Sci U S A 105: 18578–18583. 5. Sian-Hulsmann J, Mandel S, Youdim MB, Riederer P (2011) The relevance of
iron in the pathogenesis of Parkinson’s disease. J Neurochem 118: 939–957. 6. Hughes AJ, Daniel SE, Kilford L, Lees AJ (1992) Accuracy of clinical diagnosis
of idiopathic Parkinson’s disease: a clinico-pathological study of 100 cases. J Neurol Neurosurg Psychiatry 55: 181–184.
7. Kaynak D, Kiziltan G, Kaynak H, Benbir G, Uysal O (2005) Sleep and sleepiness in patients with Parkinson’s disease before and after dopaminergic treatment. Eur J Neurol 12: 199–207.
8. Menza M, Dobkin RD, Marin H, Bienfait K (2010) Sleep disturbances in Parkinson’s disease. Mov Disord 25 Suppl 1: S117–122.
9. Suzuki K, Miyamoto M, Miyamoto T, Iwanami M, Sakuta H, et al. (2012) [Sleep disturbances in patients with Parkinson disease]. Brain Nerve 64: 342– 355.
10. Tandberg E, Larsen JP, Karlsen K (1998) A community-based study of sleep disorders in patients with Parkinson’s disease. Mov Disord 13: 895–899.
11. Boddy F, Rowan EN, Lett D, O’Brien JT, McKeith IG, et al. (2007) Subjectively reported sleep quality and excessive daytime somnolence in Parkinson’s disease with and without dementia, dementia with Lewy bodies and Alzheimer’s disease. Int J Geriatr Psychiatry 22: 529–535.
12. Pal PK, Thennarasu K, Fleming J, Schulzer M, Brown T, et al. (2004) Nocturnal sleep disturbances and daytime dysfunction in patients with Parkinson’s disease and in their caregivers. Parkinsonism Relat Disord 10: 157–168.
13. Braak H, Del Tredici K, Rub U, de Vos RA, Jansen Steur EN, et al. (2003) Staging of brain pathology related to sporadic Parkinson’s disease. Neurobiol Aging 24: 197–211.
14. Arreguin S, Nelson P, Padway S, Shirazi M, Pierpont C (2009) Dopamine complexes of iron in the etiology and pathogenesis of Parkinson’s disease. J Inorg Biochem 103: 87–93.
15. Altamura S, Muckenthaler MU (2009) Iron toxicity in diseases of aging: Alzheimer’s disease, Parkinson’s disease and atherosclerosis. J Alzheimers Dis 16: 879–895.
16. Wu LJ, Leenders AG, Cooperman S, Meyron-Holtz E, Smith S, et al. (2004) Expression of the iron transporter ferroportin in synaptic vesicles and the blood-brain barrier. Brain Res 1001: 108–117.
17. Powers KM, Smith-Weller T, Franklin GM, Longstreth WT Jr, Swanson PD, et al. (2009) Dietary fats, cholesterol and iron as risk factors for Parkinson’s disease. Parkinsonism Relat Disord 15: 47–52.
18. Oestreicher E, Sengstock GJ, Riederer P, Olanow CW, Dunn AJ, et al. (1994) Degeneration of nigrostriatal dopaminergic neurons increases iron within the substantia nigra: a histochemical and neurochemical study. Brain Res 660: 8–18. 19. Ondo WG, Vuong KD, Jankovic J (2002) Exploring the relationship between
20. Pedroso JL, Bor-Seng-Shu E, Felicio AC, Braga-Neto P, Dutra LA, et al. (2012) Severity of restless legs syndrome is inversely correlated with echogenicity of the substantia nigra in different neurodegenerative movement disorders. a preliminary observation. J Neurol Sci 319: 59–62.
21. Diederich NJ, McIntyre DJ (2012) Sleep disorders in Parkinson’s disease: many causes, few therapeutic options. J Neurol Sci 314: 12–19.
22. Rye DB (2004) The two faces of Eve: dopamine’s modulation of wakefulness and sleep. Neurology 63: S2–7.
23. Rye DB, Bliwise DL, Dihenia B, Gurecki P (2000) FAST TRACK: daytime sleepiness in Parkinson’s disease. J Sleep Res 9: 63–69.
24. Murillo-Rodriguez E, Arias-Carrion O, Zavala-Garcia A, Sarro-Ramirez A, Huitron-Resendiz S, et al. (2012) Basic sleep mechanisms: an integrative review. Cent Nerv Syst Agents Med Chem 12: 38–54.
25. Braak H, Ghebremedhin E, Rub U, Bratzke H, Del Tredici K (2004) Stages in the development of Parkinson’s disease-related pathology. Cell Tissue Res 318: 121–134.
26. Febbraro F, Andersen KJ, Sanchez-Guajardo V, Tentillier N, Romero-Ramos M (2013) Chronic intranasal deferoxamine ameliorates motor defects and pathology in the alpha-synuclein rAAV Parkinson’s model. Exp Neurol. 27. Haack M, Lee E, Cohen DA, Mullington JM (2009) Activation of the
prostaglandin system in response to sleep loss in healthy humans: potential mediator of increased spontaneous pain. Pain 145: 136–141.
28. Simeonova PP, Luster MI (1995) Iron and reactive oxygen species in the asbestos-induced tumor necrosis factor-alpha response from alveolar macro-phages. Am J Respir Cell Mol Biol 12: 676–683.
29. Scaccabarozzi A, Arosio P, Weiss G, Valenti L, Dongiovanni P, et al. (2000) Relationship between TNF-alpha and iron metabolism in differentiating human monocytic THP-1 cells. Br J Haematol 110: 978–984.