OSD
9, 2679–2694, 2012Seawater capacitance
J. C. Wynn and J. A. Fleming
Title Page
Abstract Introduction
Conclusions References
Tables Figures
◭ ◮
◭ ◮
Back Close
Full Screen / Esc
Printer-friendly Version Interactive Discussion
Discussion
P
a
per
|
Dis
cussion
P
a
per
|
Discussion
P
a
per
|
Discussio
n
P
a
per
|
Ocean Sci. Discuss., 9, 2679–2694, 2012 www.ocean-sci-discuss.net/9/2679/2012/ doi:10.5194/osd-9-2679-2012
© Author(s) 2012. CC Attribution 3.0 License.
Ocean Science Discussions
This discussion paper is/has been under review for the journal Ocean Science (OS). Please refer to the corresponding final paper in OS if available.
Seawater capacitance – a promising proxy
for mapping and characterizing drifting
hydrocarbon plumes in the deep ocean
J. C. Wynn1and J. A. Fleming2
1
Cascades Volcano Observatory, US Geological Survey, 1300 SE Cardinal Ct, Vancouver, WA 98683, USA
2
Zonge International, 3322 E. Fort Lowell Road, Tucson, AZ 85716, USA
Received: 25 April 2012 – Accepted: 29 May 2012 – Published: 3 August 2012
Correspondence to: J. C. Wynn ([email protected])
OSD
9, 2679–2694, 2012Seawater capacitance
J. C. Wynn and J. A. Fleming
Title Page
Abstract Introduction
Conclusions References
Tables Figures
◭ ◮
◭ ◮
Back Close
Full Screen / Esc
Printer-friendly Version Interactive Discussion
Discussion
P
a
per
|
Dis
cussion
P
a
per
|
Discussion
P
a
per
|
Discussio
n
P
a
per
|
Abstract
Hydrocarbons released into the deep ocean are an inevitable consequence of natural seep, seafloor drilling, and leaking wellhead-to-collection-point pipelines. The Macondo 252 (Deepwater Horizon) well blowout of 2010 was even larger than the Ixtoc event in the Gulf of Campeche in 1979. History suggests it will not be the last accidental release, 5
as deepwater drilling expands to meet an ever-growing demand. For those who must respond to these sorts of disasters, the first line of action should be to know what is going on. This includes knowing where an oil plume is at any given time, where and how fast it is moving, and how it is evolving. We have experimented in the laboratory with induced polarization as a method to track hydrocarbons in the seawater column and 10
find that finely dispersed oil in seawater gives rise to a large distributed capacitance. This potentially could be used to both map and characterize oil plumes, down to less than 0.1 %, drifting and evolving in the deep ocean. A side benefit demonstrated in some earlier sea-trials is that this same approach in modified form can also map certain heavy placer minerals, as well as communication cables, pipelines, and wrecks buried 15
beneath the seafloor.
1 Introduction
The Macondo disaster is the largest offshore oil spill in history, releasing 4.9 million barrels (780 million l) into the Gulf of Mexico (Hsieh, 2010; Crone and Tolstoy, 2010; Ramseur, 2010). This is the latest in a long series of hydrocarbon spills, both delib-20
erate (e.g. the Gulf War spill of 1991), or accidental, released into the world’s oceans (Yapa and Chen, 2004). Where the complex hydrocarbons end up after such an event is important to scientists, policy planners, and litigants. After direct recovery, evaporation, skimming and burning, and “naturally dispersed” components are counted, the where-abouts of at least 38 % of the Macondo hydrocarbons remains unknown (Ramseur, 25
OSD
9, 2679–2694, 2012Seawater capacitance
J. C. Wynn and J. A. Fleming
Title Page
Abstract Introduction
Conclusions References
Tables Figures
◭ ◮
◭ ◮
Back Close
Full Screen / Esc
Printer-friendly Version Interactive Discussion
Discussion
P
a
per
|
Dis
cussion
P
a
per
|
Discussion
P
a
per
|
Discussio
n
P
a
per
|
very low in the cold abyssal sea, on the order of 1 micromolar oxygen per day (Camilli et al., 2010). As a result, a deep plume is thought to have advected away in the Gulf Loop Current at least several hundred kilometers from the Macondo well during 2010 (Kessler et al., 2011). A towed seawater capacitance-measuring geoelectrical array could be used to map and characterize such evolving plumes in the future.
5
Before mitigation can be planned or liability assessed, a hydrocarbon release must be mapped in 3-D, to see how it evolves and degrades in space and time. One way to do this is by cable-lowered rosette sampling (Breier et al., 2010) deployed from a sta-tionary ship. However, this is slow and expensive, requires downstream mass spec-trometry or subsequent chemical analysis, and provides only a narrow, vertical profile 10
sample acquired while a plume is moving. Another approach utilizes a membrane in-let mass spectrometer deployed on an Autonomous Underwater Vehicle (Camilli et al., 2010). This latter approach can detect methane concentrations down to 0.1 ppm, but like rosette profiling it is linear point-sampling, and it remains difficult to gather com-plete three-dimensional information. Acoustic echo soundings of the Macondo plume 15
showed anomalously high-volume scattering at 200 khz in one test, but this is impossi-ble to convert into a three-dimensional quantitative image, in part because the method is more sensitive to the gas than the liquid oil component of the plume by several orders of magnitude (Weber et al., 2011).
2 The induced polarization effect
20
We have experimented with a complementary geoelectrical approach based on the principle of induced polarization (IP). IP has been routinely used on land since the 1940’s (Sumner, 1976) and has been used in seafloor applications since 1986 (Wynn, 1988). IP measures a distributed capacitance-like behavior observed in certain polariz-ing materials such as sulfides or clays beneath the Earth’s surface; results are usually 25
OSD
9, 2679–2694, 2012Seawater capacitance
J. C. Wynn and J. A. Fleming
Title Page
Abstract Introduction
Conclusions References
Tables Figures
◭ ◮
◭ ◮
Back Close
Full Screen / Esc
Printer-friendly Version Interactive Discussion
Discussion
P
a
per
|
Dis
cussion
P
a
per
|
Discussion
P
a
per
|
Discussio
n
P
a
per
|
frequency components of the IP response in both lab and field settings (Zonge and Wynn, 1975).
The inducing voltage is provided by two electrodes comprising a current transmitter dipole, and receiver electrode dipole pairs are used to measure a secondary signal. In both laboratory sample cells and in the field, IP measurements are carried out using 5
any of several different four-electrode arrays. Results are normalized geometrically to provide two volume-independent parameters (usually resistivity and phase shift) for a polarizing material. The polarization effect is a surface-sensitive phenomenon due to any of several different electro-chemical/electro-physical mechanisms, each of which behaves like a frequency-dependent distributed capacitance (Sumner, 1976; Zonge 10
and Wynn, 1975; Slater and Lesmes, 2002). Thus, finely disseminated target materials, in very small percentages in a host matrix or in seawater, are more easily detected (make better targets) than the same materials in a concentrated form.
While data are normalized, larger dipole separations on the surface of a half-space will nevertheless sample deeper into the underlying rock – the result is a resistivity and 15
phase shift average for a larger volume (Sumner, 1976). However, as a four-electrode IP array is towed through the open ocean, the array will sample a cylindrical volume surrounding it as a continuous apparent resistivity and continuous phase shift. As in a land surface application, the actual volume sampled in the oceanic configuration is greater both for larger dipole length and larger transmit-receiver dipole separation, but 20
high seawater conductivity imposes a practical upper limit (Wynn et al., 2011).
Now consider a classical capacitor with metal plates separated by an oil-based di-electric, vs. droplets of oil dispersed in conductive seawater (Fig. 1). The topological equivalence suggested to us that diffuse oil in seawater should contribute a net dis-tributed capacitance. Measurement of in-situ seawater capacitance might then serve 25
as a proxy for hydrocarbons present as a dispersed plume in the deep ocean. Seawater by itself has an average resistivity of about 0.30 ohm−m (3.27 S m−
1
OSD
9, 2679–2694, 2012Seawater capacitance
J. C. Wynn and J. A. Fleming
Title Page
Abstract Introduction
Conclusions References
Tables Figures
◭ ◮
◭ ◮
Back Close
Full Screen / Esc
Printer-friendly Version Interactive Discussion
Discussion
P
a
per
|
Dis
cussion
P
a
per
|
Discussion
P
a
per
|
Discussio
n
P
a
per
|
a vertical cross-section or 2-D plane in the sea. Towing the array in open, unpolluted water provides a system calibration, which can then be deconvolved with survey data in the frequency domain after a simple Fast Fourier Transform (Wynn et al., 2011). If oil is present in the seawater column – or if sulfides, ilmenite (FeTiO3), or metallic debris
lie on or beneath the seafloor – then a non-zero capacitance manifested as a net phase 5
shift will be observed. If the array is towed through the ocean in a lawn-mower fashion, a 3-D map of resistivity and seawater capacitance may be assembled as fast as the array can be towed through the medium.
From sea trials in Puget Sound and offthe coast of South Africa (Wynn et al., 2011), we know that such a plane-slice could sample a volume up to 40 m wide, and the 10
vertical range sampled would be limited only by the number of parasitic streamers extended offthe master cable of Fig. 2. A further consideration of Fig. 1 and laboratory data (discussed below) suggests that the size distribution of oil droplets in seawater also has a distinctive and characteristic frequency response. In sea-trials we have also observed a phase shift along with a subtle resistivity drop over buried metallic debris 15
(wrecks) and sub-seafloor cables.
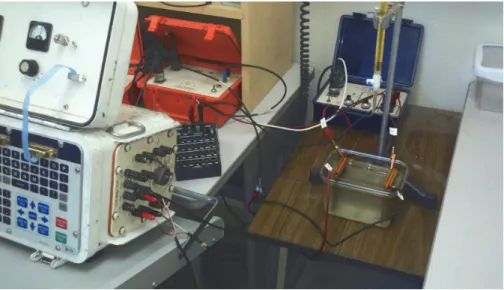
3 Laboratory measurements
We have conducted laboratory experiments to measure the normalized distributed ca-pacitance of low-concentration oil-seawater emulsions, measured as a phase shift re-sponse to an inducing, time-varying voltage. This is similar to using spectral IP to de-20
tect and characterize disseminated sulfide minerals on land (Sumner, 1976; Zonge and Wynn, 1975; Sheriff, 2002), in that both processes induce a temporary distributed charge accumulation. A measurement cell was filled with seawater (Fig. 3) and multi-viscosity oil was titrated into it and stirred to force dissemination. Experiments with conductive fluids in sandstones indicate that any phase shift is independent of the fluid 25
OSD
9, 2679–2694, 2012Seawater capacitance
J. C. Wynn and J. A. Fleming
Title Page
Abstract Introduction
Conclusions References
Tables Figures
◭ ◮
◭ ◮
Back Close
Full Screen / Esc
Printer-friendly Version Interactive Discussion
Discussion
P
a
per
|
Dis
cussion
P
a
per
|
Discussion
P
a
per
|
Discussio
n
P
a
per
|
Laboratory results show an unusually strong phase shift for low levels of dispersed hydrocarbons in seawater (up to 460 milliradians for 3 % oil/saltwater; see Fig. 4). By way of comparison, a land survey over a disseminated sulfide deposit, or a similar laboratory cell measuring a core sample from the same deposit, may give a phase shift as high as 20 milliradians. The apparent noise in frequencies below 8 Hz in Fig. 4 is 5
due to the difficulty in mixing oil and seawater into a uniform and stable emulsion. We used a martini stirrer to generate the emulsion, waited for visible turbulence to end, and then made our broadband (0.125–72 Hz) phase shift measurements. The peaks in this figure below 8 Hz are caused by different macroscopic oil droplet sizes; these are transient and difficult to assess, but from photographs range from less than 1 mm up 10
to about 4 mm. The curves show a decrease in phase shift with increasing frequency; this behavior appears due to finer droplets that have a greater latency in the emulsion. As droplets slowly biodegrade in the seawater over time (Camilli et al., 2010; Kessler et al., 2011), we expect a weaker overall phase shift response, as well as a shift to higher frequencies correlating with decreased droplet size. Most of the methane in the 15
Macondo effusion was biodegraded within 120 days (Kessler et al., 2011), and about 40 % of the hydrocarbon mix released was liquid oil (Crone and Tolstoy, 2010). With the relatively slow biodegradation of the oil, 25 %–38 % of it apparently remained in the seawater column for an extended period of time (Mariano, 2011; Camilli et al., 2010). The dispersed nature of the oil makes it an excellent target for a planar geoelectrical 20
array optimized to measure the distributed capacitance of the seawater.
4 Sea trials and the noise threshold
To establish the detection threshold of this type of approach it is necessary to under-stand the noise contribution in any field measurement. Sea-trials of a single-streamer IP array (a single cable version of Fig. 2), using a transmitter dipole and two re-25
OSD
9, 2679–2694, 2012Seawater capacitance
J. C. Wynn and J. A. Fleming
Title Page
Abstract Introduction
Conclusions References
Tables Figures
◭ ◮
◭ ◮
Back Close
Full Screen / Esc
Printer-friendly Version Interactive Discussion
Discussion
P
a
per
|
Dis
cussion
P
a
per
|
Discussion
P
a
per
|
Discussio
n
P
a
per
|
was towed at three knots (about 1.5 m s−1) through unpolluted seawater over
appar-ent metallic debris (Fig. 5). This site is located in a shoal area of the Chandeleur Is-lands with numerous documented wrecks, and not far from an 18th Century ballast pile excavated by archeologists that included six cannon (Garrison et al., 1999). The phase shift envelope in Fig. 5 shows a discrete feature with high-frequency oscillatory 5
noise added. This noise is caused by the streaming potential: seawater passing over the electrodes, in addition to tiny tow-flexures of the array that momentarily shorten the electrode separation and decrease the apparent resistivity. These oscillations are below 0.5 milliradians outside of the metallic anomaly. In Fig. 4, a 1 % oil content con-tributes a phase-shift of at least 10 and up to 23 milliradians. Assuming a conservative 10
noise threshold of 1 milliradian and a minimum 10 milliradians for 1 % oil in seawater, it appears that a modified version of the streamer towed in the deep ocean could detect hydrocarbons in seawater down to about 0.1 %. This is significantly less sensitive than the limits of a membrane inlet mass spectrometer, approximately 0.1 ppm for methane in seawater (Camilli et al., 2010; Hemond, et al., 2008), but this IP approach can map 15
distribution and characterize hydrocarbons by droplet size in 3 dimensions as fast as a 2-D array can be towed through the sea.
A seawater capacitance detection system, however, reacts to the surface area be-tween oil and seawater, so it would be proportionally more sensitive to the finely dis-persed oil reported in the Macondo plume (Camilli et al., 2010). A towed-array seawater 20
capacitance survey can also be conducted very efficiently in the deep ocean. Measure-ments are typically made 1–4 times per second for each parasitic streamer, each with a transmitter dipole and multiple receiver dipole-pairs. The sample spacing is propor-tional to ship speed and transmitter frequency. Such a survey will also provide both a 3-D map of a moving target, as well as characterize the hydrocarbon plume (using 25
OSD
9, 2679–2694, 2012Seawater capacitance
J. C. Wynn and J. A. Fleming
Title Page
Abstract Introduction
Conclusions References
Tables Figures
◭ ◮
◭ ◮
Back Close
Full Screen / Esc
Printer-friendly Version Interactive Discussion
Discussion
P
a
per
|
Dis
cussion
P
a
per
|
Discussion
P
a
per
|
Discussio
n
P
a
per
|
can also be used to locate buried pipelines or other metallic oil and gas infrastructure buried in the seabed.
Metallic debris and buried cables appear as point or line features. Unless the streamer is traveling sub-parallel to a buried cable, these give rise to fairly narrow phase-shift anomalies. Seawater capacitance from dispersed oil, however, would likely 5
manifest as a slow rise of phase-shift from zero to a relatively steady non-zero amount, followed by a decline as the streamer exits the dispersed plume. Ponded oil on the seafloor would manifest as a broad, non-zero phase-shift with a relatively sharp onset, as long as the streamer was traversing it. The amplitude of the phase-shift response would be a function of the oil-to-seawater surface area within sensing reach of the 10
array. From experimental sea-trials, this phase-shift will likely not be detected beyond about 20 m due to signal attenuation in the conductive medium.
5 Conclusions and discussion
Finely dispersed oil contributes a strong net capacitance to seawater when a gal-vanic current is introduced. In laboratory measurements this contribution, measured 15
as a transmitter-receiver phase shift, is more than an order of magnitude greater than similar measurements made on land over mineral deposits and in laboratory cores derived from these deposits. The degradation of an oil plume with time will manifest as an upward shift in the broadband frequency distribution of this capacitance, which serves as a proxy for the oil droplet size. Because electrodes are towed in the seawa-20
ter medium – an impossibility on land – this kind of measurement can be made very rapidly in seawater.
In sea-trials and laboratory experiments, we have observed that certain heavy placer minerals (pyrite, ilmenite, etc.), buried wrecks, pipelines, and communications cables also manifest a capacitive behavior to an inducing galvanic current injected into the 25
OSD
9, 2679–2694, 2012Seawater capacitance
J. C. Wynn and J. A. Fleming
Title Page
Abstract Introduction
Conclusions References
Tables Figures
◭ ◮
◭ ◮
Back Close
Full Screen / Esc
Printer-friendly Version Interactive Discussion
Discussion
P
a
per
|
Dis
cussion
P
a
per
|
Discussion
P
a
per
|
Discussio
n
P
a
per
|
The Gulf of Mexico hosts nearly 4000 offshore platforms currently operating, and as many as 7000 platforms have been in place since the early 20th Century (N.O.A.A., 2012; National Geographic, 2010). A massive array of poorly mapped, sometimes-buried pipelines links all these offshore sites to coastal gathering points. Most of these pipelines were laid in a pre-GPS era and could reasonably be expected to corrode 5
with time. A seawater capacitance or marine IP array can easily detect and map these pipelines, ferrous or non-ferrous, even if they are buried beneath several meters of inert sediment (Wynn and Laurent, 1999; Wynn and Zonge, 1975). A multi-cable geoelec-trical array can also map hydrocarbon seeps, both natural and those escaping from these pipelines, as they disperse from their sources.
10
Acknowledgements. This study was supported by a cooperative research and development agreement (CRADA) funded by the US Geological Survey, Williamson and Associates, and Zonge International. We thank the Mississippi Mineral Resources Institute for providing
ship-time on the R/VKit Jonesfor the Gulf of Mexico towed-streamer experiments, and N.O.A.A.
and Coastal Carolina University for providing ship-time on the R/VFerrell for the Atlantic Con-15
tinental Shelf experiments. The authors thank Dan Dzurisin, Norm Carlson, Scott Urquhart, and Mike Williams for discussions and helpful suggestions on the manuscript, as well as Peter Swarzenski, Jim Kauahikaua, and John Ewert of the USGS and anonymous others for technical reviews.
References
20
Breier, J. S., Rauch, C. G., McKartney, K., Toner, B. M., Fakra, S. C., White, S. N., and Ger-man, C. R.: A suspended-particle rosette multi-sampler for discrete biogeochemical sampling in low-particle-density waters, Lawrence Berkeley National Laboratory Paper LBNL-3586E, 11 pp., 2010.
Camilli, R., Reddy, C. M., Yoerger, D. R., Van Mooy, B. A. S., Jakuba, M. V., Kinsey, J. C., 25
McIntyre, C. P., Sylva, S. P., and Maloney, J. V.: Tracking hydrocarbon plume transport and biodegradation at Deepwater Horizon, Science, 330, 201–204, 2010.
OSD
9, 2679–2694, 2012Seawater capacitance
J. C. Wynn and J. A. Fleming
Title Page
Abstract Introduction
Conclusions References
Tables Figures
◭ ◮
◭ ◮
Back Close
Full Screen / Esc
Printer-friendly Version Interactive Discussion
Discussion
P
a
per
|
Dis
cussion
P
a
per
|
Discussion
P
a
per
|
Discussio
n
P
a
per
|
Garrison, E. G., Giammona, C. P., Jobling, J., Tripp, A. R., Weinstein, E. N., and Wolff, G. A.: An eighteenth-century ballast pile site, Chandeleur Islands, Louisiana, an instrumental and archaeological study, Outer Continental Shelf Region, Minerals Management Service Report 89–0092, 1989.
Hemond, H. F., Mueller, A. V., and Hemond, M.: Field testing of lake water chemistry with 5
a portable and an AUV-based mass spectrometer, J. Am. Soc. Mass. Spectr., 9, 1403–1410, 2008.
Hsieh, P.: Computer simulation of reservoir depletion and oil flow from the Macondo well fol-lowing the Deepwater Horizon blowout, US Geological Survey Open-File Report 2010–1266, 1–18, 2010.
10
Kessler, J. D., Valentine, D. L., Redmond, M. C., Du, M., Chan, E. W., Mendes, S. D., Quiroz, E. W., Villanueva, C. J., Shusta, S. S., Werra, L. M., Yvon-Lewis, S. A., and We-ber, T. C. A.: Persistent oxygen anomaly reveals the fate of spilled methane in the deep Gulf of Mexico, Science, 331, 312–315, 2011.
Mariano, A. J., Kourfalou, V. H., Srinivasan, A., Kang, H., Halliwell, G. R., Ryan, E. H., and 15
Roffer, M.: On the modeling of the 2010 Gulf of Mexico oil spill, Dynam. Atmos. Oceans, 52, 322–340, 2011.
National Geographic Magazine: The geography of offshore oil, available at: http://ngm.
nationalgeographic.com/2010/10/gulf-oil-spill/gulf-map-interactive.html (last access: April 2012), 2012.
20
N.O.A.A.: Oil platforms in the Gulf of Mexico, available at: http://oceanexplorer.noaa.gov/ explorations/06mexico/background/oil/media/platform 600.html (last access: April 2012), 2012.
Ramseur, J. L.: Deepwater Horizon oil spill, the fate of the oil, Cong. Res. Serv., 1–20, R41531, available at: www.fpc.state.gov/documents/organization/154155.pdf, 2010.
25
Revil, A. and Skold, M.: Salinity dependence of spectral induced polarization in sands and sandstones, Geophys. J. Int., 187, 813–824, 2011.
Sheriff, R. E.: Encyclopedic Dictionary of Applied Geophysics, Society of Exploration Geophysi-cists, 188 pp., 2002.
Slater, L. D. and Lesmes, D.: IP interpretation in environmental investigations, Geophysics, 67, 30
77–88, 2002.
OSD
9, 2679–2694, 2012Seawater capacitance
J. C. Wynn and J. A. Fleming
Title Page
Abstract Introduction
Conclusions References
Tables Figures
◭ ◮
◭ ◮
Back Close
Full Screen / Esc
Printer-friendly Version Interactive Discussion
Discussion
P
a
per
|
Dis
cussion
P
a
per
|
Discussion
P
a
per
|
Discussio
n
P
a
per
|
Weber, T. C., De Robertis, A., Greenaway, S. F., Smith, S., Mayer, L., and Rice, G.: Science Applications in the Deepwater Horizon Oil Spill Special Feature, Estimating oil concentration and flow rate with calibrated vessel-mounted acoustic echo sounders, Proc. Natl. Aca. Sci., online first, doi:10.1073/pnas.1108771108, 2011.
Wynn, J. C.: Titanium geophysics – a marine application of induced polarization, Geophysics, 5
53, 386–401, 1988.
Wynn J. C. and Laurent, K. W: Mapping buried metallic objects and titaniferous placers in the Mississippi Sound, Gulf of Mexico, in: SAGEEP Proceedings Volume 99, Symposium for Applications of Geophysics to Environmental and Engineering Problems, Oakland, CA, 803–810, 1999.
10
Wynn, J. C. and Zonge, K. L: Electromagnetic coupling, its intrinsic value, its removal, and the cultural coupling problem, Geophysics, 40, 831–850, 1975.
Wynn, J. C., Williamson, M., Urquhart, S., and Fleming, J. A.: An open-water electrical geo-physical tool for mapping sub-seafloor heavy placer minerals in 3D and migrating hydrocar-bon plumes in 4D, in: Proceedings of the IEEE-Marine Technology Society annual meeting, 15
Waikaloa, HI, 19–22 September 2011, 6 p. 8 figs, 2011.
Yapa, P. D. and Chen, F.: Behavior of oil and gas from deepwater blowouts, J. Hydraul. Eng.-Asce., 130, 540–553, 2004.
Zonge, K. L. and Wynn, J. C.: Recent advances and applications in complex resistivity mea-surements, Geophysics, 40, 851–864, 1975.
OSD
9, 2679–2694, 2012Seawater capacitance
J. C. Wynn and J. A. Fleming
Title Page
Abstract Introduction
Conclusions References
Tables Figures
◭ ◮
◭ ◮
Back Close
Full Screen / Esc
Printer-friendly Version Interactive Discussion
Discussion
P
a
per
|
Dis
cussion
P
a
per
|
Discussion
P
a
per
|
Discussio
n
P
a
per
|
Fig. 2.One of several possible seawater capacitance-measuring configurations. A single-cable version has been used to map ilmenite (FeTiO3) beneath the seafloor in the Gulf of Mexico, off
OSD
9, 2679–2694, 2012Seawater capacitance
J. C. Wynn and J. A. Fleming
Title Page
Abstract Introduction
Conclusions References
Tables Figures
◭ ◮
◭ ◮
Back Close
Full Screen / Esc
Printer-friendly Version Interactive Discussion
Discussion
P
a
per
|
Dis
cussion
P
a
per
|
Discussion
P
a
per
|
Discussio
n
P
a
per
|