BGD
12, 19481–19498, 2015
High-resolution ocean pH dynamics
in four subtropical Atlantic benthic
habitats
C. A. Hernández et al.
Title Page
Abstract Introduction
Conclusions References
Tables Figures
◭ ◮
◭ ◮
Back Close
Full Screen / Esc
Printer-friendly Version
Interactive Discussion
Discussion
P
a
per
|
Discussion
P
a
per
|
Discussion
P
a
per
|
Discussion
P
a
per
|
Biogeosciences Discuss., 12, 19481–19498, 2015 www.biogeosciences-discuss.net/12/19481/2015/ doi:10.5194/bgd-12-19481-2015
© Author(s) 2015. CC Attribution 3.0 License.
This discussion paper is/has been under review for the journal Biogeosciences (BG). Please refer to the corresponding final paper in BG if available.
High-resolution ocean pH dynamics in
four subtropical Atlantic benthic habitats
C. A. Hernández, S. Clemente, C. Sangil, and J. C. Hernández
Departamento de Biología Animal, Edafología y Geología, Facultad de Ciencias (Sección Biología), Universidad de La Laguna, Tenerife, Canary Islands, Spain
Received: 25 November 2015 – Accepted: 28 November 2015 – Published: 9 December 2015
Correspondence to: J. C. Hernández ([email protected])
BGD
12, 19481–19498, 2015
High-resolution ocean pH dynamics
in four subtropical Atlantic benthic
habitats
C. A. Hernández et al.
Title Page
Abstract Introduction
Conclusions References
Tables Figures
◭ ◮
◭ ◮
Back Close
Full Screen / Esc
Printer-friendly Version
Interactive Discussion
Discussion
P
a
per
|
Discussion
P
a
per
|
Discussion
P
a
per
|
Discussion
P
a
per
|
Abstract
Oscillations of ocean pH are largely unknown in coastal environments and ocean acid-ification studies often do not account for natural variability yet most of what is known about marine species and populations is found out via studies conducted in near shore environments. Most experiments designed to make predictions about future climate 5
change scenarios are carried out in coastal environments with no research that takes into account the natural pH variability. In order to fill this knowledge gap and to pro-vide reliable measures of pH oscillation, seawater pH was measured over time us-ing moored pH sensors in four contrastus-ing phytocenoses typical of the north Atlantic subtropical region. Each phytocenosis was characterized by its predominant engineer 10
species: (1)Cystoseira abies-marina, (2) a mix of gelidiales and geniculate corallines,
(3)Lobophora variegata,and (4) encrusting corallines. The autonomous pH measuring
systems consisted of a pH sensor; a data logger and a battery encased in a waterproof container and allowed the acquisition of high-resolution continuous pH data at each of the study sites. The pH variation observed ranged by between 0.09 and 0.24 pHNBS 15
units. A clear daily variation in seawater pH was detected at all the studied sites (0.04– 0.12 pHNBS units). Significant differences in daily pH oscillations were also observed between phytocenoses, which shows that macroalgal communities influence the sea-water pH in benthic habitats. Natural oscillations in pH must be taken into account in future ocean acidification studies to put findings in perspective and for any ecological 20
recommendations to be realistic.
1 Introduction
Over the past 250 years, anthropogenic CO2 emissions have caused an increase of atmospheric CO2concentration from 280 ppmv (parts per million volume) to 387 ppmv (Le Querè et al., 2009). It has been stated that this concentration will double by the end 25
BGD
12, 19481–19498, 2015
High-resolution ocean pH dynamics
in four subtropical Atlantic benthic
habitats
C. A. Hernández et al.
Title Page
Abstract Introduction
Conclusions References
Tables Figures
◭ ◮
◭ ◮
Back Close
Full Screen / Esc
Printer-friendly Version
Interactive Discussion
Discussion
P
a
per
|
Discussion
P
a
per
|
Discussion
P
a
per
|
Discussion
P
a
per
|
from 2000 to 2006, the oceans absorbed approximately 24 % of total anthropogenic CO2emissions (Canadell et al., 2007) reducing CO2 levels present in the atmosphere (IPCC, 2007; Sabine and Feely, 2007). However, when CO2 dissolves in seawater the gas reacts and forms carbonic acid (H2CO3) which then can dissociate and lose hydro-gen ions resulting in the formation of bicarbonate and carbonate ions. It is the increase 5
in concentrations of bicarbonate and hydrogen ions that lower the pH of seawater and causes ocean acidification. Over the last 200 years ocean pH is thought to have de-creased by approximately 0.1 units, from 8.21 to 8.10 (Royal Society, 2005; Kleypas, 2006). It is predicted that pH will decrease by a further 0.3–0.4 units by the end of the century (Orr et al., 2005; Doney et al., 2009).
10
Recently, the effects of ocean acidification on marine ecosystems have been an im-portant research area. Numerous laboratory studies have been published showing evi-dence that ocean acidification influences development, growth, physiology and survival of marine organisms, especially calcifying species (Orr et al., 2005; Fine and Tchernov, 2007; Ries et al., 2009; Dupont et al., 2013). Studies have demonstrated a wide range 15
of responses to seawater acidification by different taxonomic groups (Doney et al., 2009; Kroeker et al., 2013). However, most studies designed to identify the effects of ocean acidification use already available average values of carbon chemistry pa-rameters (pH oscillation, total alkalinity,pCO2and dissolved inorganic carbon) instead of measuring them in situ (McElhany and Busch, 2012). Separate studies specifically 20
measuring pH and carbonate levels in the same habitats often result in values that are inconsistent withpCO2averages used in studies. Experiments designed to assess the impact of ocean acidification should therefore also measure carbon chemistry within the studied habitats of the model species used. Laboratory experiments also tend to focus on testing responses to values of pH andpCO2, and saturation states for calcite 25
BGD
12, 19481–19498, 2015
High-resolution ocean pH dynamics
in four subtropical Atlantic benthic
habitats
C. A. Hernández et al.
Title Page
Abstract Introduction
Conclusions References
Tables Figures
◭ ◮
◭ ◮
Back Close
Full Screen / Esc
Printer-friendly Version
Interactive Discussion
Discussion
P
a
per
|
Discussion
P
a
per
|
Discussion
P
a
per
|
Discussion
P
a
per
|
and stressors that have adaptive impacts on populations. The combined impacts of ocean acidification and multiple stressors and their natural variability are largely un-known but may have a large influence on our predictions of future climate change scenarios. In coastal environments in particular, variability may be amplified due to the ambient heterogeneity and biological activity (Middelboe and Hansen, 2007).
5
Little is known about the influence of different phytocenoses on pH. However, a pro-nounced 24 h cycle of pH has been documented in Pacific coastal environments around America, with pH values varying by±0.24 units in a singleday (Wooton et al., 2008). In
the open ocean diurnal variation is not as pronounced: an average pH range of 0.024 units is more typical (Hoffman et al., 2011). In shallow water coastal environments 10
surface water pCO2 is also significantly higher and pH levels lower than the values expected based on equilibrium with current atmospheric levels (Fagan and Mackenzie, 2007; Bates et al., 2010; Thomsen et al., 2010; Shamberger et al., 2011; Yu et al., 2011; Hofmann et al., 2011).
In this paper we studied temporal pH variation in four different shallow water phyto-15
cenoses common in the North Atlantic subtropical region. Our main objective was to assess natural in situ pH values and daily cycles in contrasting coastal habitats, in order to provide information of this geographic area that will inform future ocean acidification studies.
2 Material and methods
20
Four study sites, each with a contrasting dominant engineer species, were selected in shallow water coastal sites around the Canary Islands. The sites (four different phy-tocenoses) represent the most common rocky bottom ecosystems occurring in the At-lantic archipelagos (Azores, Madeira, Salvages and the Canary Islands): (1)Cystoseira
abies-marina canopy-forming systems, (2) a mixed turf of Gelidiales and geniculate
25
BGD
12, 19481–19498, 2015
High-resolution ocean pH dynamics
in four subtropical Atlantic benthic
habitats
C. A. Hernández et al.
Title Page
Abstract Introduction
Conclusions References
Tables Figures
◭ ◮
◭ ◮
Back Close
Full Screen / Esc
Printer-friendly Version
Interactive Discussion
Discussion
P
a
per
|
Discussion
P
a
per
|
Discussion
P
a
per
|
Discussion
P
a
per
|
variegata stands (Sangil et al., 2011) and (4) sea urchin barren grounds dominated
by crustose algae due to the grazing activity of the sea urchin Diadema africanum
(Hernández et al., 2008). The characteristics of each phytocenosis are summarized in Table 1.
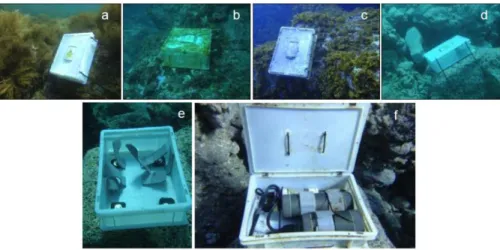
A moored pH measuring system was deployed at each of the study sites (Table 2). 5
Each system consisted of a Seabird SBE 18 pH sensor attached to a data logger and a lead battery protected inside a waterproof container. Each system was placed inside a plastic box with several openings to allow water circulation and this box was firmly attached to the rocky bottom using a pneumatic drill at about 5 to 10 m depth in each site (Fig. 1).
10
The pH sensors were previously calibrated against NIST buffer solutions (4, 7 and 10 pH±0.02) using the software SEASOFT and its module pHfit. The loggers were
pro-grammed to take measurements once every 30 min and the systems were deployed for 15 days during two time periods at each site (see details in Table 1). The tim-ing of deployment and retrieval of the pH systems was dependent on sea state and 15
measurements could therefore not be made simultaneously at all four sites due to lo-gistic restrictions. The study was also disrupted because the pH sensor located in the encrusting coralline algae site was subject to vandalism during the second sampling period – no data could be gathered for this particular time in this phytocenosis. The location and study periods for each different site are summarized in Table 1.
20
3 Results
All four sites displayed a clear 24 h pH cycle. The lowest pH values were recorded in the morning between 08:00 and 10:00 a.m., and values were highest between 15:00 and 19:00 p.m., though there were differences between phytocenoses (Fig. 2, Table 1). Overall pHNBS values measured in this study ranged between 8.04 ( Cys-25
toseira abies-marina community, autumn) and 8.10 (gelidiales-genicullate corallines
BGD
12, 19481–19498, 2015
High-resolution ocean pH dynamics
in four subtropical Atlantic benthic
habitats
C. A. Hernández et al.
Title Page
Abstract Introduction
Conclusions References
Tables Figures
◭ ◮
◭ ◮
Back Close
Full Screen / Esc
Printer-friendly Version
Interactive Discussion
Discussion
P
a
per
|
Discussion
P
a
per
|
Discussion
P
a
per
|
Discussion
P
a
per
|
C. abies-marina community during autumn 2011 (0.24, ranging from 8.04 to 8.28).
The lowest pHNBS variation was 0.09 recorded in the gelidiales-genicullate coralline community in autumn 2011. In the remaining sites and time periods pHNBSvaried by 0.12–0.16. The highest mean pHNBS per time period was measured in the gelidiales-genicullate corallines andCystoseiracommunities in spring 2012 (pHNBS8.23) and the 5
lowest mean value was recorded in the gelidiales-genicullate corallines in autumn 2011 (pHNBS8.10).
Despite seasonal variations in pHNBS, a daily pattern was still apparent though its range was relatively small in comparison. Based on mean pHNBS per hour the diurnal cycle was clearest in theC. abies-marina site in autumn 2011, where daily pHNBS val-10
ues varied by; 0.12 units (Figs. 2 and 3). The same site in May 2012 still showed a clear daily pattern (Fig. 3) but the variation in values was smaller, just 0.08. Mean daily vari-ation was lowest (0.04 pHNBS units day−
1
) in the gelidiales-genicullate coralline site in November 2011 and Lobophora variegatasite in 2011 (Figs. 2 and 3). The crustose algae phytocenosis could only be examined in October 2011, due to vandalism of ex-15
perimental equipment, and daily pHNBSvaried by 0.05 units at this site (Fig. 3).
The exact timing of daily pHNBS maxima and minima was different in each phyto-cenoses (Figs. 2 and 3). The highest daily values were generally recorded in the af-ternoon, between 15:00 and 16:00 p.m. but at theC. abies-marinasite these maxima occurred later in the day, between 18:00 and 19:00 p.m.
20
In the gelidiales-genicullate coralline site, daily variation and daily means differed be-tween the two studied periods. In the gelidiales-genicullate phytocenosis, pHNBSvaried by 0.08 units over a 24 h cycle in March 2012 compared to 0.04 units variation in au-tumn 2011 (Fig. 2). At the same site mean pHNBS was higher in the spring period (pHNBS8.23) compared to autumn (pHNBS8.10) (Table 3).
BGD
12, 19481–19498, 2015
High-resolution ocean pH dynamics
in four subtropical Atlantic benthic
habitats
C. A. Hernández et al.
Title Page
Abstract Introduction
Conclusions References
Tables Figures
◭ ◮
◭ ◮
Back Close
Full Screen / Esc
Printer-friendly Version
Interactive Discussion
Discussion
P
a
per
|
Discussion
P
a
per
|
Discussion
P
a
per
|
Discussion
P
a
per
|
4 Discussion
The data showed that daily pH variation differed between phytocenoses, and that the observed differences seem to be related to algae productivity. This suggests that in coastal environments the type of phytocenosis present influences the pH gradient in-habited by all organisms within that ecosystem. Continuous monitoring of pH in four 5
contrasting habitats has revealed that the largest variation in pH throughout the sam-pling period and the highest daily variation in pH values occurred in the Cystoseira
abies-marina phytocenesis in autumn 2011. Daily fluctuations in pH were clear at
this site, where algal cover was higher compared to the three other studied phyto-cenoses (Table 3).Cystoseira abies-marinais a perennial species present throughout 10
the whole year and tends to form large accumulations of drift algae along the edge of the seashore. The high algal biomass of Cystoseira abies-marina and associated high levels of primary production could be key to the large daily fluctuations in pH at this site; since high levels of CO2 uptake during periods of photosynthesis and CO2 release during non-photosynthetic periods could cause pH to vary more widely. 15
The diel patterns exhibited in the coastal ecosystems studied are similar to diel patterns observed in coral reef ecosystems in Hofmann et al. (2011). Daily variation was characterized by consistent and moderate fluctuations ranging from 0.1 to 0.25 pH units day−1. Other comparable diurnal pH fluctuations measured elsewhere were 0.1 units day−1 in spring in the Bay of Calvi in the Mediterranean (Frankignoulle and 20
Bouquegneau, 1990) and 0.15 day in autumn in the Bay of Bengal in the Indian Ocean (Subramanian and Mahadevan, 1999). In oligotrophic open ocean areas pH variation tends to be lower, for example daily variations in pH were between 0.02 to 0.10 units over a 30 days period (Hoffman et al., 2011). In comparison, diurnal variations up to 0.5 units day−1 were observed in a productive Kelp forest close to the Kerguelen 25
Archipelago in the Southern Ocean in austral summer (Delille et al., 2009).
BGD
12, 19481–19498, 2015
High-resolution ocean pH dynamics
in four subtropical Atlantic benthic
habitats
C. A. Hernández et al.
Title Page
Abstract Introduction
Conclusions References
Tables Figures
◭ ◮
◭ ◮
Back Close
Full Screen / Esc
Printer-friendly Version
Interactive Discussion
Discussion
P
a
per
|
Discussion
P
a
per
|
Discussion
P
a
per
|
Discussion
P
a
per
|
pH increases when CO2 is captured by photosynthetic organisms (macroalgae and phytoplankton) throughout the daytime, and decreases at night when CO2 is respired and diffuses from the ocean to the atmosphere (Bensoussan and Gatuso, 2007).
Our data also shows that some seasonal variation in pH exists; mean pH values were higher in the winter–spring period compared to the autumn. The late winter– 5
spring season is when the highest growth rates of engineer species occur in these phytocenosis in the Canary Islands (Medina and Haroun, 1994; Montañés et al., 2006). The spring growth of these engineer species is triggered by the breakdown of the seasonal thermocline when cold rich deep waters mix with the upper, nutrient-depleted waters (De León and Braun, 1973; Barton et al., 1998), and by the availability 10
of more daylight hours.
The highest seasonal pH variability, as much as 0.13 pHNBS units, was recorded in the gelidiales-genicullate coralline phytocenosis. The variation in pH recorded here was double that previously observed in the Canary Islands region; a value of 0.055 pH units from the European Station for Time Series in the Ocean (González-Dávila 15
and Santana-Casiano, 2011). However, seawater samples from the European Station for Time Series in the Ocean were collected in an open ocean area, not in shallow coastal water sites such as we used in our study. The shallow coastal areas studied here, as well as others around the world, are subject to greater variation in a number of environmental parameters that influence spatial and temporal pH; both biotic factors 20
(photosynthesis, respiration) and abiotic (freshwater input, nutrient concentration, lo-cal upwelling or volcanic activity). The organisms living in coastal areas are therefore continuously coping with relatively large oscillations in pH and these oscillations may increase in the future due to rising seawater CO2concentrations that will decrease the ocean’s natural buffering capacity (Schulz and Riebsell, 2012).
25
vari-BGD
12, 19481–19498, 2015
High-resolution ocean pH dynamics
in four subtropical Atlantic benthic
habitats
C. A. Hernández et al.
Title Page
Abstract Introduction
Conclusions References
Tables Figures
◭ ◮
◭ ◮
Back Close
Full Screen / Esc
Printer-friendly Version
Interactive Discussion
Discussion
P
a
per
|
Discussion
P
a
per
|
Discussion
P
a
per
|
Discussion
P
a
per
|
ation in pH should also be incorporated into models of ocean pH and allowed for in studies with benthic species and populations that aim to assess the effect of ocean acidification.
Author contributions. C. A. Hernández and J. C. Hernández design the study and J. C.
Hernán-dez, C. Sangil and S. Clemente carried them out. C. A. Hernández and J. C. Hernández
pre-5
pared the manuscript with contributions from all co-authors.
Acknowledgements. This manuscript was written within the framework of the project Plan
Na-cional de Investigación of the Spanish Ministerio de Economía y Competitividad, BLUEROCK, CGL 2013_43908_R. Thanks to J. Manning (from “Science Correct”) who improved earlier ver-sions of the manuscript.
10
References
Barton, E. D., Arıìstegui, J., Tett, P., Cantón, M., Garcıìa-Braun, J., Hernández-León, S., Nyk-jaer, L., Almeida, C., Almunia, J., Ballesteros, S., Basterretxea, G., Escánez, J., Garcı ìa-Weill, L., Hernández-Guerra, A., López-Laatzen, F., Molina, R., Montero, M. F., Navarro-Pérez, E., Rodrıìguez, J. M., van Lenning, K., Vélez. H., and Wild, K.: The transition zone of
15
the Canary current upwelling region, Prog. Oceanogr., 41, 455–504, 1998.
Bates, N. R., Amat, A., and Andersson, A. J.: Feedbacks and responses of coral calcification on the Bermuda reef system to seasonal changes in biological processes and ocean acidifi-cation, Biogeosciences, 7, 2509–2530, doi:10.5194/bg-7-2509-2010, 2010.
Bensoussan, N. and Gattuso, J. P.: Community primary production and calcification in a NW
20
Mediterranean ecosystem dominated by calcareous macroalgae, Mar. Ecol.-Prog. Ser., 334, 37–45, 2007.
Canadell, J. G., Le Quere, C., Raupach, M. R., Field, C. B., Buitenhuis, E. T., Ciais, P., Con-way, T. J., Gillett, N. P., Houghton, R. A., and Marland, G.: Contributions to accelerating atmospheric CO2 growth from economic activity, carbon intensity, and efficiency of natural
25
sinks, P. Natl. Acad. Sci. USA, 104, 18866–18870, 2007.
BGD
12, 19481–19498, 2015
High-resolution ocean pH dynamics
in four subtropical Atlantic benthic
habitats
C. A. Hernández et al.
Title Page
Abstract Introduction
Conclusions References
Tables Figures
◭ ◮
◭ ◮
Back Close
Full Screen / Esc
Printer-friendly Version
Interactive Discussion
Discussion
P
a
per
|
Discussion
P
a
per
|
Discussion
P
a
per
|
Discussion
P
a
per
|
Delille, B., Borges, A. V., and Delille, D.: Infiuence of giant kelp beds (Macrocystis pyrifera) on diel cycles ofpCO2 and DIC in the Sub-Antarctic coastal area, Estuar. Coast. Shelf S., 81, 114–122, 2009.
Doney, S. C., Fabry, V. J., Feely, R. A., and Kleypas, J. A.: Anthropogenic ocean acidification over the twenty-first century and its impact on calcifying organisms, Annual Review of Marine
5
Science, 1, 169–192, 2009.
Dupont, S. and Thorndyke, M. C.: Direct impacts of near-future ocean acidification on sea urchins, in: Climate Change Perspectives from the Atlantic: Past, Present and Future, edited by: Palacios, J. M., De Nascimiento, L., Díaz-González, J. P., Clemente, S., and Hernán-dez, J. C., Servicio de Publicaciones de la Universidad de La Laguna, 461–485, 2013.
10
Dupont, S., Dorey, N., Stumpp, M., Melzner, F., and Thorndyke, M.: Long-term and trans-life-cycle effects of exposure to ocean acidification in the green sea urchinStrongylocentrotus
droebachiensis, Mar. Biol., 160, 1835–1843, 2013.
Fagan, K. E. and Mackenzie, F. T.: Air–sea CO2exchange in a subtropical estuarine-coral reef system, Kaneohe, Bay, Oahu, Hawaii, Mar. Chem., 106, 174–191, 2007.
15
Fine, M. and Tchernov, D.: Scleractinian coral species survive and recover from decalcification, Science, 315, 1811, doi:10.1126/science.1137094, 2007.
Frankignoulle, M. and Bouquegneau, J. M.: Daily and yearly variations of total inorganic carbon in a productive coastal area, Estuar. Coast. Shelf S., 30, 79–89, 1990.
González-Dávila, M. and Santana-Casiano, J. M.: Sea surface and atmospheric fCO2 data
20
measured during the ESTOC time series cruises from 1995–2009, data/Carbon dioxide in-formation analysis center, Oak Ridge National Laboratory, US Department of Energy, Oak Ridge, Tennessee Greenhouse Gas Sinks, CABI Publishing, Oxfordshire, UK, 1990.
Hofmann, G. E., Smith, J. E., Johnson, K. S., Send, U., Levin, L. A., Micheli, F., Paytan, A., Price, N. N., Peterson, B., Takeshita, Y., Matson, P. G., Crook, E. D., Kroeker, K. J.,
25
Gambi, M. C., Rivest, E. B., Frieder, C. A., Yu, P. C., and Martz, T. R.: High-frequency dynamics of ocean pH: a multi-ecosystem comparison, PloS one, 6, e28983, doi:10.1371/journal.pone.0028983, 2011.
Houghton, J. T., Ding, Y., Griggs, D. J., Noguer, M., Van der Lin- den, P. J., Dai, X., Maskell, K., and Johnson, C. A.: Climate Change 2001: The Scientific Basis, Cambridge University Press,
30
Cambridge, UK, 2001.
BGD
12, 19481–19498, 2015
High-resolution ocean pH dynamics
in four subtropical Atlantic benthic
habitats
C. A. Hernández et al.
Title Page
Abstract Introduction
Conclusions References
Tables Figures
◭ ◮
◭ ◮
Back Close
Full Screen / Esc
Printer-friendly Version
Interactive Discussion
Discussion
P
a
per
|
Discussion
P
a
per
|
Discussion
P
a
per
|
Discussion
P
a
per
|
Kleypas, J. A., Feely, R. A., Fabry, V. J., Langdon, C., Sabine, C. L., and Robbins, L. L.Impacts of Ocean Acid- ification on Coral Reefs and Other Marine Calcifiers: A Guide for Future Research, report of a workshop held 18–20 April 2005, St. Petersburg, FL, sponsored by NSF, NOAA, and the US Geological Survey, 88 pp., 2006.
Kroeker, K. J., Kordas, R. L., Crim, R. N., and Singh, G.: Meta-analysis reveals negative yet
vari-5
able effects of ocean acidification on marine organisms, Ecol. Lett., 13, 1419–1434, 2013. McElhany, P. and Busch, D. S.: Appropriate pCO2 treatments in ocean acidification
experi-ments, Mar. Biol., 160, 1807–1812, 2013.
Medina, M. and Haroun, R.: Dinámica regresiva de una pradera submareal de Cystoseira
abies-marina(Cystoseiraceae, Phaeophyta) en la isla de Tenerife, Vieraea, 23, 65–71, 1994.
10
Montañés, M. A., Sansón, M., and Reyes, J.: Vegetative and reproductive phenology ofZonaria
tournefortii(Dictyotales, Phaeophyceae) in sublittoral populations offthe Canary Islands, Bot.
Mar., 49, 406–416, 2006.
Middelboe, A. L. and Hansen, P. J.: High pH in shallow-water macroalgal habitats, Mar. Ecol.-Progr. Ser., 338, 107–117, 2007.
15
Orr, J. C., Fabry, V. J., Aumont, O., Bopp, L., Doney, S. C., Feely, R. A., Gnanadesikan, A., Gru-ber, N., Ishida, A., Joos, F., Key, R. M., Lindsay, K., Maier-Reimer, E., Matear, R., Monfray, P., Mouchet, A., Najjar, R. J., Plattner, G. K., Rodgers, K. B., Sabine, C. L., Sarmiento, J. L., Schlitzer, R., Slater, R. D., Totterdell, I. J., Weirig, M. F., Yamanaka, Y., and Yool, A.: Anthro-pogenic ocean acidification over the twenty-first century and its impact on calcifying
organ-20
isms, Nature, 437, 681–686, 2005.
Ries, J. B., Cohen, A. L., and McCorkle, D. C.: Marine calcifiers exhibit mixed responses to CO2-induced ocean acidification, Geol., 37, 1131–1134, 2009.
Royal Society: Ocean Acidification due to Increasing Atmospheric Carbon Dioxide, London, The Royal Society, 2005.
25
Sabine, C. L. and Feely, R. A.: Greenhouse gas sinks, in: The Oceanic Sink for Carbon Dioxide, edited by: Reay, D., Hewitt, N., Grace, J., and Smith, K., CABI Publishing, Oxfordshire, UK, 31–49, 2007.
Schulz, K. G. and Riebesell, U.: Diurnal changes in seawater carbonate chemistry speciation at increasing atmospheric carbon dioxide, Mar. Biol., 160, 1889–1899, 2013.
30
BGD
12, 19481–19498, 2015
High-resolution ocean pH dynamics
in four subtropical Atlantic benthic
habitats
C. A. Hernández et al.
Title Page
Abstract Introduction
Conclusions References
Tables Figures
◭ ◮
◭ ◮
Back Close
Full Screen / Esc
Printer-friendly Version
Interactive Discussion
Discussion
P
a
per
|
Discussion
P
a
per
|
Discussion
P
a
per
|
Discussion
P
a
per
|
Subramanian, B. and Mahadevan, A.: Seasonal and diurnal variation of hydrobiological char-acters of coastal water of Chennai (Madras), Bay of Bengal, Ind. J. Mar. Sci., 28, 429–433, 1999.
Thomsen, J., Gutowska, M. A., Saphörster, J., Heinemann, A., Trübenbach, K., Fietzke, J., Hiebenthal, C., Eisenhauer, A., Körtzinger, A., Wahl, M., and Melzner, F.: Calcifying
inverte-5
brates succeed in a naturally CO2-rich coastal habitat but are threatened by high levels of future acidification, Biogeosciences, 7, 3879–3891, doi:10.5194/bg-7-3879-2010, 2010. Yu, P. C., Matson, P. G., Martz, T. R., and Hofmann, G. E.: The ocean acidification seascape and
its relationship to the performance of calcifying marine invertebrates: Laboratory experiments on the development of urchin larvae framed by environmentally-relevantpCO2pH−1
, J. Exp.
10
BGD
12, 19481–19498, 2015
High-resolution ocean pH dynamics
in four subtropical Atlantic benthic
habitats
C. A. Hernández et al.
Title Page
Abstract Introduction
Conclusions References
Tables Figures
◭ ◮
◭ ◮
Back Close
Full Screen / Esc
Printer-friendly Version
Interactive Discussion
Discussion
P
a
per
|
Discussion
P
a
per
|
Discussion
P
a
per
|
Discussion
P
a
per
|
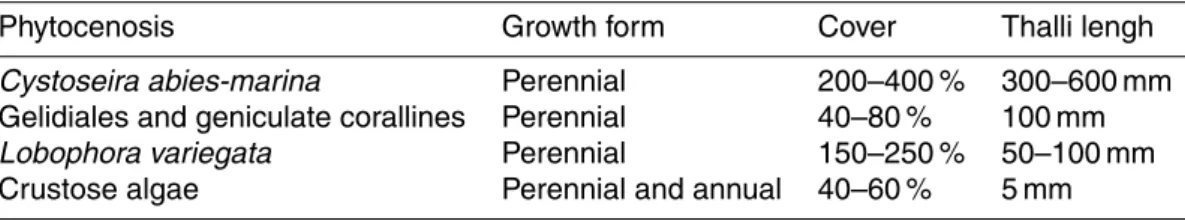
Table 1.Characteristics of the four studied phytocenoses.
Phytocenosis Growth form Cover Thalli lengh
Cystoseira abies-marina Perennial 200–400 % 300–600 mm
Gelidiales and geniculate corallines Perennial 40–80 % 100 mm
Lobophora variegata Perennial 150–250 % 50–100 mm
BGD
12, 19481–19498, 2015
High-resolution ocean pH dynamics
in four subtropical Atlantic benthic
habitats
C. A. Hernández et al.
Title Page
Abstract Introduction
Conclusions References
Tables Figures
◭ ◮
◭ ◮
Back Close
Full Screen / Esc
Printer-friendly Version
Interactive Discussion
Discussion
P
a
per
|
Discussion
P
a
per
|
Discussion
P
a
per
|
Discussion
P
a
per
|
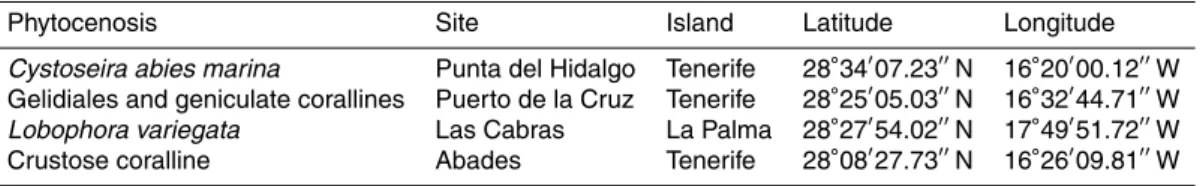
Table 2.Locations of study sites where pH sensors were deployed.
Phytocenosis Site Island Latitude Longitude
Cystoseira abies marina Punta del Hidalgo Tenerife 28◦34′07.23′′N 16◦20′00.12′′W
Gelidiales and geniculate corallines Puerto de la Cruz Tenerife 28◦25′05.03′′N 16◦32′44.71′′W
Lobophora variegata Las Cabras La Palma 28◦27′54.02′′N 17◦49′51.72′′W
BGD
12, 19481–19498, 2015
High-resolution ocean pH dynamics
in four subtropical Atlantic benthic
habitats
C. A. Hernández et al.
Title Page
Abstract Introduction
Conclusions References
Tables Figures
◭ ◮
◭ ◮
Back Close
Full Screen / Esc
Printer-friendly Version
Interactive Discussion
Discussion
P
a
per
|
Discussion
P
a
per
|
Discussion
P
a
per
|
Discussion
P
a
per
|
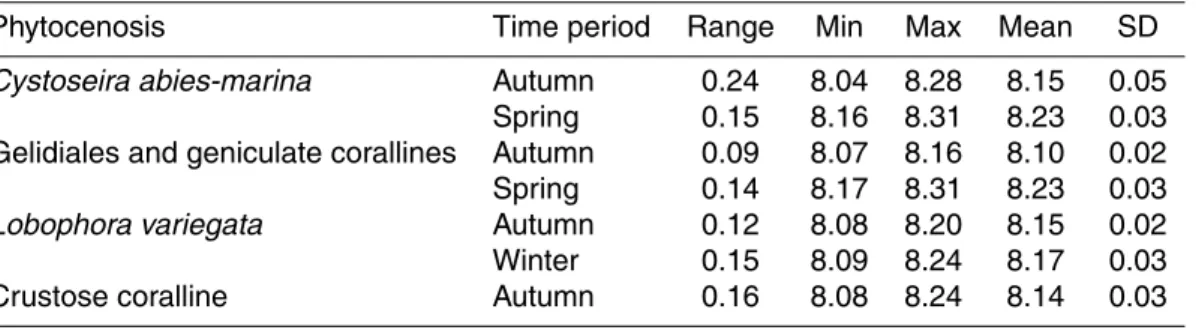
Table 3.Descriptive statistics for pH profiles at each site.
Phytocenosis Time period Range Min Max Mean SD
Cystoseira abies-marina Autumn 0.24 8.04 8.28 8.15 0.05
Spring 0.15 8.16 8.31 8.23 0.03
Gelidiales and geniculate corallines Autumn 0.09 8.07 8.16 8.10 0.02
Spring 0.14 8.17 8.31 8.23 0.03
Lobophora variegata Autumn 0.12 8.08 8.20 8.15 0.02
Winter 0.15 8.09 8.24 8.17 0.03
BGD
12, 19481–19498, 2015
High-resolution ocean pH dynamics
in four subtropical Atlantic benthic
habitats
C. A. Hernández et al.
Title Page
Abstract Introduction
Conclusions References
Tables Figures
◭ ◮
◭ ◮
Back Close
Full Screen / Esc
Printer-friendly Version
Interactive Discussion
Discussion
P
a
per
|
Discussion
P
a
per
|
Discussion
P
a
per
|
Discussion
P
a
per
|
Figure 1.pH sensor cases deployed at each of the phytocenoses studied:(a)Cystoseira
abies-marina; (b)Gelidiales and geniculate corallines;(c)Lobophora variegata; (d)Crustose algae.
BGD
12, 19481–19498, 2015
High-resolution ocean pH dynamics
in four subtropical Atlantic benthic
habitats
C. A. Hernández et al.
Title Page Abstract Introduction Conclusions References Tables Figures ◭ ◮ ◭ ◮ Back Close
Full Screen / Esc
Printer-friendly Version Interactive Discussion Discussion P a per | Discussion P a per | Discussion P a per | Discussion P a per | 8.04 8.09 8.14 8.19 8.24 8.29 8.34 pH 8.04 8.09 8.14 8.19 8.24 8.29 8.34 8.04 8.09 8.14 8.19 8.24 8.29 8.34 pH 8.04 8.09 8.14 8.19 8.24 8.29 8.34 8.04 8.09 8.14 8.19 8.24 8.29 8.34 pH
a. Cystoseira abies-marina
Autumn
Autumn
Autumn b. Gelidiales and geniculate
d. Crustose algae
Spring Spring 8.04 8.09 8.14 8.19 8.24 8.29 8.34 pH 8.04 8.09 8.14 8.19 8.24 8.29 8.34 Autumn
c. Lobophora variegata
Winter
Figure 2.Mean pH per hour of the day at each site:(a)Cystoseira abies-marina; (b)Gelidiales
BGD
12, 19481–19498, 2015
High-resolution ocean pH dynamics
in four subtropical Atlantic benthic
habitats
C. A. Hernández et al.
Title Page Abstract Introduction Conclusions References Tables Figures ◭ ◮ ◭ ◮ Back Close
Full Screen / Esc
Printer-friendly Version Interactive Discussion Discussion P a per | Discussion P a per | Discussion P a per | Discussion P a per | 8.04 8.09 8.14 8.19 8.24 8.29 8.34 pH 8.04 8.09 8.14 8.19 8.24 8.29 8.34 8.04 8.09 8.14 8.19 8.24 8.29 8.34 pH 8.04 8.09 8.14 8.19 8.24 8.29 8.34 8.04 8.09 8.14 8.19 8.24 8.29 8.34 pH 8.04 8.09 8.14 8.19 8.24 8.29 8.34 8.04 8.09 8.14 8.19 8.24 8.29 8.34 pH
a. Cystoseira abies-marina
Autumn
Autumn
Autumn
Autumn c. Lobophora variegata
d. Crustose algae
Winter Spring
Spring b. Gelidiales and geniculate
Figure 3.Variation in seawater pH at each site: (a)Cystoseira abies-marina; (b) Gelidiales