Spectroscopic study of the inclusion compound of
b
-cyclodextrin and Tris(dibenzoylmethane)europium(III)
dihydrate
H.F. Brito
a, C.A.A. Carvalho
b,*, O.L. Malta
c, J.J. Passos
b, J.F.S. Menezes
a,
R.D. Sinisterra
daInstituto de Quı´mica da Uni6ersidade de Sa˜o Paulo,05599-970Sao Paulo,Brazil bDepartamento de Quı´mica da Uni6ersidade Federal de Ouro Preto,Departamento de Quı´mica,
Uni6ersidade Federal de Ouro Preto,Campus Morro de Cruzeiro,35400-000Ouro Preto MG,Brazil
cDepartamento de Quı´mica Fundamental da Uni6ersidade Federal de Pernambuco,Recife,Brazil dDepartamento de Quı´mica da Uni6ersidade Federal de Minas Gerais,Belo Horizonte,Brazil
Received 15 January 1999; accepted 27 January 1999
Abstract
Photoluminescent properties of the inclusion compound ofb-cyclodextrin and tris(dibenzoylmethane)europium(III) dihydrate, in the solid state, are reported. This compound and the precursor salt, Eu(DBM)3· 2H2O (DBM=
diben-zoylmethane), were characterized by IR spectroscopy, X-ray powder diffraction and differential scanning calorimetry. The emission data indicate that the host-guest interaction (at 77 K) causes an intensification of some bands corresponding to the5D
07FJ(J=0 – 4) transitions associated with one of the site symmetries existing in the guest
compound. Based on the luminescence spectrum of the supramolecular compound the Vl experimental intensity
parameters (l=2 and 4) were calculated for the electronic transitions 5D
07F2, 4. The value of the V2 intensity
parameter for this new compound is smaller than for the guest, suggesting an effective interaction between the
b-cyclodextrin and the closer chemical environment of the Eu3+ ion. On the other hand, the values of the V4
parameter for the inclusion compound are twice larger than the one of the guest, suggesting that the steric effect is more significant in the supramolecular species. Comparison between the luminescence lifetimes of the guest and inclusion compound indicates that theb-cyclodextrin contributes to increase the lifetime of the5D
0emitting level. The
time-resolved spectra of the inclusion compound corroborate the presence of more than one site symmetry occupied by the rare earth ion. © 1999 Elsevier Science B.V. All rights reserved.
Keywords:Trivalent europium;b-cyclodextrin; Luminescence spectroscopy
www.elsevier.nl/locate/saa
1. Introduction
An important development in the field of the supramolecular chemistry is the study of plexes of the type host-guest. Macrocyclic com-pounds are used to encapsulate chemical species * Corresponding author. Fax: +55-31-5591707.
E-mail address:[email protected] (C.A.A. Carvalho)
in cavities with appropriate sizes. The supra-molecular systems, in relation to the individual species, can be characterized by non covalent bonds and exhibit new physical and chemical properties [1,2].
The cyclodextrins have shown to be promising hosts in inclusion chemistry, presenting properties based on its steric conformation with conical ex-ternal structures including a relatively large inter-nal cavity. The exterinter-nal surface of these molecules is hydrophilic, while the internal cavity presents apolar character [1]. Cyclodextrins (CD) are cyclic oligosaccharides composed of six, seven and eight glucose units, known asa, b, g-CD, respectively. They are composed of D-glucopyranose units linked by an a(1 – 4) glycoside linkage. In accord with its dimensions and hydrophilic – lipophilic properties several classes of chemical species can be included totally or partially in the cavity of the cyclodextrins. In the case of formation of the inclusion complex the physical and chemical properties of the guest can be modified as a consequence of the type of interaction host:guest. Consequently the cyclodextrins can be used in many fields as pharmaceutical preparations, cos-metic and food industries, separations and these host molecules can be utilized as model systems to study weak interactions [1 – 4].
The trivalent rare earth ions have been exten-sively studied in the last four decades by absorp-tion and luminescence spectroscopy [5,6]. The electronic spectra of rare earth ions present sharp lines, a feature similar to the atomic or free gaseous ion spectra. This property is a direct consequence of the fact that the 4f electrons are screened from the chemical environment by the outer core of 5s and 5p shells and f – f transitions are forbidden by parity. This small perturbation in the free ion levels by the ligand field has been used to investigate the chemical environment around the central metal ion that can act as a local probe [6,7].
Among the trivalent rare earth ions, europium and terbium present the most intense lumines-cence. The Eu3+ ion is commonly used as a probe
due to its principal emitting level,5D
0and ground state, 7F
0, which are non-degenerate, facilitating the interpretation of the spectral data as com-pared to the Tb3+ ion [5].
The goal of this work is to investigate the influence of the host-guest interaction between
b-cyclodextrin and Eu(DBM)3· 2H2O, in the solid state, on the optical properties of the inclusion compound (luminescence spectrum, emission life-times and energy transfer processes between host and guest). The data indicate that the guest can be accommodated in the host in at least two different ways.
2. Experimental
b-Cyclodextrin hydrate was supplied by Aldrich and used without further purification. The Eu(-DBM)3· 2H2O compound was prepared by the same method reported in the literature [8].
The inclusion compound was prepared by the co-precipitation method, where a b-cyclodextrin aqueous solution was mixed dropwise with an ethanolic solution of rare earth salt under con-stant stirring. The reaction was kept at ca. 40 – 50°C for 24 h, the final volume being reduced to ca. 10 ml. The white solid produced was collected by filtration and washed with water and dried in vacuum at room temperature.
The physical mixture of b-cyclodextrin and Eu(DBM)3· 2H2O in the molar ratio 1:1 was also prepared by gentle grinding of the components until a homogeneous powder was obtained.
X-ray powder patterns were obtained using a RIGAKU diffractometer filtered with a LiF monochromator and employing the CuKa radia-tion as a source (15 kV, 15 mA). The DSC curves were obtained on TA Instruments DSC-2010 with a heating rate of 10°C min−1. under a nitrogen atmosphere. The IR spectra were registered in a MATTSON FTIR-3500, in KBr pellets, in the range of 4000 – 500 cm−1
.
3. Results and discussion
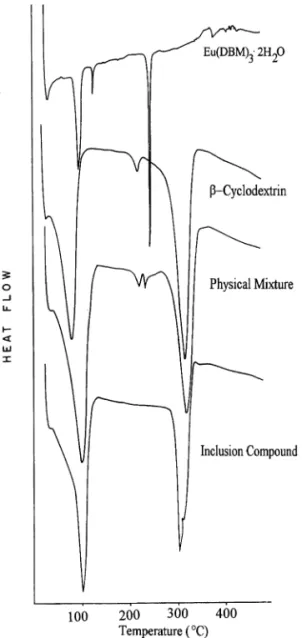
DCS curves of Eu(DBM)3· 2H2O, b -cyclodex-trin, inclusion compound and physical mixture are shown in Fig. 1. At the same time DSC curves of the physical mixture and inclusion compound were compared and it was verified that the former curve showed two endothermic peaks, around 223 and 234°C, non present in the curve of the iso-lated solid. Both peaks are observed in the curves of the host and guest, respectively, suggesting a thermal behavior for the physical mixture that is
Fig. 2. XRD patterns of the precursor salt, b-cyclodextrin, physical mixture and inclusion compound.
Fig. 1. DSC curves of the precursor salt, b-cyclodextrin, physical mixture and inclusion compound.
approximately a superposition of the curves regis-tered for the isolated components.
The X-ray powder patterns of the inclusion compound, b-cyclodextrin, rare earth salt and physical mixture are presented in Fig. 2. The XRD results suggest a less crystalline character for the inclusion product, in contrast with the physical mixture, rare earth salt, or b -cyclodex-trin. This lowering of the crystalline character is possibly a consequence of the loss of water molecules from the host. In the diffractogram of the supramolecular species the peaks at 5.4, 6.3, 7.4, 9.0, 9.5 and 10.4° in the b-cyclodextrin dif-fractogram are absent and those at 4.0, 6.8, 7.9, 9.2 and 10.4° are present in the diffractogram of Eu(DBM)3· 2H2O.
On the other hand, the diffractogram of the physical mixture is approximately the superposi-tion of the diffractograms of the individual com-ponents. These evidences point to the formation of the supramolecular compound by the interac-tion of the rare earth salt with theb-cyclodextrin cavity.
The IR spectra for the inclusion compound,
b-cyclodextrin, rare earth salt and physical mix-ture are presented in Fig. 3. Although the IR technique is not suitable for detection of forma-tion of the inclusion compound [10], in this case it was possible to use it because the aromatic ring vibrational modes of the complex undergo a dras-tic modification in their profiles as compared to the guest spectrum, suggesting that the host-guest interaction occurs through the aromatic moiety of the ligand (DBM). In accordance with the thermal analysis and X-ray results, the physical mixture spectrum can be considered as a superposition of the individual component spectra. These evi-dences reinforce the conclusions from the DSC curves and X-ray diffraction measurements.
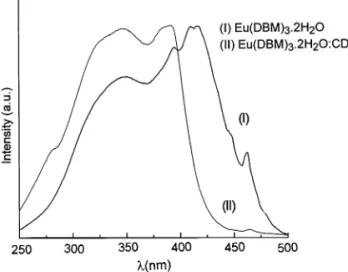
Fig. 4 shows the excitation spectra monitoring the 5
D07F2 hypersensitive transition at 611.2 nm, except for the inclusion compound at low temperature (lem.=623 nm). Comparison be-tween the excitation spectra (Fig. 4) of the precur-sor salt and inclusion compound shows that there are significant differences. The spectrum of the inclusion compound shows a shift of the ligand states towards the higher energy region due to the interaction of the precursor salt with the b -cy-clodextrin cavity.
Fig. 5 presents the emission spectra of the inclusion compound in the solid state at room and liquid nitrogen temperatures. For the sake of comparison with the corresponding spectrum at 298 K, it is also shown the spectrum of the precursor salt at 77 K. These results indicate that no significant structural changes occur in the Eu(-DBM)3· 2H2O compound as the temperature is lowered. All the spectra present sharp lines char-acteristic of the energy level structure of Eu3+
ion,5D
07FJ (J=0 – 4), with direct excitation of a 4f level, 5L
6, around 394 nm.
When we compare the emission spectra of the precursor salt and inclusion compound, for the 5D
07FJ transitions, it is observed a significant change in the profile and splitting of these bands, which corroborates the conclusions obtained by the characterization techniques indicating the for-mation of the inclusion complex.
Fig. 4. Excitation spectra of the inclusion compound and precursor salt at room temperature. The emission was moni-tored at 611 nm.
From Fig. 5 it may be seen that there is a similarity between the spectra of the inclusion compound (298 K) and the precursor salt (77 K) which is not verified for the inclusion compound at low temperature, where it occurs the inversion of the relative intensities. The intensification of some peaks in the 5D
07FJ transitions for the inclusion compound at 77 K is due probably to the steric effects and confinement of the guest into the cavity of theb-cyclodextrin that can behave as a second coordination sphere.
Based on the above results we can suggest that the Eu3+ ions are found in an environment of
very low symmetry, as indicated by the number of lines for each electronic transition. A relevant feature in these spectra is that the cyclodextrin is acting as a selective medium changing drastically
Inspection of the spectra in Fig. 5, in the region of the 5D
0 7F
0 transition, shows the following features: (i) the peak at 576.2 nm presents a much higher intensity for the inclusion compound, at 77 K, when compared with very weak intensity of the peak for the precursor salt; and (ii) in the case of the peak at 579 nm it is observed an inversion of relative intensities, with a decreasing factor of approximately 10 for the inclusion compound.
The same effect occurs for the5
D07F1 transi-tions as noted by the increase of the area under the peaks in the range from 582 to 600 nm for the inclusion compound at 77 K. However, some peaks in this region are quenched, when com-pared with the precursor salt.
In the case of5D 0
7F
2transition it is observed that the peak at 612 nm, for the salt, presents a decrease in intensity for the inclusion compound at 77 K, whereas the peaks around 617 and 623 nm become more intense in the inclusion com-pound. It is observed in the 5
D07F4 transition that there is also an inversion in the intensity of some peaks at 77 K.
The number of components for5 D0
7
FJ tran-sitions (J=0 – 2) in these spectra indicate that there is more then one site symmetry occupied by the Eu3+ in both inclusion compound and
pre-cursor salt. This is more precisely indicated in Table 1.
Fig. 5. Emission spectra of the inclusion compound: (a) at 298; (b) 77; and (c) precursor salt (77 K), under excitation at 394 nm; the inset shows the5D
Table 1
Energies of the5D
07F0–4 transitions (in cm−1) observed in the emission spectra of the precursor salt and inclusion com-pound at 77 K
Transitions Precursor salt Inclusion compound 5D
07F0 17349 17355*
17295* 17283
17265* 17265
5D
07F1 17182 17176*
17006 17024 16995* 16989 16903 16943 16874 16841 16857 16835 16756 16784 16705 16750 16655 16666* 16600 16540 5D
07F2 16474 16474 16410 16420 16367 16361 16339 16339 16313 16302 16197 16260 16228 16160 16129 16207 16108 16144 16134 16087 16051 16036 15959 15984 15878 15893 15802 15827 5D
07F3 15332 15475
15365 15375
15216 15389
5D
07F4 14306 14518 14397 14289 14278 14249 14216 14201 14132 * From amplified spectral region.
could be assigned to the 5D 1
7F
3transition [11]. The 5D
1 emitting level present a much shorter lifetime when compared with the 5
D0 level. These results were corroborated by the lifetimes data where all the values are characteristic of the 5
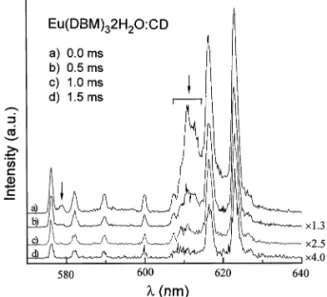
D0 level. This is shown in Table 2. The intensities of the bands corresponding to the transitions5D
0 7F
0 (579 nm) and 5D
0 7F
2 (612 nm), indi-cated by arrows, are decreased when the spectra are recorded with different delay times (Fig. 6). These changes in the intensities suggest that those are caused by simultaneous excitation of Eu3+
ions in more than one site symmetry.
The time resolved emission spectra for the pre-cursor salt were recorded at 77 K with interval delays of 0.1 – 1.0 ms.
The lifetimes of the inclusion compound at 77 K showed three different values (t=0.64, 0.42 and 0.22 ms) for the 5D
0 emitting level (Table 2), while the precursor salt present only one lifetime (t=0.23 ms). This also corrobo-rates the fact that the precursor salt is confined in more than one site symmetry in the inclusion compound. However, it is also plausible that the differences in the lifetimes observed in the inclu-sion compound have a contribution from an en-ergy transfer pathway involving the Eu3+ ion and
a localized electronic state of the b-cyclodextrin.
Fig. 6. Time-resolved emission spectra of the5D
07FJ(J=0,
1 and 2) transitions for the inclusion compound monitored under 394 nm excitation at 77 K. The time delays following excitation are indicated for each spectrum.
the relative intensities of the Stark components of the5D
07FJ transitions.
The time-resolved spectra were obtained for the inclusion compound at 77 K (Fig. 6) with the objective of verifying the possibility of occurrence of transitions arising from excited levels above the 5D
Table 2
Experimental intensity parametersV2,V4and lifetimes (t) for the Eu(DBM)3· 2H2O and Eu(DBM)3· 2H2O:CD compounds, where CD=b-cyclodextrin, at 77 K
V4 (10−20cm2) t(ms) V2(10−20cm2)
Compounds
Eu(DBM)3· 2H2O 32.22 3.63 0.23
8.7
Eu(DBM)3· 2H2O:CD 21.7 0.64,0.42,0.22
The emission intensity,I, of a given transition is proportional to the surface under the emission curve: I='vAN, where 'v is the transition en-ergy andNis the population of the emitting level, 5
D0. From the luminescence spectra at 298 K we have calculated the experimental intensity parameters,V2andV4, for the inclusion and guest compounds, by using the5D
0 7F
2and 5D
07F4 transitions, respectively. The Einstein coefficient of spontaneous emission,A, is given by [12,13].
A=4e
2v3
3'c3 (2J+1)
−1 x %
l
Vl
7
FJU(l)5 D02
(1)
where x=n0(n02+2)2/9 is a Lorentz local field correction,n0 being the index of refraction of the medium. The magnetic dipole allowed 5
D07F1 transition was taken as the reference. The reduced matrix elements in Eq. (1) were taken from Car-nall et al. [14] and an average index of refraction equal to 1.5 was assumed.
The value of theV2intensity parameter for the inclusion compound is smaller than that obtained for the guest. For both compounds theV2 values are very high [15], reflecting the hypersensitive character of the5D
07F2 transition and indicat-ing that europium (III) ions are in a highly polar-izable chemical environment. On the other hand, the value of the V4 parameter for the inclusion compound is twice larger than the one for the guest. These results indicate that the steric effect is more significant in the supramolecular species, as expected and also corroborates the influence of the cyclodextrin, as a second coordination sphere, on the Eu3+ ion.
4. Concluding remarks
The characterization techniques used in the
present work have pointed to the formation of the inclusion compound involving the b-cyclodextrin and the Eu(DBM)3· 2H2O compound. The
5 D0 7
F0 transition for the inclusion compound indi-cated more than one site symmetry occupied by the rare earth ion. The lifetime results indicated that the b-cyclodextrin recognized the three dis-tinct lifetimes due probably to the contribution of different site symmetries being occupied by the rare earth ion and also due to a possible energy transfer pathway involving the cyclodextrin and the Eu3+ ion. These observations show that the b-cyclodextrin interfere in the chemical environ-ment around the Eu3+ ions as a second
coordina-tion sphere. The changes observed in the band profiles and in the relative intensities of the Stark components of the 5
D0 7
FJ transitions, at 298 and 77 K, showed that the cyclodextrin acts selec-tively on the ligand field and 4f – 4f intensities, with respect to the different site symmetries.
From the luminescence spectra of the Eu3+
ions in the precursor salt and in the inclusion compound the intensity parameters were ob-tained. The high values of the V2 intensity parameter are in agreement with the hypersensi-tive character of the 5D
07F2 and indicates that the Eu3+ ion is in a highly polarizable chemical
environment. The differences observed in the in-tensity parameters for these compounds indicate that steric effects are more significant in the supramolecular species.
Acknowledgements
References
[1] J. Szejtli, Cyclodextrin Technology, Kluwer, Dordrecht, 1989.
[2] W. Saenger, Angew Chem. Int. Ed. Engl. 19 (1980) 344. [3] M.L. Bender, M. Komiyana, Cyclodextrin Chemistry,
Springer, New York, 1977.
[4] R.D. Sinisterra, R. Najjar, O.L. Alves, P.S. Santos, C.A. Alves de Carvalho, A.L. Conde da Silva, J. Include. Phenom. 22 (1995) 91.
[5] J.-C.G. Bu¨nzli, G.R. Choppin (Eds.), Lanthanide Probes in Life, Chemical and Earth Sciences-Theory and Prac-tice, Elsevier, Amsterdam, 1989.
[6] G. Blasse, B.C. Grabmaier, Luminescence Materials, Springer, Heidelberg, 1994.
[7] O.L. Malta, Mol. Phys. 42 (1981) 65.
[8] A. Perrotto, R.G. Charles, J. Inorg. Nucl. Chem. 26 (1964) 373.
[9] J.L. Ford, P. Timmins, Pharmaceutical Thermal Analy-sis — Techniques and Applications, Ellis Horwood, Chichester, UK, 1989.
[10] O.L. Alves, S.F. Fonseca, J. Incl. Phenom. 7 (1989) 589. [11] C. Brecher, H. Samelson, A Lempicki, J. Chem. Phys. 43
(3) (1965) 1081.
[12] O.L. Malta, H.F. Brito, J.F.S. Menezes, F.R. Gonc¸alves e Silva, S. Alves Jr., F.S. Farias Jr., A.V.M. de Andrade, J. Lumin. 75 (1997) 255.
[13] O.L. Malta, M.A. Couto dos Santos, L.C. Thompson, N.K. Ito, J. Lumin 69 (1996) 77.
[14] W.T. Carnall, H. Crosswhite, H.M. Crosswhite, Energy Structure and Transition Probabilities of the Trivalent Lanthanides in LaF3, Argonne National Laboratory Re-port, unnumbered, 1977.
[15] H.F. Brito, O.L. Malta, C.A.A. Carvalho, J.F.S. Menezes, L.R. Souza, R. Ferraz, J. Alloys Comp. 275 – 277 (1998) 254.