Stability of molar relationship after non-extraction
Class II malocclusion treatment
Darwin Vaz de Lima1, Karina Maria Salvatore de Freitas2, Marcos Roberto de Freitas3, Guilherme Janson3, José Fernando Castanha Henriques3, Arnaldo Pinzan4
Objective:This study aimed to evaluate the stability of molar relationship ater non-extraction treatment of Class II malocclusion. Methods: The sample comprised 39 subjects (16 females, 23 males) with initial Class II malocclusion treated with no extractions, using ixed appliances. Mean age at the beginning of treatment was 12.94 years, at the end of treatment was 15.14 years and at post-retention stage was 21.18 years. Mean treatment time was 2.19 years and mean time of post-treatment evaluation was 6.12 years. To verify the inluence of the severity of initial Class II molar relation-ship in stability of molar relationrelation-ship, the sample was divided into two groups, one presenting a ½-cusp or ¾-cusp Class II molar relationship, and the other with full-cusp Class II molar relationship. In dental casts from initial, inal and post-retention stages, molar, irst and second premolars and canine relationships were measured. Data obtained were analyzed by dependent ANOVA, Tukey and Pearson’s correlation tests, as well as independent t test between the two groups
di-vided by severity of initial molar relationship. Results: There was a non-statistically signiicant 0.12 mm relapse of molar relationship. The initial severity of Class II molar relationship was not correlated to relapse in the post-retention period. When compared, the two groups showed no diference in relapse of molar relationship. Conclusion: It was concluded that correction of Class II molar relationship is stable and initial severity does not inluence relapse of molar relationship.
Keywords:Corrective orthodontics. Angle Class II malocclusion. Treatment outcomes.
How to cite this article: Lima DV, Freitas KMS, Freitas MR, Janson G, Hen-riques JFC, Pinzan A. Stability of molar relationship ater non-extraction Class II malocclusion treatment. Dental Press J Orthod. 2013 Mar-Apr;18(2):42-54.
Submitted: March 20, 2009 - Revised and accepted: August 16, 2009
Contact address: Karina Maria Salvatore de Freitas
Rua Jamil Gebara, 1-25, apto. 111 - Bauru / SP, Brazil – CEP: 17.017-150 E-mail: [email protected]
1 Professor, Specialization Course in Orthodontics, UNORP.
2 Post-Doctor in Orthodontics, University of Toronto. Head Professor of the
Master Course in Orthodontics, UNINGÁ.
3 Professor of Orthodontics, FOB-USP. 4 Associate Professor of Orthodontics, FOB-USP.
» The author reports no commercial, proprietary or financial interest in the products or companies described in this article.
Objetivo: esse estudo objetivou avaliar a estabilidade da relação molar na má oclusão de Classe II tratada ortodontica-mente sem extrações, visando quantiicar a recidiva e correlacioná-la a alguns fatores. Métodos: a amostra constituiu-se de 39 indivíduos (16 mulheres e 23 homens) com má oclusão de Classe II tratada sem extrações, com aparelhos ixos. A idade inicial média foi de 12,94 anos; na fase inal, foi de 15,14 anos; na pós-contenção, 21,18 anos. A média do tempo de tratamento foi de 2,19 anos e do tempo de avaliação pós-tratamento, de 6,12 anos. Para veriicar a inluência da seve-ridade da relação molar de Classe II inicial na estabilidade da relação molar, a amostra foi dividida em dois grupos, um apresentando relação molar de ½ Classe II ou ¾ de Classe II, e outro apresentando relação molar de Classe II completa. Nos modelos de estudo das três fases estudadas, foram medidas a relação molar, as relações de primeiros e segundos pré--molares e de caninos. Os dados foram analisados pelos testes ANOVA dependente, de Tukey, correlação de Pearson e teste t independente entre dois grupos, divididos pela severidade da relação molar inicial. Resultados: houve recidiva não signiicativa de 0,12mm na relação molar. A severidade inicial da relação molar de Classe II não se correlacionou com a recidiva no período pós-contenção. Quando a amostra dividiu-se em dois grupos, nenhuma diferença foi encontrada na recidiva da relação molar. Conclusão: a correção da relação molar de Classe II é estável e a severidade inicial não exerce inluência sobre a recidiva da relação molar.
INTRODUCTION
Class II malocclusion does not self-correct in
growing patients.8,17 The Class II skeletal pattern
is established early and remains until puberty if no
orthodontic intervention is performed.8
To this date, several authors have discussed the re-lationship of the initial malocclusion characteristics
with the effectiveness of orthodontic treatment22,31,40
and the stability of the corrections obtained.7,33,43
Normally, orthodontic treatment takes a long time and uses complex techniques, usually achieving good results; however, these results may be lost in varying
degrees after the removal of appliances and retainers.38
Orthodontic relapse includes crowding or spacing of teeth, and loss of overbite, overjet correction, and loss of Class II molar relationship correction.
Orthodontic changes of the position of the first
permanent molars have a great tendency to relapse.24
Some authors affirm that Class I molar relationship is more stable compared to others and, over time, the mandibular molar tends to distalize in patients with
Class II malocclusion.17 For Uhde, Sadowsky and
Be-Gole,39 changes that occur in molar relationship are
always towards Class II relation. The changes are of small magnitude and independent of the type of ini-tial malocclusion and the type of treatment. Other authors suggest that, in the long-term, there is mini-mal relapse in molar relationship and that changes in incisor position and intercuspation of the posterior teeth are statistically significant, although not
consid-ered clinically significant.12,39
The stability of Class II malocclusion has been widely studied, however, few studies that have actu-ally evaluated relapse and stability of the correction of Class II molar relationship in models. The studies are mostly directed to a particular type of appliance or treatment protocol.
In this context, the objective of this study was to evaluate the stability of molar relationship in cases with initial Class II malocclusion, treated orthodon-tically without extractions, correlating with factors such as the severity of initial Class II molar relation-ship, treatment, retention and post-retention times. Moreover, the objective was to compare the post re-tention stability of molar relationship between two groups divided according to the severity of the initial Class II molar relationship.
MATERIAL AND METHODS
For the present retrospective study, the sample was obtained from the records of the Department of Orthodontics, Bauru Dental School, University of São Paulo.
The inclusion criteria comprised the following characteristics:
» Angle Class II malocclusion, treated without extractions.
» Presence of erupted permanent teeth up to first molars, at the beginning of orthodontic treat-ment.
» Absence of tooth agenesis and supernumerary teeth.
» No anomalies in size and / or shape of the teeth. » Absence of rotations of the maxillary and man-dibular molars in the initial models, which could influence variable measurement.
» Orthodontic treatment with fixed appliances, which may include the use of headgear and / or Class II intermaxillary elastics.
» Complete orthodontic records, including study models of pre and post treatment and post re-tention records.
All patients in the sample were Caucasian, of both genders. The study models of the pretreatment
(T1 - initial), posttreatment (T2 – inal) and
post-reten-tion phases (T3 - post-retention at least 2 years ater the
end of treatment) were used.
The sample was composed of a total of 39 patients, 16 females and 23 males. The mean age at pretreat-ment was 12.94 ± 1.21 years, the mean age at the end of treatment was 15.14 ± 1.38 years, and the mean age at post-retention was 21.18 ± 2.65 years. The mean treatment time was 2.19 ± 0.83 years. The mean post-treatment time evaluation, (between the final and post-retention stages) was 6.30 ± 2.60 years. At the end of active orthodontic treatment all patients used a removable Hawley plate retainer in the maxillary arch and a bonded fixed retainer from canine to canine in the mandibular arch. The retainers were used, on av-erage, 1.62 ± 0.49 years.
pretreatment was 13.27 ± 1.11 years, the mean age at the end of treatment was 15.10 ± 1.35 years and the mean age at post-retention was 20.18 ± 2.03 years. The mean treatment time was 1.83 ± 0.49 years, the mean retention time was 1.58 ± 0.55 years and the mean time between posttreatment and post-retention phases was 5.29 ± 1.57 years. Group 2 consisted of 23 patients with a complete initial Class II molar relationship. The mean age at pretreatment was 12.71 ± 1.25 years, the mean age at the end of treatment was 15.17 ± 1.42 years and the mean age at post-retention was 21.87 ± 2.84 years. The mean treatment time was 2.45 ± 0.94 years, the mean retention time was 1.69 ± 0.46 years and the mean time between posttreatment and post-retention phases was 6.70 ± of 2.46 years.
The orthodontic records of the selected sample were used to obtain some relevant data for this work. Clini-cal records were examined for therapeutic procedures at pre and posttreatment, and the posttreatment follow-ups. The date of removal of retainers was also observed. These data, together with the patient’s date of birth, al-lowed accurate determination of the total time of treat-ment, control, posttreattreat-ment, post-retention, retention time and age of the patients in the studied phases.
The study models concerning initial, inal and post-retention stages of each patient were evaluated. Study models were photographed with a D-80 camera, with 105 mm close-up lens (AF-S VR Micro Nikkor 105 mm f/2.8G IF-ED, Nikon Corporation, Japan) and circular lash (Nikon Corporation, Japan) with 300 dpi (dots per inch). From each study model, two lateral photographs were obtained, one on the right side and one on the let, with the buccal surfaces of posterior teeth parallel to each other. All photographs were obtained with the same distance between the ob-ject and the lens (31.4 cm), to avoid magniication.
The digital images were inserted into a computer and analyzed with Dolphin Imaging software ver-sion 10 (Dolphin Imaging and Management Solu-tions, Chatsworth, CA, USA). This program mag-nifies each image by means of their size in dpi. For each variable, two points are marked and the distance between them was calculated by the software. The accuracy of measurements was 0.01 mm. For the sta-tistical analysis, the mean right and left sides of each measurement was obtained. The calculated variables are presented in the following topics.
Molar relationship
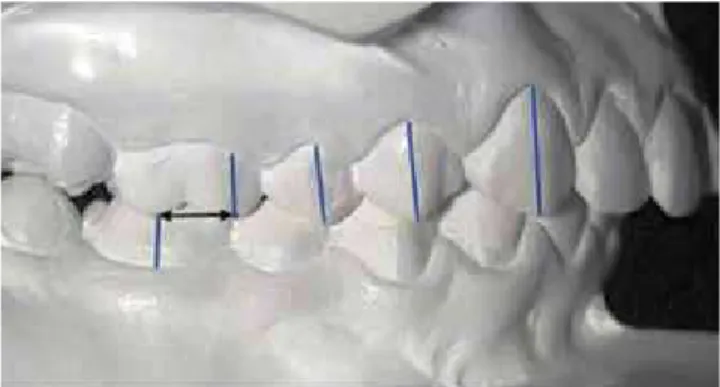
The molar relationship was measured from the tip of the mesiobuccal cusp of the maxillary first molar to the mesiobuccal groove of the mandibular first molar (Fig 1). The average of right and left sides was used.
Second premolar relationship
The relationship of the second premolars was measured from the tip of the buccal cusp of the max-illary second premolar to the distal anatomical con-tact point between the mandibular second premolar and the mesial of the mandibular first molar (Fig 2). The average of right and left sides was used.
First premolar relationship
The relationship of first premolars was measured from the tip of the buccal cusp of the maxillary first premolar to the distal anatomical contact point of the mandibular first premolar and mesial of the mandibu-lar second premomandibu-lar (Fig 3). The average of right and left sides was used.
Canine relationship
The canine relationship was measured from the cusp tip of the maxillary canine to the anatomi-cal contact point between the distal mandibular ca-nine and the mesial of the mandibular first premolar (Fig 4). The average of right and left sides was used.
Statistical analysis Method error
The intra-examiner error was evaluated by taking new measurements of the initial, final and post-reten-tion study models of 15 patients randomly selected, performing a total of 45 pairs of models. The first and second measurements were performed with a time interval of one month. The formula proposed by
Dahlberg11 (Se2 =Σ d2/2n) was applied to estimate the
magnitude of casual errors, while systematic errors
were analyzed by applying the paired t test, according
to Houston.19
Statistical treatment
Descriptive statistics were performed for the
vari-ables at the initial (T1), final (T2) and post-retention
(T3) phases, and for the differences between initial
tial complete Class II molar relationship. Therefore,
the independent t test was applied for all variables
between these two groups.
All tests were performed with the STATISTICA software (Statistica for Windows, Release 6.0, Copy-right StatSoft, Inc. 2001), adopting a significance level of 5%.
RESULTS
Table 1 presents the results of the evaluation of
sys-tematic and casual errors, by evaluating the paired t test
and Dahlberg’ formula,11 applied to all studied variables.
The descriptive statistics results (mean, standard deviation, minimum, maximum and number) of the variables molar relationship (MR), second premo-lars relationship (2PMR), first premopremo-lars relation-ship (1PMR) and canine relationship (CR) in every
evaluated stage (T1, T2 and T3) and periods (T2-T1
and T3-T2) are shown in Tables 2 to 5.
between the final and post-retention stages, (char-acterizing the change during post-retention). There was also descriptive statistics of the ages at initial, final and post-retention stages and the duration of treatment, retention and post-retention evaluation.
To evaluate variable changes between phases, the dependent ANOVA for repeated measures (repeated measures ANOVA) was used and in the presence of a signiicant result, Tukey’s test was applied subsequently.
The Pearson correlation coefficient was calculated to verify the presence of correlation between molar relationship relapse with: severity of initial Class II relationship, treatment time, retention time and time of post-retention evaluation.
To better evaluate the influence of the initial Class II molar relationship severity on the stability of molar relationship, the sample was divided into two groups: Group 1 with ½ -cusp or ¾-cusp initial molar Class II relationship, and Group 2, with ini-Figure 1 - Molar relationship measurement.
Figure 3 - First pre-molars relationship measurement.
Figure 2 - Second pre-molars relationship measurement.
tion times, age at the beginning and end of treatment, and at post-retention stage was assessed.
The choice of the methodology to be used should be based on the objective of the study. Since the purpose of this study was to evaluate the stability and relapse of molar relationship in the post-reten-tion stage, the best method for evaluating molar re-lationship are study models. Although this method does not allow the clinical and radiographic analysis, the study models alone provide information related
to diagnosis and orthodontic treatment.6,15
Further-more, it has been shown that there is a poor associa-tion among the occlusal characteristics and the mor-phology obtained in the lateral cephalograms and better prediction of orthodontic results can be
ob-tained by occlusal indexes than by cephalometrics.1
The fact that occlusal characteristics do not always reflect craniofacial morphology was evidenced by
Pancherz, Zieber and Hoyer,35 who observed
simi-lar cephalometric characteristics when comparing Class II, division 1 and 2, contradicting the wide-spread idea that the severe overbite of Class II divi-sion 2 maloccludivi-sion is related to a more horizontal
skeletal pattern of this malocclusion.21 Although this
Table 6 shows the results of the analysis of vari-ance (ANOVA) and Tukey’s test for the variables molar relationship, relationship of first and second premolars and canines, at the initial, final and post-retention stages.
Table 7 presents the results of the Pearson correla-tion test to evaluate the correlacorrela-tion of the severity of Class II relationship with the post-retention relapse.
Table 8 shows the test results of the Pearson cor-relation test to determine the corcor-relation of relapse and treatment time, retention time and time of post-retention evaluation.
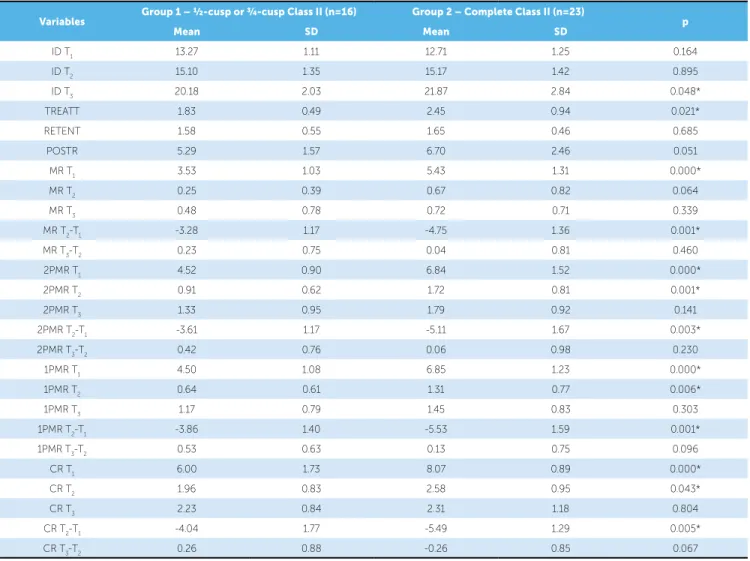
Table 9 presents the results of the independent t test between groups 1 (½-cusp or ¾-cusp Class II) and 2 (complete Class II).
DISCUSSION Methods
From the medical records of each patient general data such as date of birth, gender, type of appliance and mechanics used, date of beginning and end of treatment, duration of the use of the retainers, date of post-retention evaluation were collected. With these data, treatment, retention and posttreatment
evalua-Variables
1st. Measurement
2nd.
Measurement Dahlberg p
Mean SD Mean SD
MR 2.03 1.80 2.08 1.88 0.21 0.183
2PMR 3.47 2.05 3.54 2.05 0.26 0.056
1PMR 3.35 2.15 3.40 2.16 0.16 0.099
CR 4.40 2.29 4.43 2.21 0.27 0.530
Table 1 - Results of t test and Dahlberg formula, applied to the variables molar relationship, second premolar relationship, irst premolar relationship and canine relationship, for estimation of systematic and casual errors, respectively (n=45).
Table 4 - Results of the descriptive statistical analysis for the variable irst pre-molars relationship (1PMR), in all stages and periods evaluated.
Table 2 - Results of the descriptive statistical analysis for the variable molar relationship (MR), in all stages and periods evaluated.
Variables Mean SD Minimum Maximum n
MR T1 4.65 1.52 1.85 8.40 39
MR T2 0.50 0.70 0.00 3.05 39
MR T3 0.62 0.74 0.00 2.80 39
MR T2-T1 -4.14 1.47 -7.15 -0.85 39
MR T3-T2 0.12 0.78 -2.10 2.50 39
Table 3 - Results of the descriptive statistical analysis for the variable second premolar relationship (2PMR), in all stages and periods evaluated.
Variables Mean SD Minimum Maximum n
2PMR T1 5.89 1.73 2.50 9.15 39
2PMR T2 1.39 0.83 0.20 3.55 39
2PMR T3 1.60 0.94 0.00 4.25 39
2PMR T2-T1 -4.50 1.65 -8.20 -0.95 39
2PMR T3-T2 0.21 0.90 -1.60 2.85 39
Variables Mean SD Minimum Maximum n
1PMR T1 5.88 1.64 2.30 9.75 39
1PMR T2 1.03 0.78 0.00 2.80 39
1PMR T3 1.33 0.82 0.00 3.35 39
1PMR T2-T1 -4.85 1.71 -9.40 -0.30 39
Table 5 - Results of the descriptive statistical analysis for the variable canine relationship (CR), in all stages and periods evaluated.
Variables Mean SD Minimum Maximum n
CR T1 7.22 1.64 2.75 10.45 39
CR T2 2.32 0.94 0.55 4.70 39
CR T3 2.28 1.04 0.20 5.55 39
CR T2-T1 -4.89 1.65 -8.85 0.60 39
CR T3-T2 -0.04 0.89 -1.80 2.50 39
Table 6 - Results of the analysis of variance (ANOVA) and Tukey tests for the variables molar relationship, irst and second premolars relationship and ca-nine relationship (n=39), between the initial, inal and post-retention stages (same letters mean no statistically signiicant diference).
* Statistically signiicant diference for p < 0.05.
Variables Initial (T1) Final (T2) Post-retention (T3) p
Mean ± SD Mean ± SD Mean ± SD
MR 4.65 ± 1.52 a 0.50 ± 0.70 b 0.62 ± 0.74 b 0.000*
2PMR 5.89 ± 1.73 a 1.39 ± 0.83 b 1.60 ± 0.94 b 0.000*
1PMR 5.88 ± 1.64 a 1.03 ± 0.78 b 1.33 ± 0.82 b 0.000*
CR 7.22 ± 1.64 a 2.32 ± 0.94 b 2.28 ± 1.04 b 0.000*
Table 7 - Results of the Pearson’s correlation test to verify the correlation of the severity of the Class II relationship with the post-retention relapse.
* Statistically signiicant diference for p < 0.05.
Correlations r p
MR T1 x MR T3 0.107 0.515
MR T1 x MR T3-T2 -0.173 0.292
2PMR T1 x 2PMR T3 0.143 0.382
2PMR T1 x 2PMR T3-T2 -0.159 0.331
1PMR T1 x 1PMR T3 -0.012 0.938
1PMR T1 x 1PMR T3-T2 -0.172 0.293
CR T1 x CR T3 -0.049 0.763
CR T1 x CR T3-T2 -0.354 0.026*
Table 8 - Results of the Pearson’s correlation test to verify the correlation of the relapse with treatment time, retention time and time of post-retention evaluation.
* Statistically signiicant diference for p < 0.05.
Correlations r p
MR T3-T2 x TREATT -0.205 0.210
MR T3-T2 x RETENT -0.006 0.968
MR T3-T2 x POSTR -0.373 0.019*
Table 9 - Results of independent t test, between the groups divided in ½-cusp or ¾-cusp Class II and complete Class II.
* Statistically signiicant diference for p < 0.05.
Variables Group 1 – ½-cusp or ¾-cusp Class II (n=16) Group 2 – Complete Class II (n=23) p
Mean SD Mean SD
ID T1 13.27 1.11 12.71 1.25 0.164
ID T2 15.10 1.35 15.17 1.42 0.895
ID T3 20.18 2.03 21.87 2.84 0.048*
TREATT 1.83 0.49 2.45 0.94 0.021*
RETENT 1.58 0.55 1.65 0.46 0.685
POSTR 5.29 1.57 6.70 2.46 0.051
MR T1 3.53 1.03 5.43 1.31 0.000*
MR T2 0.25 0.39 0.67 0.82 0.064
MR T3 0.48 0.78 0.72 0.71 0.339
MR T2-T1 -3.28 1.17 -4.75 1.36 0.001*
MR T3-T2 0.23 0.75 0.04 0.81 0.460
2PMR T1 4.52 0.90 6.84 1.52 0.000*
2PMR T2 0.91 0.62 1.72 0.81 0.001*
2PMR T3 1.33 0.95 1.79 0.92 0.141
2PMR T2-T1 -3.61 1.17 -5.11 1.67 0.003*
2PMR T3-T2 0.42 0.76 0.06 0.98 0.230
1PMR T1 4.50 1.08 6.85 1.23 0.000*
1PMR T2 0.64 0.61 1.31 0.77 0.006*
1PMR T3 1.17 0.79 1.45 0.83 0.303
1PMR T2-T1 -3.86 1.40 -5.53 1.59 0.001*
1PMR T3-T2 0.53 0.63 0.13 0.75 0.096
CR T1 6.00 1.73 8.07 0.89 0.000*
CR T2 1.96 0.83 2.58 0.95 0.043*
CR T3 2.23 0.84 2.31 1.18 0.804
CR T2-T1 -4.04 1.77 -5.49 1.29 0.005*
study did not use occlusal indexes, molar relation-ship measurement, a characteristic that can be well
observed in study models, was used.6,9
Andrews4 defined the six keys to normal occlusion
based exclusively on the information contained in 120 study models, and these six keys are valuable pa-rameters to obtain an ideal static occlusion. Similarly, the occlusal evaluation is an important research tool
regarding the results of orthodontic treatments.2,7,43
Therefore, this study performed the measurement of molar relationship on study models, a method that is simple and objective, and has previously been used in several studies.10,12,23,39
All measurements were made from photographs of the study models of the three phases for each patient. The study models were photographed with a D-80 camera, with a 105 mm close-up lens and circular flash (Nikon Corporation, Japan) with 300 dpi. The use of this lens prevents any distortion of the image. From each model, two lateral photographs were ob-tained, one of the right side and one of the left, with the buccal surfaces of the posterior teeth parallel to each other. The digital images were inserted into a computer and analyzed with Dolphin Imaging soft-ware version 10 (Dolphin Imaging and Management Solutions, Chatsworth, CA, USA). This program magnifies each image by means of the size in dpi, to be informed by the examiner. For each variable, two points are marked and the distance between them is thus calculated by the software. The accuracy of mea-surements was 0.01 mm. For the statistical analysis, the average of the right and left sides of each of the measures was obtained.
The main advantage of this measurement method is that the images, once inserted in the Dolphin soft-ware, can be magnified on the computer screen, or even displayed with a multimedia projector, and the points marked with the aid of a mouse connected to the computer. This possibility of image magnifica-tion greatly facilitates the visualizamagnifica-tion of the point to be marked, minimizing the possible methodological errors, as shown in Table 1.
According to Houston,19 for an accurate analysis,
the object of study should be reevaluated a minimum of 25 times. Thus, to evaluate the intra-examiner er-ror, new measurements of the studied variables (mo-lar relationship, relationship of second premo(mo-lars,
re-lationship of first premolars and canine rere-lationship, Figures 1, 2, 3 and 4, respectively) were performed on study models of 15 patients randomly selected from the total sample, a total of 45 pairs of models, mea-sured one month after the first measurement. The re-sults of the two measurements were then subjected
to the formula proposed by Dahlberg,11 to obtain the
casual errors. To obtain the systematic errors, the
paired t test was applied.
The results demonstrated the absence of system-atic errors. Casual errors were minimum and hence acceptable (Table 1). The greatest casual error oc-curred for the canine relationship (CR), with value of 0.27 mm. The absence of significant systematic errors and the minimum value of the casual errors observed in this study may result from both the standardization and accuracy of the measurements, and also by the simplicity and objectivity of the measurement used, making this method very reliable and reproducible.
Sample
Since the main objective of this study was to eval-uate the stability of molar relationship in the long-term, the selection of the sample was performed aiming to eliminate the largest possible number of factors that could influence the results. Therefore, to evaluate the stability of molar relationship, and also the relationships of first and second premolars and canines, it was necessary to standardize the ini-tial characteristics and the several factors related to the orthodontic treatment. Therefore, the initial malocclusion was calibrated, regarding the type and minimum severity, the treatment protocol used, and the type of appliance.
Therefore, the basic criteria for sample selection was initially Angle Class II malocclusion, with
mo-lar relationship of at least half-cusp Class II.42 Cases
could not present rotation of the maxillary and man-dibular molars in the initial models, which could in-fluence the measurement of the variables. In addition, all patients should have been treated with fixed
orth-odontic appliances14,37 in both maxillary and
man-dibular arches, without extractions.14,20,37 All patients
used headgear in the maxillary arch and Class II elas-tics during orthodontic treatment.
were excluded, which may influence the interpreta-tion of the results of this study. It is known that the relapse of the skeletal changes of functional orthope-dic appliances occurs after removal of the appliances,
and this could influence the results.32,34 In addition,
distalizers also perform a quick distalization of the maxillary molars and generally cause a distal tipping of the crown of these teeth, relapse may be increased
in these cases, due to these factors.27,30
The presence of permanent teeth erupted up to the first molars and the absence of supernumerary teeth and agenesis constituted criteria of sample selection, since the absence of permanent teeth, the presence of supernumerary and some anomalies related to the shape of the teeth can interfere with the normal de-velopment of the occlusion, producing malocclusions that require correction with a different orthodontic mechanics, increasing the complexity and difficulty
of the orthodontic treatment, and stability.6,25
The sample consisted of a total of 41 patients, se-lected from the records of the Discipline of Ortho-dontics, treated by Graduate students (from the De-partment of Pediatric Dentistry, Orthodontics and Public Health, Bauru Dental School). Only those cases that had complete orthodontic records were se-lected, with all the forms properly completed, pre-senting the study models from initial, final and at least two years posttreatment stages.
The time of posttreatment evaluation, in the post-retention stage, is reasonable to observe the stability, one of the purposes of this study, because, according
to Al Yami, Kuijpers-Jagtman and van’t Hof,3 about
half of the total relapse occurs in the first two years after the end of treatment, with good stability for most of the characteristics in the period of more than five years posttreatment.
The sample selection did not involve the factor quality of finishing, which did not serve as a crite-rion for exclusion or inclusion. However, assess-ing the Class II cases treated without extractions in
FOB-USP, Barros6 found that even those cases where
there is need for greater patient cooperation,20,41 were
finished, in general, in an acceptable manner. Fur-thermore, it has been previously demonstrated that the quality of finishing is not related to the long-term results of orthodontic treatments, and an excellent
finishing does not guarantee stability.13,29,33
RESULTS
Molar relationship
The measurement of the initial Class II molar re-lationship showed a mean value of 4.65 mm, and was reduced to 0.50 mm after treatment. For the post-retention evaluation, in the long-term, 0.62 mm was found (Table 2). This demonstrates a correction with treatment of 4.14 mm and a minimum relapse of only 0.12 mm (Table 2). As shown in Table 6, after per-forming the ANOVA and Tukey tests, a statistically significant correction with treatment and stability in the post-retention period could be noted, since there was no statistically significant difference in the mo-lar relationship between the final and post-retention stages. In other words, the molar relationship showed to be stable in the post-retention phase.
The results of this study are in agreement with
previous findings in the literature.10,12,23,39
Canut and Arias,10 evaluating Class II division 2
cases, found a mean of post-retention relapse of molar relationship of 0.6 mm, and all patients had a good molar occlusion in the post-retention phase. The au-thors considered the molar relationship stable at the end of the post-retention period.
Kim and Little23 found even an improvement in
molar relationship in the post-retention period evalu-ating Class II division 2 cases. At the end of treat-ment, the cases had a mean value of 1.3 mm for the molar relationship and, in post-retention stage, this value reduced to 1.2 mm, suggesting an improvement in the molar relationship of 0.1 mm.
Uhde, Sadowsky and BeGole,39 evaluating Class I
and Class II cases in the post-retention stage, reported that the mean change in molar relationship is always in relation to the Class II, however, these changes are not relevant, (about 0.50 mm). However, besides including Class I and Class II cases, which directly influences the results, the authors also included cases treated with and without extractions.
However, Fidler et al12 found a significant relapse
at the end of treatment, and in the present study, the final treatment outcome of the Class II was not con-sidered for the sample selection.
The literature shows stability of the molar rela-tionship, especially in Class II, division 2 cases. Re-garding the Class II division 1 malocclusion, this study showed slightly better results than those found
in the literature.12
Second premolar relationship
The initial measurement of the second premo-lars relationship presented a mean value of 5.89 mm, being reduced to 1.39 mm after treatment. For the post-retention evaluation, in the long-term, 1.60 mm was found (Table 3). This demonstrates a correction of 4.50 mm, and a relapse of 0.21 mm (Table 3). As shown in Table 6, after performing the ANOVA and Tukey tests, a statistically significant correction with treatment and stability in the post-retention period could be noted, since there was no statistically signifi-cant difference of the second premolars relationship between the final and post-retention stages.
The study of Kim and Little23 showed the same trend,
however, in the inal stage, the value of the premolars re-lationship was slightly higher than normal, and this value remained higher in the posttreatment stage. The initial value of the Class II premolars relationship was 4.6 mm, being corrected to 2.2 mm at the end of treatment and relapsed to 2.5 mm in the post-retention stage.
First premolar relationship
The initial measurement of the first premolars re-lationship presented a mean value of 5.88 mm, being reduced to 1.03 mm after treatment. For the post-retention evaluation, in the long-term, 1.33 mm was found (Table 4). This demonstrates a correction of 4.85 mm, and a relapse of 0.30 mm (Table 4). As shown in Table 6, after performing the ANOVA and Tukey tests, a statistically significant correction with treatment and stability in the post-retention period could be noted, since there was no statistically sig-nificant difference in the first premolars relationship between the final and post-retention stages.
Canine relationship
The initial measurement of the canine relation-ship presented a mean value of 7.22 mm, being
re-duced to 2.32 mm after treatment. For the post-retention evaluation, in the long-term, 2.28 mm was found (Table 5). This shows a correction of 4.89 mm, and an improvement in the post-retention period of 0.04 mm (Table 5). As shown in Table 6, after performing the ANOVA and Tukey tests, a sta-tistically significant correction with treatment and a complete stability in the post-retention period could be noted, since there was no statistically significant difference of the canine relationship between the fi-nal and post-retention stages, and even a small im-provement could be seen.
Kim and Little23 found results similar to the
pres-ent study. The initial Class II canine relationship had value of 5.3 mm, and at the end it was corrected to 1.6 mm and remained stable, showing the same value of 1.6 mm in the post-retention stage.
Correlations
To verify the correlation between the severity of the Class II relationship with the post-retention re-lapse, and the relapse of Class II molar relationship with treatment time, retention time and time of post-retention evaluation, the Pearson correlation test was used (Tables 7 and 8).
There was a correlation of the initial canine rela-tionship with relapse (Table 7).
There was correlation of molar relationship relapse with the time of post-retention evaluation (Table 8). However, this correlation was negative, indicating that the longer the time of post-retention evaluation, the lower the relapse of molar relationship. This find-ing seems unreasonable; however, since patients were mostly young, at the end of orthodontic treatment, they still showed growth in the post-retention stage. As the growth tends to improve the relationship of
skeletal bases,18 it is natural that the if time has passed
until the post-retention evaluation, the patient will have more growth, favoring the stability of the cor-rection of the Class II molar relationship.
Intergroups comparison
ini-tial complete Class II molar relationship. Therefore
the independent t test was applied for all variables
between these two groups.
There was compatibility between the two groups for the initial and final ages, and only the post-reten-tion age showed a statistically significant difference (Table 9). Subjects in Group 2 (complete Class II) had an older age in the post-retention stage than the subjects in Group 1. However, despite the complete Class II group had presented an older age in the post-retention stage, the time of post-post-retention evaluation of this group was not statistically significant higher than the group with ½-cusp and ¾-cusp Class II. The retention time was also compatible between the two groups studied (Table 9).
Regarding treatment time, the group with com-plete Class II showed longer treatment than the ½-cusp and ¾-cusp Class II group, and this dif-ference was statistically significant (Table 9). This was expected since it is known that the severity of malocclusion, especially the severity of the Class II, when treated without extractions, can significantly
increase treatment time.6,20,40
Regarding the initial molar relationship, as group selection was based on the severity of this relation-ship, a significant difference between the groups, was expected (Table 9). Obviously, the complete Class II group had a significantly higher value than the group with less severity. The molar relationship at the end of treatment and at the post-retention stage did not differ between the two groups (Table 9). There was also a difference in the amount of correction with treatment, which also was expected, because if the Class II molar relationship was more severe in Group 2, a greater correction of this relationship was really necessary in this group (Table 9). The molar relationship relapse between the two groups did not present a statistically significant difference, however, it was observed that the molar relationship presented a relapse of 0.23 mm in the group with less severity and only 0.04 mm in the group with greater sever-ity. This evidence reinforces the findings of this study that there is no relationship of the initial Class II se-verity with molar relationship relapse.
The same pattern of results was observed for the first and second premolars and canine relationship. There were statistically significant differences
be-tween the two groups for these relationships in the
initial (T1) and final stage (T2) and the change with
treatment (T2-T1) (Table 9). For the relationships at
the beginning of treatment, as explained above for the molar relationship, this result was expected due to the greater Class II severity in Group 2. Thus, it was also expected that the correction with treatment was greater, as confirmed by the results. However, there was also a significant result for these relation-ships at the end of treatment. Group 2, with complete Class II, presented a deficient finishing for the pre-molars and canine relationships.
A very important factor to be considered is the need for patient cooperation. The successful Class II malocclusion treatment without extrac-tions is extremely connected to patient coopera-tion. It should be noted that a severe initial maloc-clusion, demands greater need for patient
coopera-tion to achieve a satisfactory final result.6,42
Accord-ing to Barros,6 the treatment of a complete Class
II without extraction, in relation to two maxillary premolar extractions, requires approximately twice the degree of patient compliance.
Due to the fact that Group 2 includes only com-plete Class II malocclusion cases, it could be as-sumed that the greater severity of molar relationship at the beginning of treatment and hence the greatest amount of correction during treatment would
influ-ence the maintenance of long-term results.28
How-ever, this association was not confirmed by the pres-ent study, since both groups had a stability without statistically significant differences for the molar, pre-molar and canine relationships.
Araki5 also found no major posttreatment changes
in the group where the change of molar relationship was higher during treatment, and speculated that it probably occurred due to the proper retention of the dental relations obtained.
By studying the stability in the long-term post-treatment of Class II malocclusion by means of the
Herbst appliance, Hansen, Pancherz and Hägg16
FINAL CONSIDERATIONS
It is considered that the stability of the correction of dental relationships, such as molar and canine rela-tionships, are primary goals of a successful orthodon-tic treatment.
The stability of dental relationships is the most
important aim to be achieved,36 because relapse was
clearly considered, in a clinical assessment of dentists and patients, as the cause of dissatisfaction in relation to orthodontic treatment. The posttreatment changes of the skeletal characteristics have secondary impor-tance, since they are not visible in the clinical evalua-tion, but should also be aimed, because these changes
may reflect changes in tooth position.5
The present study demonstrated a relative occlusal stability of the molar, second and first premolars and canine relationships, as the posttreatment changes were minimal. This is a very important data for plan-ning and treating the cases, because, apart from the cephalometric data of the patients, it is known that at least the occlusal relationship, considered as the most important, is almost maintained in the long-term.
It is also important to highlight that there is a wide
individual variability of stability and relapse, since it has a multifactorial cause, and there are several fac-tors related to it, such as craniofacial growth, patient
compliance with the use of retainers.26
CONCLUSIONS
According to the studied sample and to the meth-odology used, it can be concluded that:
» There was a non significant relapse of molar re-lationship, on average 0.12 mm. The relapses of premolars and canine relationships were also not significant.
» There was a significant correlation only be-tween molar relationship relapse and time of post-retention evaluation.
» When the sample was divided into two groups, with half-cusp and ¾-cusp Class II and with complete Class II at the beginning of treatment, no difference in the relapses of molar, premolars and canine relationships could be found . » The Class II molar relationship correction
1. Ackerman JL, Proit WR. Soft tissue limitations in orthodontics: treatment planning guidelines. Angle Orthod. 1997;67(5):327-36.
2. Al Yami EA, Kuijpers-Jagtman AM, Vant Hof MA. Assessment of biological changes in a nonorthodontic sample using the PAR index. Am J Orthod Dentofacial Orthop. 1998;114(2):224-8.
3. Al Yami EA, Kuijpers-Jagtman AM, Vant Hof MA. Stability of orthodontic treatment outcome: follow-up until 10 years postretention. Am J Orthod Dentofacial Orthop. 1999;115(3):300-4.
4. Andrews LF. The six keys to normal occlusion. Am J Orthod. 1972;62(3):296-309.
5. Araki JDV. Comparação cefalométrica da estabilidade do tratamento da má oclusão de Classe II realizado sem e com a extração de dois pré-molares superiores [dissertação]. Bauru (SP): Universidade de São Paulo; 2007.
6. Barros SEC. Avaliação do grau de eiciência do tratamento da Classe II realizado sem extrações e com extrações de dois pré-molares superiores [dissertação] Bauru (SP): Universidade de São Paulo; 2004.
7. Birkeland K, Furevik J, Bøe OE, Wisth PJ. Evaluation of treatment and posttreatment changes by the PAR Index. Eur J Orthod.
1997;19(3):279-88.
8. Bishara SE, Hoppens BJ, Jakobsen JR, Kohout FJ. Changes in the molar relationship between the deciduous and permanent dentitions: a longitudinal study. Am J Orthod Dentofacial Orthop. 1988;93(1):19-28. 9. Brambilla AC. Comparação dos resultados oclusais do tratamento de
Classe II realizado com extrações de dois pré-molares, com a terapêutica utilizando as extrações de quatro pré-molares [dissertação]. Bauru (SP): Universidade de São Paulo; 2002.
10. Canut JA, Arias S. A long-term evaluation of treated Class II division 2 malocclusions: a retrospective study model analysis. Eur J Orthod. 1999;21(4):377-86.
11. Dahlberg G. Statistical methods for medical and biological students. New York: Interscience; 1940.
REFERENCES
12. Fidler BC, Artun J, Joondeph DR, Little RM. Long-term stability of Angle Class II, division 1 malocclusions with successful occlusal results at end of active treatment. Am J Orthod Dentofacial Orthop.
1995;107(3):276-85.
13. Freitas KM, Janson G, Freitas MR, Pinzan A, Henriques JF, Pinzan-Vercelino CR. Inluence of the quality of the inished occlusion on postretention occlusal relapse. Am J Orthod Dentofacial Orthop. 2007;132(4):428.e9-14. 14. Graber TM, Vanarsdall RLJ. Orthodontics: current principles and
techniques. St. Louis: Mosby; 1994.
15. Han UK, Vig KW, Weintraub JA, Vig PS, Kowalski CJ. Consistency of orthodontic treatment decisions relative to diagnostic records. Am J Orthod Dentofacial Orthop. 1991;100(3):212-9.
16. Hansen K, Pancherz H, Hagg U. Long-term efects of the Herbst appliance in relation to the treatment growth period: a cephalometric study. Eur J Orthod. 1991;13(6):471-81.
17. Harris EF, Behrents RG. The intrinsic stability of Class I molar relationship: a longitudinal study of untreated cases. Am J Orthod Dentofacial Orthop. 1988;94(1):63-7.
18. Harris EF, Vaden JL, Dunn KL, Behrents RG. Efects of patient age on postorthodontic stability in Class II, division 1 malocclusions. Am J Orthod Dentofacial Orthop. 1994;105(1):25-34.
19. Houston WJB. The analysis of errors in orthodontic measurements. Am J Orthod. 1983;83(5):382-90.
20. Janson G, Barros SE, Freitas MR, Henriques JF, Pinzan A. Class II treatment eiciency in maxillary premolar extraction and nonextraction protocols. Am J Orthod Dentofacial Orthop. 2007;132(4):490-8.
21. Karlsen AT. Craniofacial characteristics in children with Angle Class II div. 2 malocclusion combined with extreme deep bite. Angle Orthod. 1994;64(2):123-30.
22. Kim JC, Mascarenhas AK, Joo BH, Vig KW, Beck FM, Vig PS.
34. Pancherz H, Ruf S, Kohlhas P. Efective condylar growth and chin position changes in Herbst treatment: a cephalometric roentgenographic long-term study. Am J Orthod Dentofacial Orthop. 1998;114(4):437-46. 35. Pancherz H, Zieber K, Hoyer B. Cephalometric characteristics of Class II
division 1 and Class II division 2 malocclusions: a comparative study in children. Angle Orthod. 1997;67(2):111-20.
36. Sadowsky C, Sakols EI. Long-term assessment of orthodontic relapse. Am J Orthod. 1982;82(6):456-63.
37. Salzmann JA. Practice of Orthodontics. Philadelphia: J. B. Lippincott Company; 1966.
38. Thilander B. Orthodontic relapse versus natural development. Am J Orthod Dentofacial Orthop. 2000;117(5):562-3.
39. Uhde MD, Sadowsky C, Begole EA. Long-term stability of dental relationships after orthodontic treatment. Angle Orthod. 1983;53(3):240-52.
40. Valarelli FP. Relação entre o grau de severidade e o sucesso do tratamento sem extração da má oclusão de Classe II [tese]. Bauru (SP): Universidade de São Paulo; 2006.
41. Vig KW, Weyant R, Vayda D, O’Brien K, Bennett E. Orthodontic process and outcome: eicacy studies — strategies for developing process and outcome measures: a new era in orthodontics. Clin Orthod Res. 1998;1(2):147-55.
42. Wheeler TT, McGorray SP, Dolce C, Taylor MG, King GJ. Efectiveness of early treatment of Class II malocclusion. Am J Orthod Dentofacial Orthop. 2002;121(1):9-17.
43. Woods M, Lee D, Crawford E. Finishing occlusion, degree of stability and the PAR index. Aust Orthod J. 2000;16(1):9-15.
23. Kim TW, Little RM. Postretention assessment of deep overbite correction in Class II Division 2 malocclusion. Angle Orthod. 1999;69(2):175-86. 24. Litowitz R. A study of the movements of certain teeth during and
following orthodontic treatment. Angle Orthod. 1948;18(3):113-31. 25. Little RM. Stability and relapse of mandibular anterior alignment:
University of Washington studies. Semin Orthod. 1999;5(3):191-204. 26. Little RM, Wallen TR, Riedel RA. Stability and relapse of mandibular
anterior alignment — irst premolar extraction cases treated by traditional edgewise orthodontics. Am J Orthod. 1981;80(4):349-65.
27. Mavropoulos A, Karamouzos A, Kiliaridis S, Papadopoulos MA. Eiciency of noncompliance simultaneous irst and second upper molar distalization: a three-dimensional tooth movement analysis. Angle Orthod. 2005;75(4):532-9.
28. Nashed RR, Reynolds IR. A cephalometric investigation of overjet changes in ifty severe Class II division I malocclusions. Br J Orthod. 1989;16(1):31-7.
29. Nett BC, Huang GJ. Long-term posttreatment changes measured by the American Board of Orthodontics objective grading system. Am J Orthod Dentofacial Orthop. 2005;127(4):444-50.
30. Ngantung V, Nanda RS, Bowman SJ. Posttreatment evaluation of the distal jet appliance. Am J Orthod Dentofacial Orthop. 2001;120(2):178-85. 31. O’Brien KD, Robbins R, Vig KW, Vig PS, Shnorhokian H, Weyant R. The
efectiveness of Class II, division 1 treatment. Am J Orthod Dentofacial Orthop. 1995;107(3):329-34.
32. Omblus J, Malmgren O, Pancherz H, Hägg U, Hansen K. Long-term efects of Class II correction in Herbst and Bass therapy. Eur J Orthod. 1997;19(2):185-93.