PB 69
* PhD, Professor, Discipline of Orthodontics, School of Dentistry of Marília, University of Marília.
** PhDs, Assistant Professors, Department of Pediatric Dentistry, Area of Orthodontics; ***Head Professor, Discpline of Ortho-dontics – School of Dentistry of Piracicaba, State University of Campinas.
**** PhD, Coordinator; ***** Professor – Master’s Course in Orthodontics, São Leopoldo Mandic Dental Research Center. ABSTRACT: This study has defined the cephalometric values of the Craniofacial Analysis of the Tweed Founda-tion for a sample of Brazilian subjects. The sample consisted of 211 cephalometric radiographs from subjects aged 12-15, which were divided into two groups: Class II group, with 168 lateral teleradiographs (cephalograms) of white Brazilian subjects, with Angle Class II, division 1 malocclusion, of both genders (82 males and 86 females); and the Control Group, with 43 lateral teleradiographs (cephalograms) of subjects whose occlusion was clinically excellent, and also of both genders (21 males and 22 females). The teleradiographs were selected from the files of the Department of Orthodontics, School of Dentistry of Piracicaba, State University of Campinas, previously to the orthodontic treatment. The results demonstrated no sexual dimorphism for each group, as attested by the Stu-dent’s t-test. The exploratory analysis (± 0.5 standard deviation) enabled the tolerance limits to be determined and a Craniofacial Analysis Table to be constructed using the respective cephalometric intervals. In addition, the dif-ference between the two groups was not statistically significant according to the maxilla position. The maxilla was in a good position in relation to the cranial base. On the other hand, the mandible was retruded in relation to the cranial base in the Class II cases. The skeletal pattern was not defined because only the Facial Height Index (FHI) showed a vertical pattern in Class II subjects, while the Y Axis, SN.PlO, SN.GoMe and FMA values did not show any statistically significant difference between the groups. The Class II division 1 subjects showed lower incisors more labially tipped and a convex facial profile.
DESCRIPTORS: Malocclusion, Angle Class II; Cephalometry; Diagnosis.
RESUMO: A pesquisa definiu os valores cefalométricos da Análise Craniofacial da Fundação Tweed em amostra de brasileiros. O estudo constava de 211 telerradiografias tomadas previamente ao tratamento ortodôntico de indivíduos na faixa etária de 12 a 15 anos, as quais foram divididas em dois grupos: o Grupo Classe II, com 168 telerradiografias registradas em norma lateral de indivíduos leucodermas, maloclusão Classe II, divisão 1 de An-gle, de ambos os gêneros (82 do gênero masculino e 86 do feminino); e o Grupo Controle, com 43 telerradiografias registradas em norma lateral de indivíduos com oclusão clinicamente excelente, também de ambos os gêneros (21 do gênero masculino e 22 do feminino). As telerradiografias foram selecionadas no arquivo da Disciplina de Ortodontia da Faculdade de Odontologia de Piracicaba, Universidade Estadual de Campinas. Os resultados de-monstraram não existir dimorfismo sexual dentro de cada grupo, comprovado pelo Teste t de Student. A análise exploratória (± 0,5 desvio padrão) tornou possível a determinação dos limites de tolerância e a elaboração de uma Tabela da Análise Craniofacial com os respectivos intervalos cefalométricos. Observou-se que não houve diferença significativa na posição de maxila entre os grupos estudados, ou seja, a maxila apresentou-se bem posicionada em relação à base do crânio. Por outro lado, a mandíbula apresentou-se retruída em relação à base do crânio nos casos de Classe II. O padrão esquelético não ficou definido, pois somente o IAF apresentou um padrão vertical na Classe II, enquanto os valores de Eixo Y, SN.PlO, SN.GoMe e FMA não apresentaram diferença significativa entre os grupos estudados. A Classe II divisão 1ª apresentou os incisivos inferiores mais inclinados para vestibular e o perfil facial convexo.
DESCRITORES: Maloclusão de Angle Classe II; Cefalometria; Diagnóstico.
Craniofacial analysis of the Tweed Foundation in Angle Class II,
division 1 malocclusion
Análise craniofacial da Fundação Tweed na maloclusão Classe II,
divisão 1 de Angle
Paulo César Tukasan*
Maria Beatriz Borges de Araújo Magnani** Darcy Flávio Nouer***
70 71
70 71
INTRODUCTION
The process of judgment of an existent prob-lem is called diagnosis and depends on the largest possible quantity of collected data. The orthodontic diagnosis of malocclusion also depends on early correct detection and it is a fundamental point for the treatment planning.
Therefore, the establishment of any orthodon-tic treatment is marked by the identification of present abnormalities, and similar problems are frequently systematized for convenience purposes. This procedure, called classification, has always been one of the great challenges in the history of Orthodontics. Angle1 (1907) classified the
maloc-clusions based on occlusal relationships, consid-ering the first permanent molar as the “key” of occlusion.
In 1966, Merrifield8 developed a specific guide
to analyze the patient’s facial profile, introduc-ing a profile line, tangent to the soft chin and the most protuberant point on the lip, which he de-nominated the “Z line”. That line was extended to the horizontal Frankfort plane so as to compose the Z angle. The author observed that the Z angle presented a medium value of 80° for adults and 78° for subjects from 11 to 15 years of age, with harmonic faces and normal values of FMA, FMIA and IMPA.
Soon after that, Merrifield, Gebeck9 (1989)
analyzed the dimensions of the lower face in com-parison with the “anterior facial height” (AFH) and “posterior facial height” (PFH). They demonstrated that the success in the correction of Class II maloc-clusion depended on the control of the anterior and posterior facial heights; in other words, it depended on the control of the vertical dimension16.
Horn4 (1992) proposed the facial height index
(FHI) during the orthodontic treatment, in order to establish a relationship between AFH and PFH. A balanced FHI ratio should present values between 0.65 and 0.75.
In an attempt to improve the diagnostic and prognostic tools, Gramling3 (1995) used five
ceph-alometric measurements – FMA, ANB, occlusal plane inclination, FMIA and SNB – to determine the “probability index”, which suggested mean val-ues for the treatment success. Hence, FMA should have 20° to 30°; ANB, 6° or less; the occlusal plane, 7° or less; FMIA, 60° or more; and SNB, 80° or more.
Angle Class II, division 1 malocclusion rep-resents the second most prevalent malocclusion in the Brazilian population, according to Nouer13
(1966) and Silva Filho et al.15 (1989). However, the
simple definition of Class II, division 1 malocclu-sion is too broad, since it comprises an enormous variety of dental and skeletal disturbances, with only one common feature: the Class II molar and canine relationships6,7,11,14,17,18. For this reason, it
is quite difficult for beginners in orthodontics to identify the dentoskeletal components implicated in this type of malocclusion2,12.
Searching for a larger number of significant data for the success of diagnosis and treatment planning has been a constant challenge. In this process, a differential diagnosis analysis system was developed by researchers of the “Charles Tweed International Foundation”10. This
diagno-sis protocol condiagno-sists of facial, skeletal pattern, and dental analyses, allowing the orthodontist to determine the area showing greater disharmony and also supplying professionals with a strategic treatment guide.
The Differential Diagnosis System for Cranio-facial Analysis of the Tweed Foundation comprises six cephalometric measurements with quite sig-nificant individual values. To each cephalometric measurement was given a numerical value, named “difficulty factor”. Thus it is possible to determine for each patient the degree of cephalometric dif-ficulty for his/her orthodontic treatment.
The objective of this study was to compare a group of subjects with Angle Class II, division 1 malocclusion with a control group with excel-lent occlusion, applying the differential diagno-sis system for Craniofacial Analydiagno-sis of the Tweed Foundation in lateral cephalometric radiographs. The study also attempted to determine the toler-ance intervals of the cephalometric variables of Craniofacial Analysis for Brazilian subjects, al-lowing a more reliable calculation of the index of difficulty, and to analyze the different behavior of the structures involved among the groups, and the presence of sexual dimorphism.
MATERIAL AND METHODS
The sample of this study was composed of 211 lateral radiographs taken before the orthodontic treatment of white Brazilian subjects, ages ranging from 12 to 15 years, selected from the patient files of the Discipline of Orthodontics, School of Den-tistry of Piracicaba, State University of Campinas. Selection of the Angle Class II malocclusion sample was based on skeletal aspects – ANB angle – and a full Class II molar and canine relationship ob-served in dental cast examinations.
70 71
70 71
of both genders (82 males and 86 females), and the Control Group, with 43 radiographs (21 males and 22 females) of subjects with clinically normal occlusion. This study was approved by the Re-search Ethics Committee, School of Dentistry of Piracicaba, 9912000 protocol number, according to the CNS 196/96 Resolution, National Council of Health, dated 10/10/1996.
The anatomical structures of the skull and face were delimited, and a single examiner in a dark room drew the lines and plans to obtain the cephalometric landmarks (Figure 1).
The analysis of errors in orthodontic measure-ments used in the present study was calculated according to Houston5 (1983). The measurements
of 30 records from the main series were replicated and drawn at random and were measured under the same conditions by the same examiner after a 30-day period. Systematic and random errors were evaluated separately by means of repeatability and reproducibility analysis (Gage R&R), which stud-ies the amount of variation in the measurement system. The results were given as a percentage (Table 1).
The chi-squared test showed a descriptive level of 0.9987, which means that both groups were equivalent (Table 2).
The differential diagnosis system for Craniofa-cial Analysis of the Tweed Foundation comprises six cephalometric variables, and it was based on
the studies of Gramling3 (1995), Merrifield, Gebeck9
(1989) and Horn4 (1992). This analysis defines the
“index of difficulty” of the patient’s treatment in function of these cephalometric variables. There-fore, when those values are out of the interval that is suggested in the table, the difference is multi-plied by the existent numerical value, defining the Craniofacial Difficulty. As a result, it is possible to perform a unique calculation for each patient and to visualize the treatment prognosis (Table 3).
The mean and the standard deviation of each cephalometric variable in the samples of Angle Class II, division 1 patients (Class II Group), and normal occlusion (Control Group) subjects were calculated.
To verify the existence of sexual dimorphism between the means of the variables observed in both genders, the Student’s t-test was applied sep-arately to each group, with a level of significance of 5% and 1% (Tables 4 and 5).
Again, the Student’s t-test was applied to the variables of the groups to verify the existence of significant difference between the individuals with Class II, division 1 malocclusion and the subjects with normal occlusion (Table 6). The gender was not considered because it was already known that there was no significant difference between gen-ders.
An exploratory analysis based on the mean ± 0.5 standard deviation was also
per-� ��
��
�
�
� � �
�� �
� �
FIGURE 1 - Cephalometric landmarks. 1. SN line, 2. NA line, 3. NB line, 4. Frankfort plane, 5. Palatine plane, 6. Occlusal plane, 7. Mandibular plane, 8. Lower inci-sor line, 9. Profile line, 10. Anterior facial height, 11. Posterior facial height, 12. Y Axis.
TABLE 1 - Systematic and random errors.
Variables
Repeatability and reproducibility
analysis
P/T%
FMIA 0.28868 4.25
IMPA 0.2582 3.43
Z Angle 0.2582 3.29
Y AXIS 0.2582 8.26
SNA 0.2582 8.65
SNB 0.2236 7.94
ANB 0.2887 13.17
Occlusal Plane 0.2887 8.80
AFH 0.1826 5.31
PFH 0.0000 0.00
FHI 0.0013 1.97
SN.GoMe 0.3416 6.91
FMA 0.2500 16.24
72 73
72 73
formed for all the considered variables, in both the Class II Group and the Control Group. Based on the means ± 0.5 standard deviation, the lower limit of tolerance (LLT) and the upper limit of tolerance (ULT) were obtained, and constituted the tolerance intervals (Table 7). By means of these tolerance in-tervals, a customized table of Craniofacial Analysis of the Tweed Foundation was built (Table 8).
RESULTS
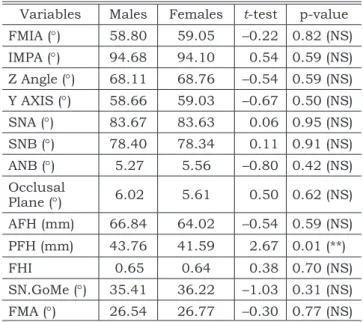
Except for the mean value of PFH in the Class II Group, the comparison among the mean values, which was obtained for both genders and all ages, did not show significant difference in the Class II Group or in the Control Group (Tables 4 and 5).
The difference between the groups was not significant when the variables Y-Axis, SNA, oc-clusal plane angle, AFH, SN.GoMe and FMA were compared (Table 6).
In Table 7, the values obtained for the two groups for the tolerance interval are presented.
Based on the tolerance limits, the intervals for cephalometric variables used in the Craniofacial Analysis for a Brazilian sample were determined (Table 8).
DISCUSSION
The present study analyzed the behavior of the angular and linear measurements of the Differen-tial Diagnosis System for Craniofacial Analysis of the Tweed Foundation, determining more adequate values for the Brazilian population. For such rea-son, we will discuss the cephalometric variables obtained in this study for the development of a Cra-niofacial Analysis Table for a Brazilian sample4,8,10,
and also discuss the behavior of the comprised structures, when the Angle Class II, division 1 group is compared with the normal occlusion group.
FMA is considered the most important angle of Tweed triangle, because it represents the skel-etal pattern of the face. The ideal mean value of FMA, according to Tweed16 (1962), should be of
25°, varying from 22° to 28°. The mean value found in the Class II Group was 26.66° (interval from 24.12° to 29.21°), while in the Control Group it was 25.12° (interval from 23.75° to 26.49°). Both groups showed mean values close to normal, and they did not present significant statistical differ-ence. The same was observed with the values of the angle of the “Y Axis” and of the SN.GoMe angle (Table 6). Therefore, it was observed that the skel-etal pattern of the Class II Group presented the TABLE 2 - Distribution of groups (%).
Gender Age (years) Control Class II
Male
12-13 21.4 22.0
13-14 16.7 15.5
14-15 11.9 11.3
Female
12-13 19.0 22.0
13-14 16.7 16.1
14-15 14.3 13.1
Total 100.0 100.0
TABLE 3 - Differential Diagnosis System for Craniofa-cial Analysis of the Tweed Foundation.
Normal
pattern Cephalometric Value Difficulty Factor Difficulty Index FMA
(22°-28°) 5
ANB
(1°-5°) 15
Z Angle
(70°-80°) 2
Occlusal Plane
(8°-12°) 3
SNB
(78°-82°) 5
FHI
(0.65-0.75) 3
TABLE 4 - Comparison between genders for data of the Class II Group.
Variables Males Females t-test p-value
FMIA (°) 58.80 59.05 –0.22 0.82 (NS)
IMPA (°) 94.68 94.10 0.54 0.59 (NS)
Z Angle (°) 68.11 68.76 –0.54 0.59 (NS)
Y AXIS (°) 58.66 59.03 –0.67 0.50 (NS)
SNA (°) 83.67 83.63 0.06 0.95 (NS)
SNB (°) 78.40 78.34 0.11 0.91 (NS)
ANB (°) 5.27 5.56 –0.80 0.42 (NS)
Occlusal
Plane (°) 6.02 5.61 0.50 0.62 (NS)
AFH (mm) 66.84 64.02 –0.54 0.59 (NS)
PFH (mm) 43.76 41.59 2.67 0.01 (**)
FHI 0.65 0.64 0.38 0.70 (NS)
SN.GoMe (°) 35.41 36.22 –1.03 0.31 (NS)
FMA (°) 26.54 26.77 –0.30 0.77 (NS)
72 73
72 73
TABLE 5 - Comparison between genders for data of the Control Group.
Variables Females Males t-test p-value
FMIA (°) 62.91 62.95 –0.05 0.96 (NS)
IMPA (°) 92.41 91.48 1.08 0.29 (NS)
Z Angle (°) 77.36 77.48 –0.11 0.92 (NS)
Y AXIS (°) 57.68 58.29 –0.85 0.40 (NS)
SNA (°) 82.55 82.38 0.53 0.60 (NS)
SNB (°) 80.32 80.29 0.10 0.92 (NS)
ANB (°) 2.41 2.24 0.62 0.54 (NS)
Occlusal
Plane (°) 7.55 7.29 0.43 0.67 (NS)
AFH (mm) 65.73 66.43 –0.77 0.45 (NS)
PFH (mm) 46.50 47.19 –0.64 0.52 (NS)
FHI 0.70 0.70 0.10 0.92 (NS)
SN.GoMe (°) 35.82 32.33 1.62 0.11 (NS)
FMA (°) 24.68 25.57 –1.07 0.29 (NS)
(NS) - no significant difference.
TABLE 6 - Result of the Student’s t-test between Class II and Control Groups.
Variables Class II Control t-test p-value
FMIA (°) 58.93 62.93 –3.68 0.00 (**)
IMPA (°) 94.38 91.95 2.26 0.02 (*)
Z Angle (°) 68.44 77.42 –7.32 0.00 (**)
Y AXIS (°) 58.85 57.98 1.51 0.13 (NS)
SNA (°) 83.65 82.47 1.79 0.07 (NS)
SNB (°) 78.37 80.30 –3.62 0.00 (**)
ANB (°) 5.42 2.33 8.36 0.00 (**)
Occlusal
Plane (°) 5.81 7.42 –1.92 0.06 (NS)
AFH (mm) 65.43 66.07 –0.68 0.49 (NS)
PFH (mm) 42.64 46.84 –4.86 0.00 (**)
FHI 0.64 0.70 –5.17 0.00 (**)
SN.GoMe (°) 35.83 34.12 1.80 0.07 (NS)
FMA (°) 26.66 25.12 1.91 0.06 (NS)
** - significant at 1% (p < 0.01); * - significant at 5% (p < 0.05); (NS) - no significant difference.
TABLE 7 - Upper and lower limits of tolerance (ULT and LLT), calculated from the mean values (M) ± 0.5 standard deviation (SD), for the Class II Group and the Control Group, with all the studied variables.
Variables Class II Group Control Group LLT ULT
Mean SD M - 0.5SD M + 0.5SD Mean SD M - 0.5SD M + 0.5SD
FMIA (°) 58.93 6.98 55.44 62.42 62.93 2.78 61.54 64.32 55.44 64.32
IMPA (°) 94.38 6.90 90.93 97.83 91.95 2.84 90.53 93.37 90.53 97.83
Z Angle (°) 68.44 7.84 64.52 72.36 77.42 3.43 75.71 79.14 64.52 79.14
Y AXIS (°) 58.85 3.62 57.04 60.66 57.98 2.32 56.82 59.14 56.82 60.66
SNA (°) 83.65 4.30 81.50 85.80 82.47 1.01 81.97 82.98 81.50 85.80
SNB (°) 78.37 3.44 76.65 80.09 80.30 1.08 79.76 80.84 76.65 80.84
ANB (°) 5.42 2.38 4.23 6.61 2.33 0.89 1.89 2.78 1.89 6.61
Occlusal
Plane (°) 5.81 5.41 3.11 8.52 7.42 1.94 6.45 8.39 3.11 8.52
AFH (mm) 65.43 5.97 62.45 68.42 66.07 2.97 64.59 67.56 62.45 68.42
PFH (mm) 42.64 5.38 39.95 45.33 46.84 3.49 45.10 48.59 39.95 48.59
FHI 0.64 0.07 0.61 0.68 0.70 0.04 0.68 0.72 0.61 0.72
SN.GoMe (°) 35.83 5.09 33.29 38.38 34.12 7.19 30.53 37.72 30.53 38.38
FMA (°) 26.66 5.09 24.12 29.21 25.12 2.74 23.75 26.49 23.75 29.21
same cephalometric characteristics as that of the Control Group; in other words, The Class II Group presented a balanced skeletal pattern14.
On the other hand, the Facial Height Index (FHI)4,9, which also determines the skeletal
pat-tern, presented a mean value of 0.64 (interval from 0.61 to 0.68) for the Class II Group and of 0.70
74 75
74 75
Therefore, the mean value for PFH of 42.64 mm (interval from 39.95 mm to 45.33 mm) could have caused the decrease of the value for FHI in this group, and, as a consequence, it would determine a more vertical pattern for the individuals with Class II, division 1 malocclusion6,7,11,17.
The occlusal plane angle was defined as a function of the Frankfort horizontal plan, and in this study it presented a mean value of 7.42° (in-terval from 6.45° to 8.39° counterclockwise) for the Control Group and a mean value of 5.81° (in-terval from 3.11° to 8.52° counterclockwise) for the Class II Group. We observed that the values of this measurement for both groups were not sig-nificantly different (Table 6), although these values were smaller than the mean value of 10° with an interval from 8° to 12° recommended by the Tweed Foundation3.
The FMIA angle is also part of the Tweed tri-angle, representing a more balanced face when a value of 68° is observed16. The present study
showed a mean value of 58.93° (from 55.44° to 62.42°) for the Class II Group, and of 62.93° (from 61.54° to 64.32°) for the Control Group. The val-ues of FMIA for both groups presented significant difference, indirectly demonstrating that the lower incisors presented a more buccal inclination in the Class II Group when compared with the Control Group6,7,12,18.
The mean value observed for SNA was 82.47° (interval from 81.97° to 82.98°) for the Control Group, and 83.65° (interval from 81.50° to 85.80°) for the Class II Group. Thus, the maxilla did not present a significant difference between both groups, and consequently it was shown that the maxilla is well positioned in relation to the base
of the skull, for both the Class II Group and the Control Group6,7,11.
The mean value for SNB was 80.30° (interval from 79.76° to 80.84°) for the Control Group, while the Class II Group presented a value of 78.37° (in-terval from 76.65° to 80.09°). The values showed significant difference between the two groups, and it was evident that the mandible was retrusive with regard to the base of the skull in the Class II Group2.
The relationship between the maxilla and the mandible was determined by the ANB angle, which presented a mean value of 2.33° in this study (in-terval from 1.89° to 2.78°) for the Control Group, and of 5.42° (interval from 4.23° to 6.61°) for the Class II Group. Thus, the existence of significant difference was observed in the relationship between the apical bases of the two groups. Consequently, the maxilla and the mandible were observed to present a good relationship in the Control Group, while in the Class II Group they presented a strik-ing anteroposterior discrepancy.
In this study, the balance of facial profile was defined by the Z angle10. The mean value of this
variable was 77.42° (interval from 75.71° to 79.14°) in the Control Group, and 68.44° (interval from 64.52° to 72.36°) in the Class II Group. The val-ues for the Z angle showed significant differences between the two groups, justifying the balanced or straight profile for the individuals of the Con-trol Group, and the convex profile for the Class II Group9,18.
The intervals obtained according to the toler-ance limits, observed in Table 7, guided the con-struction of a Craniofacial Analysis Table for the Brazilian sample. This table will be offered as a suggestion for the Differential Diagnostic System of the Tweed Foundation for calculating the treat-ment difficulty in white Brazilian individuals with Angle Class II, division 1 malocclusion.
This way, the intervals for Craniofacial Analy-sis cephalometric variables in a Brazilian sample were defined: FMA ranging from 23.75° to 29.21°; Z Angle ranging from 64.52° to 79.14°; ANB ranging from 1.89° to 6.61°; Occlusal Plane ranging from 3.11° to 8.52°; SNB ranging from 76.65° to 80.84° and FHI ranging from 0.61 to 0.72.
CONCLUSIONS
Based on the results obtained from the stud-ied sample, the intervals for Craniofacial Analysis cephalometric variables for the Brazilian sample were defined: FMA ranging from 23.75° to 29.21°; Z Angle ranging from 64.52° to 79.14°; ANB rang-TABLE 8 - Table of the Craniofacial Analysis with
val-ues and intervals developed for the Brazilian sample. Normal
pattern Cephalometric Value Difficulty Factor Difficulty Index FMA
(23.75°-29.21°) 5
ANB
(1.89°-6.61°) 15
Z Angle
(64.52°-79.14°) 2
Occlusal Plane
(3.11°-8.52°) 3
SNB
(76.65°-80.84°) 5
FHI
74 75
74 75
ing from 1.89° to 6.61°; Occlusal Plane ranging from 3.11° to 8.52°; SNB ranging from 76.65° to 80.84° and FHI ranging from 0.61 to 0.72. There were no significant differences between genders for the cephalometric variables studied.
The mandible was retrusive in relation to the base of the skull in the cases of Angle Class II, division 1 malocclusion. There were no significant differences in the maxillary position between the Class II Group and the Control Group; in other
words, the maxilla was well related to the base of the skull.
It was not possible to define a skeletal pat-tern in the sample, because the facial height index presented a vertical pattern in the Class II Group, while the Y Axis, Occlusal Plane, SN.GoMe and FMA values did not present significant difference between the studied groups. The cases of Class II malocclusion presented a convex profile.
REFERENCES
1. Angle EH. Malocclusion of the teeth. 7th ed. Philadelphia:
SS White Dental Manufacturing Co.; 1907.
2. Buschang PH, Tanguay R, Turkewicz J, Demirjian A, La Palme L. A polynomial approach to craniofacial growth: de-scription and comparison of adolescent males with normal occlusion and those with untreated Class II malocclusion. Am J Orthod Dentofacial Orthop 1986;90(5):437-42. 3. Gramling JF. The probability index. Am J Orthod
Dento-facial Orthop 1995;107(2):165-71.
4. Horn AJ. Facial height index. Am J Orthod Dentofacial Orthop 1992;102(2):180-6.
5. Houston WJB. The analysis of errors in orthodontic measurements. Am J Orthod 1983;83(5):382-90.
6. Maia FA, Capelozza Filho L, Pavarini A, Lima JEO, Abdo RCC. Estudo cefalométrico das características da má-oclusão de Classe II/1, em brasileiros da região Nor-deste, em fase de dentadura mista (parte 1). Ortodontia 1998;31(2):53-68.
7. McNamara JA Jr. Components of Class II malocclusion in children 8-10 years of age. Angle Orthod 1981;51:177-202. 8. Merrifield LL. The profile line as an aid in critically
evaluat-ing facial esthetics. Am J Orthod 1966;52(11):804-22. 9. Merrifield LL, Gebeck TR. Analysis: concepts and values.
Part II. J Charles H Tweed Int Found 1989;17:49-64. 10. Merrifield LL, Klontz HA, Vaden JL. Differential
diag-nostic analysis system. Am J Orthod Dentofacial Orthop 1994;106(6):641-8.
11. Missaka M, Fantini SM. Análise telerradiográfica dos componentes da maloclusão de Classe II, em norma
late-ral, em crianças brasileiras com idades entre 8 e 12 anos. Ortodontia 1997;30(3):18-30.
12. Moyers RE, Riolo ML, Guire KE, Wainright RL, Book-stein FL. Differential diagnosis of Class II malocclusions. Part 1. Facial types associated with Class II malocclusions. Am J Orthod 1980;78:477-94.
13. Nouer DF. Das maloclusões e alguns dos seus fatores etiológicos [Tese de Doutorado]. Piracicaba: Faculdade de Odontologia de Piracicaba da Universidade Estadual de Campinas; 1966.
14. Rothstein T, Yoon-Tarlie C. Dental and facial skeletal characteristics and growth of males and females with Class II, division 1 malocclusion between the ages of 10 and 14 (revisited) – Part I: characteristics of size, form and position. Am J Orthod Dentofacial Orthop 2000;117(3):320-32. 15. Silva Filho OG, Freitas SF, Cavassan AO. Prevalência
de oclusão normal e má-oclusão na dentadura mista em escolares na cidade de Bauru. Rev Assoc Paul Cir Dent 1989;43:287-90.
16. Tweed CH. Was the development of the diagnostic facial triangle as an accurate analysis based on fact or fancy? Am J Orthod 1962;48(11):823-40.
17. Vale DMV, Martins DR. Avaliação cefalométrica das estruturas dento-esqueléticas em jovens portadores de Classe II, divisão 1, brasileiros, leucodermas e de origem mediterrânea. Ortodontia 1987;20:5-17.
18. Vigorito JW. Estudo comparativo de algumas medidas cefalométricas em más-oclusões de Classe I e Classe II, 1ª divisão. Ortodontia 1974;7(2):179-90.