Original Article
Artigo original
Auditory-perceptual evaluation of rough and
breathy voices: correspondence between
analogical visual and numerical scale
Análise perceptivo-auditiva de vozes rugosas
e soprosas: correspondência entre a escala
visual analógica e a escala numérica
Paula Belini Baravieira1,2,3
Alcione Ghedini Brasolotto1,2
Arlindo Neto Montagnoli1,4
Kelly Cristina Alves Silvério2
Rosiane Yamasaki3
Mara Behlau3
Keywords
Voice Dysphonia
Evaluation Visual Analog Scale
Hoarseness
Descritores
Voz
Disfonia Avaliação
Escala Visual Analógica
Rouquidão
Correspondence address: Mara Behlau
Centro de Estudos da Voz – CEV Rua Machado Bittencourt, 361, São Paulo (SP), Brazil, CEP: 04044-001. E-mail: [email protected]
Received: April 17, 2015
Accepted: May 26, 2015
Study carried out at Centro de Estudos da Voz – CEV - São Paulo (SP), Brazil and at the Departamento de Fonoaudiologia, Faculdade de Odontologia de Bauru, Universidade de São Paulo – USP - Bauru (SP), Brazil.
1 Programa de Pós-graduação Interunidades em Bioengenharia – EESC/IQSC/FMRP, Universidade de São
Paulo – USP - São Carlos (SP), Brazil.
2 Departamento de Fonoaudiologia, Faculdade de Odontologia de Bauru, Universidade de São Paulo – USP -
Bauru (SP), Brazil.
3 Centro de Estudos da Voz – CEV - São Paulo (SP), Brazil.
4 Departamento de Engenharia Elétrica, Universidade Federal de São Carlos – UFSCar - São Carlos (SP) Brazil.
Financial support: none.
Conlict of interests: nothing to declare.
ABSTRACT
Purpose: To determine the cut-off values of different degrees of vocal roughness and breathiness in an analogical visual scale, from a numerical scale. Methods: We selected 150 voices from both genders, with quality ranging from neutrality to intense deviations, and predominance of breathiness or roughness. The auditory-perceptual assessment through two scales: 100-mm analogical visual scales and 4-point numerical scale. Intra and interrater
reliability of auditory-perceptual ratings was analyzed using the Intraclass Correlation Coeficient. The cut-off
values for graduation of roughness and breathiness voices were determinate using the analysis of the Receiver
Operating Characteristic (ROC) curve, which is based on the sensitivity, speciicity and eficiency. Results: The intra and interrater reliability of auditory-perceptual ratings was excellent on both scales. The cut-off values (mm) in the analogical visual scale, from the numeric scale, indicated a roughness distribution: 0-8.5 absence of the parameter; 8.5- 28.5 mild presence; 28.5- 59.5 moderate and 59.5- 100 intense. For breathiness, the distribution was: 0-8.5 absence of the parameter; 8.5-33.5 for mild presence; 33.5-52.5 moderate and 52.5-100 intense. Conclusion: The cut-off values found for the analogical visual scale conclude that the numerical scale zero, which represents the absence of parameter, corresponds to a small range of scores in the analogical visual scale. Furthermore, the third degree of the numerical scale corresponded to a wide range of the analogical visual scale.
RESUMO
Objetivo: Determinar os valores de corte dos diferentes graus de rugosidade e soprosidade vocal em uma escala visual analógica, a partir de uma escala numérica. Métodos: Foram selecionadas 150 vozes, de indivíduos de ambos os gêneros, com qualidade variando desde a ausência de rugosidade e de soprosidade até a presença desses parâmetros em grau intenso. A avaliação perceptivo-auditiva foi realizada por quatro fonoaudiólogas especialistas em voz, com a utilização da escala visual analógica de 100 mm e da escala numérica de quatro pontos.
A concordância intra e interjuízes foi veriicada por meio do Coeiciente de Correlação Interclasse. Os valores de corte foram obtidos com base nos valores de sensibilidade, especiicidade e eiciência. Resultados: A concordância
intra e interjuízes foi excelente em ambas as escalas. Os valores de corte deiniram as faixas de distribuição,
BACKGROUND
The auditory-perceptual analysis is the main vocal assessment procedure used in clinical practice by the speech therapist(1), able to characterize the voice quality, pointing diverted vocal parameter and the degree of vocal deviation, and inferences about their social impact(2-5). On the other hand, the auditory-perceptual assessment has a essentially perceptive character, which makes it subject to mistakes and variations as it can be affected by several factors as evaluator past experience(6), knowledge or not of the clinical data, type of assessed task - voice or speech(5,7) - and protocol used(8).
Thus, to minimize variation from subjectivity is a challenge to improve the auditory perceptual evaluation. In this context assessment scales were created and validated(9), among which are numeric and analogical visual scales. The most used scales are CAPE-V (Consensus Auditory-Perceptual Evaluation of Voice) and GRBAS (overall dysphonia Grade, Roughness, Breathiness, Asthenia, and Strain) that reveal good reliability indexes(10-12), while continuous scales (analogical visual) show better concordance indexes than numeric scales(10,11,13).
On the other hand, it’s been observed that analogical visual scales usually are linked to qualitative restrictions of the degree of vocal deviation(14). ASHA (American Speech-Language-Hearing Association), in text about the CAPE-V, recommends the use of value in millimeters associated to the qualitative description to degree the vocal deviation (e.g.: mild, moderate, severe)(15). Recent studies have been established cutoff values in this context for normal variability of mild, moderate and severe level(10,16,17). Therefore, these studies focus on the overall degree of vocal deviation, lacking information regarding the cutoff values for
speciic parameters.
Roughness, breathiness and tension are among the speciic
vocal parameters most found in dysphonic individuals(18). In 1996, studies already showed the breathiness and roughness
as two characteristics clearly identiied in the auditory perceptual
evaluation(19). Furthermore, both roughness and breathiness are present in the most used auditory perceptual evaluation scales GRBAS e CAPE-V.
In summary, the analogical visual scale needs speciic limits
that allow the professional to correlate quantitative values and qualitative concepts since this correlation is essential for an adequate interpretation of the auditive perceptual evaluation results. This work approached the presence/absence of roughness and breathiness since they are the most recurrent vocal parameters among dysphonic individuals(18), suggesting the investigation
of the additional speciic vocal parameters in future studies.
Thus, this study aimed to determine the cutoff values of different degrees of rough and breathy voices in a visual analogue scale, from a numerical scale.
METHODS
This study has been approved by the Ethics Research Committee under the opinion letter n. 872.185. Vocal samples were obtained from database of a Voice Laboratory, and consist of voices of patients examined in this outpatient clinic.
The recording of sustained vowel /a/ of 150 individuals, both genders, 18 years or older were selected for this study. The sustained vowel /a/ sample was chosen because it is one of the vowels used by several acoustic programs, allowing for future comparison with voice acoustic analysis, which currently account for approximately 60% of the publications about voice(20). The voice recording in the database were selected by a speech therapist ranging from neutral voices to voices with severe roughness and/or breathiness. After the selection, the voices were kept or excluded from this study according to the evaluation by four judges and according to the sample inclusion criteria.
The inclusion criteria for the selection of voice samples were: being 18 years or older, in addition to vocal quality predominantly rough or breathy and maximum difference of 10 millimeters (mm) in the opinion of, at least, three judges.
The database recordings were obtained with a headset, brand AKG/model C444PP, positioned laterally at 60º, and at 5 centimeters of the lip commissure. The audio signal was recorded by the program Sound Forge 10.0 with a sampling rate of 44.100 Hz, 16 bit, mono channel, in a computer with soundboard model Audigy II (brand Creative Sound Blaster).
For the standardization of the voice samples, the emission of the sustained vowel /a/ was edited, with Sound Forge 10.0,
eliminating the irst second of the emission and selecting the
following three seconds; in case of an abrupt irregularity, a more stable segment of the recording was selected.
The auditive perceptual evaluation assessed two parameters, roughness R (irregularity in the vocal folds vibration) and breathiness S (audible air leak in the voice), evaluated using two protocols: the analogical visual scale varying from 0 (zero) to 100 mm, with 0 mm representing the absence of the evaluated parameter and 100 mm, its maximum intensity; and the 4 points numerical scale, where 0 (zero) representing the absence of the evaluated parameter, 1 representing mild degree, 2 moderate degree and 3 the presence of severe degree.
The evaluation was performed by four voice specialist
speech therapists, with at least ive years of experience with
vocal evaluation. The evaluation was organized in two step,
in the irst step the speech therapists were guided to evaluate
the voices using the analogical visual scale and, in the second, using the 4 points numeric scale. The interval among evaluations was 30 days. The speech therapists were previously trained and oriented to evaluate the absence or grade the presence of roughness and/or breathiness in both scales. Voices were randomly presented and the speech therapists made individual evaluations in a acoustically treated environment, using headphones of the brand Behringer, model HPX2000, in a computer with soundboard model Audigy II (brand Creative Sound Blaster). The method was chosen to avoid bias such as noise in the evaluation environment and variations regarding the soundboards and headphones.
The Interclass Correlation Coeficient (ICC) was used for
the sampling was randomly repeated for the intra judge analysis in the application of both scales.
We used the ROC Curve to set the cutoff values in the roughness and breathiness graduation, which is based in values of
sensibility, speciicity and eficacy. The ROC curve was calculated
using the mean of analogical visual scale evaluations with the
mode of numeric scale evaluations. The maximum eficacy rule
was used to estimate the cutoff values, considering the highest
values of sensibility and speciicity. The eficacy correspond
to the area under the ROC curve, being that the cutoff values closer to 1 were more precise.
RESULTS
Of the 150 voices evaluated, 21 were excluded for non-compliance with the sample inclusion criteria, 3 voices excluded for lack of consensus on the predominant feature of vocal deviation, 10 excluded due to difference greater than 10 mm between two or more judges, 4 due to absence of a predominant vocal characteristic, 3 due to tension as the predominant parameter in voice quality and 1 due to instability as the predominant vocal parameter. Thus, this study used 129 voices.
The inter judge concordance analysis performed using ICC was excellent, both for analogical visual scale (p=0.85) and numeric scale (p=0.77). The intra judge analysis was also considered excellent based on ICC results, with p-value between 0.87 and 0.93 in the analogical visual scale and between 0.83 and 0.88 in the numerical scale.
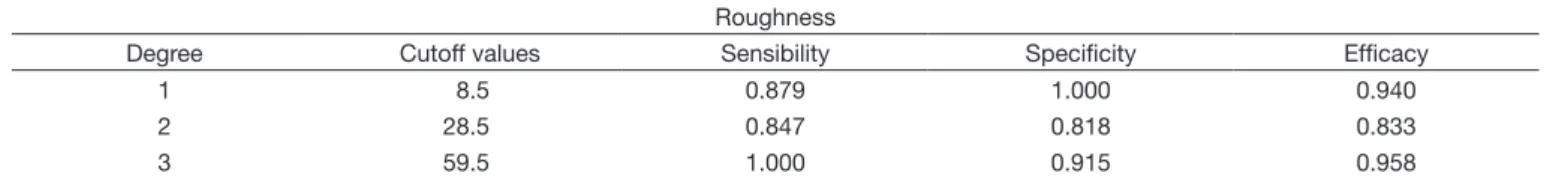
Cutoff values as well as sensibility, speciicity and eficacy
are described in the Table 1 for roughness, and in Table 2 for
breathiness, reminding that the cutoff value is estimated by the
higher eficacy value. Table 3 records the graduation interval of the evaluated parameters.
DISCUSSION
Studies show that the analogical visual scale is most sensible to small differences(10,11,13) and has higher agreement among judges when compared to the numerical scale(13). On the
other hand, it is dificult to qualitatively represent its results,
which most of the time are linked by regions that represent the several degrees of vocal deviation(14) (absent, mild, moderate and severe). It is observed, however, the need of a correlation between the analogical visual scale and the numerical scale for a best interpretation of the auditive perceptual evaluations, seen that the analogical visual scale allows the clinician to correlate a quantitative data, with 100 points variation, in distribution intervals that qualitatively represent the several degree of the evaluated parameters.
In this context, some studies were developed focusing the vocal deviation overall degree(10,16,17), reaching similar results regarding the normal variability of the cutoff value for the analogical visual scale from the numerical scale. It shows that, for the overall degree, the auditive perceptual evaluation with these techniques is a robust method. This work, however, focused to determine the cutoff values of the degree of presence
of the roughness and breathiness speciic parameters, which
were selected because they had the higher consensus among judges(21). Simberg et al.(16), Yamasaki et al.(10) and Vieira et al.(17) established a cutoff value in the analogical visual scale using a
Table 1. Cutoff values for different degrees of roughness, in 4 points, with the respective values of sensibility, specificity and efficacy Roughness
Degree Cutoff values Sensibility Specificity Efficacy
1 8.5 0.879 1.000 0.940
2 28.5 0.847 0.818 0.833
3 59.5 1.000 0.915 0.958
Table 2. Cutoff values for different degrees of breathiness, in 4 points, with the respective values of sensibility, specificity and efficacy Breathiness
Degree Cutoff values Sensibility Specificity Efficacy
1 8.5 0.921 1.000 0.961
2 33.5 0.750 0.974 0.862
3 52.0 1.000 0.868 0.934
Table 3. Distribution intervals of roughness and breathiness degree, in 4 points
Presence degree of the evaluated parameter Distribution interval
Roughness Breathiness
0 0-8.5 0-8.5
1 8.5-28.5 8.5-33.5
2 28.5-59.5 33.5-52.5
4 points numerical scale considering for the overall voice deviation the value 0 (zero) as normal variability of the vocal deviation. Yamasaki et al.(10) and Vieira et al.(17) found cutoff values also for the remaining degrees, with degree 1 representing a mild voice deviation, 2 moderate deviation and 3 severe deviation. Simberg found 34.5 mm as cutoff value for the normal variability of the voice deviation(16), while Yamasaki et al.(10) and Viera(17) found 35.5 mm.
The logic of this study to classify the voice quality is different from the other, as it didn’t analyze the vocal overall G degree
but the absence/presence of the speciic parameters evaluated,
which impairs the comparison of results with the studies found in the literature. In this study, 0 (zero) represents the absence of the evaluated parameter, 1 represents the presence of mild degree, 2 the presence of moderate degree and 3 represents the presence of severe degree. The methodology was adopted due
to the characteristic of speciic parameters, which is different
according to gender and vocal frequency. It is known that male voices or deeper voices, independent of gender, have a higher chance of roughness(22), on the other hand female voices have a higher chance of breathiness due to the glottal proportion and laryngeal format(23). Thus, to estimate the cutoff values from the different degrees in the analogical visual scale, independent of gender and voice frequency, the neutrality deviation was considered instead of normal variability.
In this context, we found the point 0 (zero) of the numeric scale varying from 0 to 8.5 mm in the analogical visual scale, both for roughness and breathiness. This result is expected and reveals a limitation of the 4 points scale, since the judge, when required to opt between point 0, absence of evaluated parameter, and 1, mild presence, may opt for 0 if the presence of the parameter is irrelevant. Besides, studies consider variations of up to 10 mm as irrelevant in the 100 mm variations analogical visual scale.
Regarding the degree 1 of the numerical scale it is observed that the variation range extends to about 30 mm for both parameters evaluated (Table 3) close to the cutoff parameter considered in the overall grade for the normal variability(10,16). This result may be indicative of normal variability of roughness and breathiness and should be better investigated in future studies.
Regarding the degree 3, mainly regarding the breathiness (52.5 mm), there is a cutoff lower than in the overall level of voice quality in the studies reported in the literature(10,16,17). However, evaluate the roughness and breathiness not necessarily has the same impact as evaluating the overall degree of the voice quality and the judges may be more critical in the isolated evaluation
of these speciic parameters, which may justify the cutoff value
found for the severe degree in the roughness and breathiness evaluation. In addition, the evaluation of absence or the degrees of presence of these parameters is different from evaluating the normal variability and the dysphonic degrees. Another factor that should be considered is the type of voice sample used for the evaluation. This study used the sustained vowel aiming to associate it in the future with acoustic analysis and works found in the literature using the chain speech samples(10,17). It is known that the type of sample, speech or sustained vowel contribute to the variability of the auditive perceptual evaluation(5,7). In sustained vowels there is a subglottic and the supraglottic
condition relatively constant, whereas in continuous speech are observed temporal and spectral variations caused by start and word end, breaks, deaf phonemes, phonetic context, prosodic
luctuations in fundamental frequency and intensity, speed
speech, among others(5).
The concordance inter and intra judge was rated as excellent in both scales, that is, the p value was greater than 0.75. However, it is observed that the p value was added to the visual analog scale for both the inter agreement as to intra judge, indicating better concordance rates in EAV. This result is consistent with that found in the work of Yamasaki(10) and Kreiman(13) for voice auditory perceptual evaluation. In other areas of perceptual evaluation, such as self assessment of pain, it is observed that the visual analog scale of 100 mm is the most widely used, showing good reliability and practicality in the application(24,25). In addition, some studies as Ferraz(26), show that between three types of scales - analog visual, verbal and numeric scale - the visual analog scale showed the highest rates of agreement when performed the correlation between the application and reapplication of scale in pain self-assessment(26).
As to the comparison between the auditory perceptual evaluation of roughness and breathiness (Tables 1 and 2), we note that the degree of intensity of the presence of these parameters were similar. It is suggested for future work, the establishment of the cutoff value for normal variability of these parameters for sex, to measure the differences of the normal range that we know exist between them for roughness and breathy.
CONCLUSION
It was possible to establish the cutoff values for the different degrees of roughness and breathiness visual analog scale from the numerical scale, concluding that the level 0 (zero) the numerical scale, which is the absence of the parameter corresponds to a small range of scores on the visual analog scale, while the level 3 of the numerical scale corresponds to an extensive range of analog visual scale.
The cutoff values found were: 8.5 mm for the presence of mild degree of both parameters evaluated, 28.5 mm for the presence of moderate in roughness and 33.5 mm in breathiness, 59.5 mm for the intense degree in roughness and 52.5 mm for the same degree in breathiness.
We also conclude from the cutoff values that the different degrees of presence of the evaluated parameters occur in close
values, deining a similar classiication for roughness and
breathiness. In addition, this study allows the clinician to correlate quantitative values with qualitative concepts, making the results interpretation easier for the auditive perceptual evaluation using the analogical visual scale, both for screening and for roughness and breathiness auditive perceptual evaluations.
ACKNOWLEDGEMENTS
REFERENCES
1. Behrman A. Common practices of voice therapists in the evaluation of patients. J Voice. 2005;19(3):454-69. http://dx.doi.org/10.1016/j. jvoice.2004.08.004. PMid:16102671.
2. Oates J. Auditory-perceptual evaluation of disordered voice quality. Folia Phoniatr Logop. 2009;61(1):49-56. http://dx.doi.org/10.1159/000200768. PMid:19204393.
3. Madazio G, Leão S, Behlau M. The phonatory deviation diagram: a novel objective measurement of vocal function. Folia Phoniatr Logop. 2011;63(6):305-11. http://dx.doi.org/10.1159/000327027. PMid:21625144.
4. Shrivastav R. The use of an auditory model in predicting perceptual ratings of breathy voice quality. J Voice. 2003;17(4):502-12. http://dx.doi. org/10.1067/S0892-1997(03)00077-8. PMid:14740932.
5. Maryn Y, Roy N. Sustained vowels and continuous speech in the auditory-perceptual evaluation of dysphonia severity. J Soc Bras Fonoaudiol. 2012;24(2):107-12. http://dx.doi.org/10.1590/S2179-64912012000200003. PMid:22832675.
6. Eadie TL, Kapsner M, Rosenzweig J, Waugh P, Hillel A, Merati A. The role of experience on judgments of dysphonia. J Voice. 2010;24(5):564-73. http://dx.doi.org/10.1016/j.jvoice.2008.12.005. PMid:19765949.
7. Zraick RI, Wendel K, Smith-Olinde L. The effect of speaking task on perceptual judgment of the severity of dysphonic voice. J. voice. 2005;19(4):574-81.
8. Kreiman J, Gerratt BR, Kempster GB, Erman A, Berke GS. Perceptual evaluation of voice quality: review, tutorial, and a framework for future research. J Speech Hear Res. 1993;36(1):21-40. http://dx.doi.org/10.1044/ jshr.3601.21. PMid:8450660.
9. Hirano M. Psyco-acoustic evaluation of voice. In: Arnold GE, Winckel F, Wyke BD, editors. Clinical examitation of voice. Austria: Springer-Verlag/ Wien; 1981. p. 81-4.
10. Yamasaki R, Leão SHS, Madazio G, Padovani M, Azevedo R, Behlau M. Correspondência entre escala analógico-visual e a escala numérica na avaliação perceptivo-auditiva de vozes. In: 16º Congresso Brasileiro de Fonoaudiologia; 24-27 set 2008; Campos do Jordão, Brasil. Anais... São Paulo: Sociedade Brasileira de Fonoaudiologia; 2008. p. 24-7.
11. Karnell MP, Melton SD, Childes JM, Coleman TC, Dailey SA, Hoffman HT. Reliability of clinician-based (GRBAS and CAPE-V) and patient-based (V-RQOL and IPVI) documentation of voice disorders. J Voice. 2007;21(5):576-90. http://dx.doi.org/10.1016/j.jvoice.2006.05.001. PMid:16822648.
12. Nemr K, Simões-Zenari M, Cordeiro GF, Tsuji D, Ogawa AI, Ubrig MT, et al. GRBAS and cape-V scales: high reliability and consensus when applied at different times. J. voice. 2012;26(6):e17-e22.
13. Kreiman J, Gerratt BR, Ito M. When and why listeners disagree in voice quality assessment tasks. J Acoust Soc Am. 2007;122(4):2354-64. http:// dx.doi.org/10.1121/1.2770547. PMid:17902870.
14. Cline ME, Herman J, Shaw ER, Morton RD. Standardization of the visual analogue scale. Nurs Res. 1992;41(6):378-9. http://dx.doi. org/10.1097/00006199-199211000-00013. PMid:1437591.
15. American Speech-Language-Hearing Association. Consensus auditory-perceptual evaluation of voice (CAPE-V) [Internet]. Rockville: ASHA; 2002 [cited 2014 Mar 17]. Available from: http://www.asha.org/uploadedFiles/ ASHA/SIG/03/affiliate/CAPE-V-Purpose-Applications.pdf
16. Simberg S, Laine A, Sala E, Rönnemaa A-M. Prevalence of voice disorders among future teachers. J. voice. 2000;14(2):231-5.
17. Vieira MMRM, Yamasaki R, Brasolotto AG, Behlau M. Intensidade do desvio vocal na escala analógicovisual para adultos idosos. In: 21º Congresso Brasileiro e 2º Ibero-Americano de Fonoaudiologia; 22-25 set 2013; Porto de Galinhas, Brasil. Anais... São Paulo: Sociedade Brasileira de Fonoaudiologia; 2013. p. 542-6.
18. Leão SHS. Análise espectográfica acústica de vozes rugosas, soprosas e tensas [dissertação]. São Paulo: Universidade Federal de São Paulo; 2008.
19. Dejonckere P, Lebacq J. Acoustic, perceptual, aerodynamic and anatomical correlations in voice pathology. ORL J Otorhinolaryngol Relat Spec. 1996;58(6):326-32. http://dx.doi.org/10.1159/000276864. PMid:8958542.
20. Roy N, Barkmeier-Kraemer J, Eadie T, Sivasankar MP, Mehta D, Paul D, et al. Evidence-based clinical voice assessment: a systematic review. Am J Speech Lang Pathol. 2013;22(2):212-26. http://dx.doi.org/10.1044/1058-0360(2012/12-0014). PMid:23184134.
21. American Speech-Language-Hearing Association. Consensus auditory-perceptual evaluation of voice (CAPE-V): purpose and applications. Rockville: ASHA; 2006. p. 1-3.
22. Behlau M, Feijó D, Madázio G, Pontes P. Avaliação de voz. In: Behlau M, editor. Voz: o livro do especialista. Rio de Janeiro: Revinter; 2001. p. 85-245.
23. Behlau M, Azevedo R, Pontos P. Conceito de voz normal e classificação das disfonias. In: Behlau M, editor. Voz: o livro do especialista. Rio de Janeiro: Revinter; 2001. p. 53-79.
24. Lima LRD, Stival MM, Barbosa MA, Pereira LV. Controle da dor no pós-operatório de cirurgia cardíaca: uma breve revisão. Revista Eletrônica de Enfermagem. 2009;10(2):521-9. http://www.fen.ufg.br/revista/v10/n2/ v10n2a23.htm.
25. Provenza J, Pollak D, Martinez J, Paiva E, Helfenstein M, Heymann R, et al. Fibromialgia. Rev Bras Reumatol. 2004;44(6):443-9. http://dx.doi. org/10.1590/S0482-50042004000600008.
26. Ferraz MB, Quaresma MR, Aquino LR, Atra E, Tugwell P, Goldsmith CH. Reliability of pain scales in the assessment of literate and illiterate patients with rheumatoid arthritis. J Rheumatol. 1990;17(8):1022-4. PMid:2213777.
Author contributions
PBB participated of the study design, selection of voices in database, tabbing, data analysis and manuscript writing; AGB participated of the study design, data analysis and manuscript review; ANM, KCAS and RY participated of the study design and manuscript review; MB participated of the study design and