A Work Project presented as part of the requirements for the Award of a Master Degree in Finance from the Faculdade de Economia da Universidade Nova de Lisboa.
The Sum-of-the-Parts Method:
An International Application
Ana Carolina Marques de Almeida, 124
A project carried out with the supervision of:
Professor Pedro Santa-Clara
June 2009
Abstract
Forecasting stock market returns has a long tradition in the academic literature,
but most of the research focuses on the US stock market. In this study, I
propose extending the sum-of-the-parts method (Ferreira and Santa-Clara
(2008)) to four of the major international stock markets - Canada, France, Japan,
and the UK - using variables that have been suggested as stock return predictors
for the US. I find evidence that stock market return predictability varies
substantially across countries. When compared to the US market, out-of-sample
predictability is strong in Japan and the UK. Overall, the results of this study
suggest that the sum-of-the-parts method is robust across countries as it always
improves the forecasting performance on the traditional predictive regression
1 - Introduction
Evidence against the random walk hypothesis represents a major challenge in the way
researchers look at stock return predictability. If the stock market does not move in a random
fashion, i.e. if expected returns are not constant over time, then there has to be some degree of
predictability in stock market returns.
There is an extensive literature on predictability that suggests a range of variables as in-sample
predictors of the stock market return for the US market. Fama and French (1988), Campbell
and Shiller (1988), Hodrick (1992), Lewellen (2004), and Cochrane (2006) use valuation ratios
such as the dividend-price ratio and the dividend yield. Campbell and Shiller (1988), and
Lamont (1998) examine the earnings-price ratio. Kothari and Shanken (1997), as well as
Pontiff and Schall (1998), use the book-to-market ratio. Other authors examine
interest-rate-related variables such as short-term interest rates (see Hodrick (1992), Campbell (1987), and
Ang and Bekaert (2003)), term spreads and default spreads (see Keim and Stambaugh (1986),
Campbell (1987), and Fama and French (1989). More recently, Lettau and Ludvigson (2001)
use the consumption-wealth-income ratio. Most of these studies find significant evidence of
in-sample stock market return predictability.
Evidence that stock market return is in fact predictable is still controversial. A large body of
empirical studies has been devoted to explore econometric problems arising from traditional
predictive models, which typically regress stock market returns in one or more lagged variables.
Much criticism has been raised by the fact that the ample evidence of stock return
Sarkissian, and Simin (2003)). Since much of the empirical work conducts in-sample exercises,
the significance of the tested variables may well be a result of spurious relations. Consequently,
the out-of-sample performance of those variables is much worse (see Bossaerts and Hillion
(1999) and Goyal and Welch (2003 and 2008) for a better insight). Another issue that has been
extensively documented is small sample bias. Exploratory tests find that due to the high
persistence in predictive variables such as dividend yields, stock returns are contemporaneously
correlated with innovations in the predictive variable causing the estimated coefficients to be
biased (see e.g., Nelson and Kim (1993) and Stambaugh (1999)). This bias leads to
overestimation of t-statistics, causing stock return predictability to appear stronger than it
actually is.
In a comprehensive study, Goyal and Welch (2008) reconcile all the predictive variables
suggested in the literature, and test them out-of-sample by running simple predictive
regressions on a single lagged independent variable. Goyal and Welch (2008) compare the
obtained forecasts with the unconditional benchmark, which uses the prevailing historical
mean as the stock market return forecast, and find that virtually all the suggested predictors do
not work out-of-sample as they always underperform the unconditional mean. Goyal and
Welch (2008) go further and imply that none of the variables could have actually helped an
investor in timing the market. More accurately, as Cochrane (2006) states “Goyal and Welch’s
message is that regressions on dividend yields and similar persistent variables are not likely to
be useful in forming real-time forecasts”. Campbell and Thompson (2008), on the other hand,
slightly improve out-of-sample forecasts, by imposing “sign restrictions” on the predictive
regressions’ coefficients and on the forecasts as well. According to Campbell and Thompson
(2008), the estimated coefficient is assumed to be zero when it has the incorrect sign, and the
Is stock market return predictability just a mirage as suggested by Goyal and Welch (2008), or
is it really there? Although this is still an open question, Ferreira and Santa-Clara (2008)
propose an approach – the sum-of-the-parts method – that considerably improves the
out-of-sample forecast performance. In their study, Ferreira and Santa-Clara (2008) provide evidence
that, while traditional predictive regressions show no sign of stock market return predictability,
by decomposing the stock market return in three components – the dividend-price ratio, the
earnings growth, and the growth in the price-earnings ratio -, and forecasting each component
separately, it is possible to considerably increase the predictive power of (almost) all the
variables tested by Goyal and Welch (2008). More importantly, Ferreira and Santa-Clara (2008)
show that an investor who have timed the market with the sum-of-the-parts’ forecasts would
have made substantial economic gains1.
Much of the literature so far, focuses on the US stock market. There is limited research
devoted to international stock markets2, although we have witnessed a growing interest in
examining international predictability in the last decade. One probable reason is the lack of
financial and economic data for international countries. Furthermore, the size of available
samples is in some cases too small for drawing statistical inference. Most studies conducted in
an international set use samples with less than 20 years3 (see Giot and Petitjean (2006)).
Hjalmarsson (2004) provides the broadest study on predictability using international data.
Hjalmarsson (2004) examines the predictability in 40 international stock markets using a
1 Ferreira and Santa-Clara (2008) report certainty equivalent gains of as much as 2.3% per annum relative to the
unconditional historical mean forecasts.
2 Some of the significant literature that focus in International stock markets includes Bossaerts and Hillion (1999),
who study in-sample and out-of-sample stock return predictability in 13 countries besides the U.S., Neeley and Weller (2000) and Ang and Bekaert (2006) conduct tests for 4 International stock markets including the U.S., Giot and Petitjean (2006) as well as Paye and Timmermann (2006) examine 10 countries.
3 The largest sample used by Bossaerts and Hillion (1999) begins in 1969, which represents only 315 monthly
sample that dates back the early 1900’s, and shows that while there is weak evidence that
valuation ratios are robust predictors of stock returns, interest-rate-related variables show
predictive power both in-sample and out-of-sample, and for the majority of the countries
studied4.
In this research, I conduct an extensive analysis of out-of-sample stock market return
predictability of some of the most important international stock markets, in the January 1950
to March 2009 time period. I investigate the predictive power of seven different variables that
have been suggested as stock market return predictors for the US stock market, in four
countries (Canada, France, Japan, and the UK) using both the traditional predictive regression
model and the novel sum-of-the-parts approach. The sum-of-the-parts method decomposes
the stock market return in three components5: the dividend-price ratio, the dividend growth,
and the growth in the price-dividend ratio. Comparing different countries allows to infer on
the robustness of a given predictive model in forecasting stock market returns. In addition, an
international analysis makes it possible to verify if stock market return predictability is a US
phenomena or if the same patterns are observed across countries.
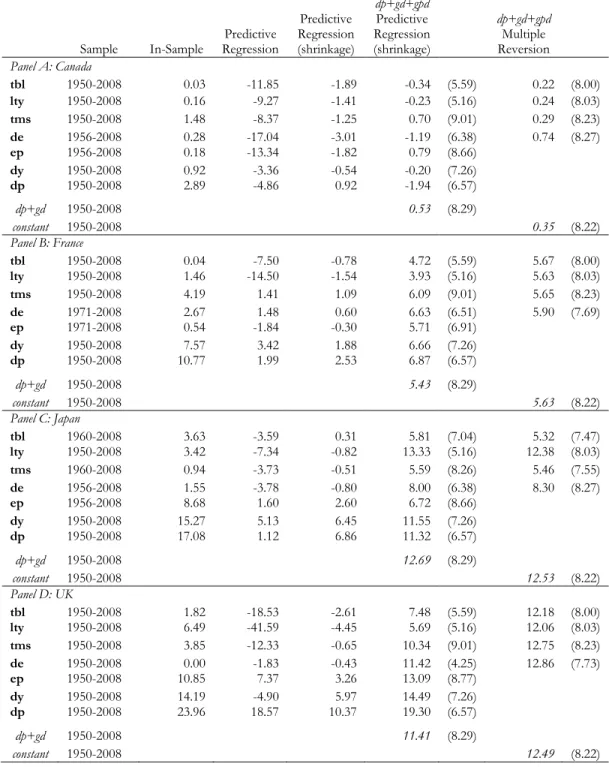
I report several important findings in this study. First, I show that the sum-of-the-parts
decomposition uncovers significant stock market return predictability, while the traditional
predictive model does not in general yield any out-of-sample predictability. Using the
sum-of-the-parts method, I report annual out-of-sample R-square statistics of as much as 6.86%,
13.33% and 19.30% for France, Japan and the UK, respectively. When compared with the
results for the US stock market using the same time period, out-of-sample predictability is
4 These findings are corroborated by Ang and Bekaert (2006), Rapach at al. (2007), and Schrimpf (2008).
5 Ferreira and Santa-Clara (2008) propose a decomposition of the total stock market in a different from the one
strong in Japan and in the UK. These results are in sharp contrast with the findings of
Bossaerts and Hillion (1999), who fail to find evidence of out-of-sample predictability in
thirteen international stock markets.
Second, I provide evidence that there are substantial differences in stock market return
predictability across countries, in line with the findings of Bossaerts and Hillion (1999), Giot
and Petitjean (2006), and Schrimpf (2008). Out-of-sample R-square statistics range from
roughly 0.31% for France to 2.33% for Japan using monthly returns, and from 3.93% for
France to 19.30% for the UK using annual returns. In contrast, evidence of stock return
predictability is much weaker in the Canadian stock market, with out-of-sample R-square
statistics of as much as 0.14% (0.74%) with monthly (annual) data.
Literature on international predictability focus mainly on statistical and econometric facts
related to stock return predictability but typically fails to link this evidence with the economic
significance of the results. In fact, predicting stock market returns is only of investors’ interest
(i.e. is economic significant) if it is possible to use that information to profit from timing the
market. For this purpose, I model the investment decisions, in real time, of an investor who
adopts a trading strategy that uses the forecasts of a given predictive model to allocate her
portfolio between the domestic stock market index and a risk-free asset. I show that except for
the Canadian stock market, market-timing strategies based on the sum-of-the-parts forecasts
always lead to substantial economic profits, when measured in terms of certainty equivalent
gains. For instance, a British investor who had used the sum-of-parts method to forecast the
The remainder of this paper is organized as follows. In Section 2, I provide a detailed
description of the methodology used in this study. Section 3 incorporates the main results of
my research as well as the practical application of my findings. Section 4 concludes.
2. Methodology
2.1 Out-of-sample Predictive Regressions
Using the traditional predictive regression, as in Goyal and Welch (2008), I first run the following
univariate regression:
(1)
where is the stock market return in local currency at period t+1, is a predictive variable
that is known at the end of period t, also in local currency. For instance, is the
earnings-price ratio for the FTSE Index, measured in pounds. In describing each model used in this
analysis, I omit the subscript for each stock market in the formulas in order to simplify the
notation.
To develop this model, I divide the historical interval of T periods in two subsamples: one
initial subsample of t observations - the training sample - where t=1,…,s, and a second
subsample – the forecasting sample – that covers T-t observations.
I use the estimated coefficients at time s - -hat and -hat – obtained by running regression
(1), to forecast the one-period-ahead stock market return as follows:
(2)
where is the expected stock market return, conditional on the information available at
Repeating this procedure recursively up to time T-1 through an expanding window6, I obtain a
time series of forecasts that goes from time s+1 to time T.
One important characteristic of an out-of-sample exercise that distinguishes it from an
in-sample approach, is that the former uses only data available up to the moment the forecast is
made (in this case, up to time s). Thus, every period the model is updated as new information
becomes available. This methodology basically simulates a forecasting exercise in real time, in
which an investor would use only information that is available up to the time she forecasts the
stock market return.
2.2 Shrinkage
I apply the shrinkage technique suggested by Connor (1997) to the estimated predictive
regression coefficients. Estimating coefficients through ordinary least squares (OLS) as in
equation (1), introduces estimation error in the model forecasts. By using shrinkage I am
basically imposing restrictions on the regression coefficients estimates, increasing the precision
of the model forecasts. Thus, shrinkage is valuable in the sense it provides more accurate
results as it reduces estimation error.
I apply shrinkage to the beta coefficient estimate using a Bayesian adjustment as follows:
(3)
where s is the number of observations in the training sample, i is the “shrinkage intensity”, and
is equal to .
The parameter corresponds to the expected forecasting power of the predictive model, and
can be calculated as:
(4)
which in value is approximately close to .
I use a shrinkage intensity (i) of 1,2007 for monthly data and 100 for annual data (see Ferreira
and Santa-Clara (2008)), which I assume to be same for all four international stock markets. By
this, I am also assuming that the four countries have the same expected forecasting power ( ).
As noticed by Connor (1997), this assumption is justified on the basis that “there is no priori
reason to expect one of these markets to have more predictability than another”.
This Bayesian adjustment is applied based on the prior that markets are efficient. Essentially
speaking, it shrinks the estimated slope coefficient towards zero, which is its expected value
under the efficient market hypothesis.
I also apply shrinkage for the intercept coefficient estimate as:
(5)
where is the historical average return up to time s, and are the historical average of the
predictive variable up to time s.
According to the adjustment in equation (5) the unconditional expected stock market return is
going to be equal to its historical average, again coherent with the efficient market hypothesis.
The adjusted coefficients are then used to forecast the one-period-ahead stock market return
as follows:
(6)
2.3 The Sum-of-the-Parts method for stock market returns
The total return on a stock from period t to period t+1 is defined as:
(7)
where is the simple stock return at time t, and the stock price at time t-1 and time t,
respectively, and is the dividend per share at time t.
Equation (7) can be rewritten as the sum of the capital gain and the dividend yield:
(8)
As showed by Ferreira and Santa-Clara (2008), it is possible to work separately in each
component in the right side of equation (8). The capital gain component can be rearranged as
follows:
(9)
where is the price-dividend ratio, is the growth rate in the price-dividend ratio from
On the other hand, the dividend yield component can be expressed as:
(10)
where is the dividend-price ratio at time t.
The return equation can then be rewritten as:
(11)
Taking logs, the right side of equation (11) becomes additive and we have:
(12)
where lower case letters denote natural logs.
2.4 The Sum-of-the-Parts Components
Following Ferreira and Santa-Clara (2008) the stock market return can be forecasted as:
(13)
In essence, equation (13) states that the one-period-ahead forecast for the stock market return
is given by the sum of the estimates of its components. Each component is forecasted
independently according to its time series characteristics. Because the dividend-price ratio is
one-period-ahead dividend-price ratio, . This choice is justified by the fact that the
dividend-price ratio is nearly a random walk (see Goyal and Welch (2003), and Campbell
(2008)).
Concerning the dividend growth, there is still some controversy related to its predictability.
While Lettau and Ludvigson (2002) find evidence of in-sample predictability in the dividend
growth, specifically at long horizons, Cochrane (2008) finds that the dividend growth is close
to unforecastable. Consistent with Cochrane’s view, I estimate the future dividend growth,
, using the 20-year moving average up to time s.
To estimate the growth in the price-dividend ratio, I follow two different approaches. In the
first approach, I use a predictive regression as explained in section 2.1, but in this case the
dependent variable is the growth in the price-dividend ratio. Again, I apply shrinkage to the
estimated coefficients. While shrinkage is applied to the slope coefficient estimate as in
equation (3), shrinkage is used in the intercept coefficient estimate as follows:
(14)
where is the historical average of the predictive variable up to time s.
This is related to the fact that with no prior information, we do not expect the price-dividend
ratio to change. That is, the unconditional expectation of the growth in the price-dividend ratio
is zero.
The one-period-ahead price-dividend ratio growth is then estimated using the adjusted
(15)
The second approach to estimate the growth in the price-dividend ratio, suggested by Ferreira
and Santa-Clara (2008) is the price multiple reversion. According to this approach, the price
multiple will revert to its expected value conditional on the state of the economy. That is, if the
price-dividend ratio is above its expectation, we estimate it will decrease (i.e. the growth in the
price-dividend ratio will be negative) and vice versa.
I first run the following contemporaneous regression of the price-dividend ratio, , on a
given explanatory variable, :
(16)
The expected value of the price-dividend ratio at time s is given by:
(17)
I then use the expected value of the price-dividend ratio obtained in equation (17) to calculate
the residual at time s as follows:
(18)
which is simply the expected value of the growth in the price-dividend ratio at time s,
.
I run a second regression, now of the growth in the price-dividend ratio on the lagged residual
estimated in equation (18):
According to Ferreira and Santa-Clara (2008), this second regression takes into account the
fact that the reversion of the price multiple to its conditional expectation is a slow process.
That is, the reversion of the price-dividend ratio does not take place in a single period.
I apply shrinkage to the estimated coefficient – c-hat and d-hat - as in the first approach to
estimate the growth in the price-dividend ratio.
Finally, the growth in the price-dividend ratio is forecasted as follows:
(20)
2.4 Measuring Statistical Performance
To measure the performance of each model forecasts, I calculate out-of-sample R-square
statistics (see Goyal and Welch (2008), and Ferreira and Santa Clara (2008)) as follows:
(21)
where corresponds to the mean-squared error of a given forecasting model, and
the mean-squared error of the unconditional benchmark.
This out-of-sample R-square statistic is intended to measure how well a forecasting model fits
the data. It compares the mean-squared error from the stock market return forecasts using a
given predictive model with the forecasts produced by the unconditional model, which uses
the historical mean from period 1 to s as the forecast of the stock market return at time s+1.
This is what is called the naïve forecast since it implicitly assumes that expected returns are
forecasting ability than the unconditional benchmark, i.e. outperforms the historical mean, and
a negative out-of-sample R-square indicates otherwise.
3. Empirical Results
3.1 Data
The data used in this study is from Global Financial Data. Country data consists of monthly
and annual stock market index prices, total returns (including reinvested dividends), and
dividends, in local currency8. This study focus in four international stock markets: Canada,
France, Japan, and the UK. For Canada I use the S&P/TSX-300 Index, for France the
SBF-250 Index, for Japan the TOPIX, and for the UK, the FTSE Index.
My decision concerning the countries and predictive variables is entirely due to the length of
historical data available. Since a reasonable sample size is crucial in testing predictive
regressions, I choose the countries and corresponding predictive variables that cover the
largest time period.
I examine the same sample period for all international stock markets, which goes from January
1950 to March 2009 for monthly data, and from 1950 to 2008 for annual data9. Recent
research on international stock market return predictability frequently examines different time
periods for different stock markets in order to have the largest sample coverage as possible
8 Empirical research has exploited stock market return predictability using a common currency, usually the U.S.
dollar. When this is the case, empirical tests can be capturing forecastability in exchange rate. Thus, it is not possible to clearly separate the ability of the predictive variable to forecast stock returns and to forecast exchange rates.
9 The only exceptions are earnings-related variables for all four countries, and the treasury-bill rate and term
(e.g., Hjalmarsson (2004), and Schrimpf (2008)). But predictive models are extremely sensitive
to the sample period used10. By using the same time period, the results for the different stock
markets can be directly compared.
Seven common predictive variables among interest-rate variables and valuation ratios are used
for all four countries. The set of predictors examined in this study is the following:
Dividend-price ratio (dp): the difference between the log of dividends and the log of
prices.
Dividend yield (dy): the difference between the log of dividends and the log of lagged
prices.
Dividend payout (de): the difference between the log of dividends and the log of earnings.
Earnings-price ratio (ep): the difference between the log of earnings and log of prices.
Long-term yield (lty): the 10-year Government bond yield or a Government bond yield
with the closest maturity when the former is not available11.
Term spread (tms): the difference between the long-term yield and the treasury-bill rate.
Treasury-bill rate (tbl): the 3-month Treasury bill rate.
In the multiple reversion approach to estimate the price-dividend ratio growth component, I
only use the predictive variables that do not depend on stock prices, i.e. the dividend payout,
the long-term yield, the term spread and the treasury-bill rate.
10 A number of empirical studies find evidence that stock market return predictability is stronger in the post-War
period (see e.g., Fama and French (1988) and Kim and Nelson (1993)). Bossaerts and Hillion (1999) test two different time periods, one that includes the entire sample and other from January 1971 to August 1980, and find significant differences between the two sample periods.
11 The two exceptions are the UK and Japan, for which the 20-year and 7-year government bond yields are used,
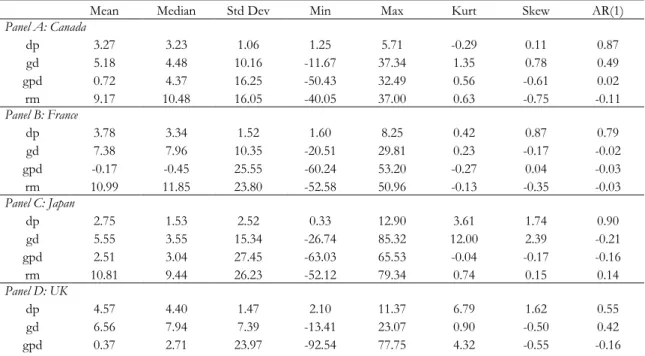
Tables 1 and 2 present summary statistics for the sum-of-the-parts components for each
country, at the monthly and annual frequencies, respectively. For the full sample period
(January 1950 to March 2009 for monthly returns, and 1950 to 2008 for annual returns),
average stock market returns are fairly similar across countries, where Canada exhibits the
lowest historical average return (0.78% and 9.17% for monthly and annual data, respectively),
and the UK, the highest historical average return (0.95% and 11.50% for monthly and annual
data, respectively). The dividend growth is the dominating component in total stock market
returns for all four international stock markets. While for Canada, France, and the UK, the
growth in the price-dividend ratio component accounts for only a small part of the total stock
market return, in the Japanese market it has nearly the same weight in the total stock market
return as the dividend price component. The last column in Tables 1 and 2 reports
autocorrelation coefficients for each component. Consistent with what is observed in the US
stock market, the dividend-price ratio is extremely persistent, in particular at the monthly
frequency.
3.2 International Stock Market Return Predictability
This study examines the out-of-sample predictability in four international stock markets –
Canada, France, Japan, and the UK. Although stock market return predictability varies
considerably across countries the results of this study provide strong evidence of
out-of-sample predictability using international data.
Tables 3 and 4 present results for in-sample and out-of-sample R-square statistics for monthly
and annual stock market returns, respectively. The forecasting sample begins 20 years after the
corresponds to one predictive variable. The predictive variables are then divided by their type.
The first three rows present interest-rate-related variables, namely the short-term interest rate,
the long-term interest rate, and the term spread. The next four rows consider valuation ratios:
the dividend payout, the earnings-price ratio, the dividend yield, and the dividend-price ratio.
The third column of Tables 3 and 4 displays in-sample R-square statistics. Common to all four
countries, in-sample predictability is small. Overall, dividend-related variables appear to have
the highest in-sample predictive power at both the monthly and the annual frequency. We can
see that in-sample predictability differs substantially across countries. In-sample R-square
statistics vary from roughly 0% for the French stock market to 2.43% for the British stock
market with monthly data, and from 0.03% for the Canadian stock market to 23.96% for the
British stock market with annual data.
The next columns of Tables 3 and 4 report out-of-sample R-square statistics of the predictive
models relative to the unconditional benchmark. The fourth and fifth columns display
forecasting results from the traditional predictive regression model and from predictive
regressions with shrinkage. The results from the sum-of-the-parts method using predictive
regression with shrinkage to estimate the growth in the price-dividend ratio and using the
multiple reversion approach are displayed in the sixth and eighth columns, respectively. The
value in the last row in each panel of Tables 3 and 4 (constant) corresponds to out-of-sample
R-square statistics of estimating the growth in the price-dividend ratio with its historical average
in the multiple reversion approach. The last figure in the sixth column of Tables 3 and 4
(dp+dg) presents results for the sum-of-the-parts method using only the dividend-price ratio
and dividend growth components to forecast stock market returns(i.e. estimating the expected
ratio improves the out-of-sample R-square measure, than the predictive variable used
introduces additional relevant information to the model.
The seventh and ninth columns in Tables 3 and 4 reports the results for the US market (in
brackets) using the sum-of-the-parts method for the same sample period. Since predictability
changes over time, we need to reestimate the out-of-sample forecasts for the US stock market
using the same time period for comparison purposes.
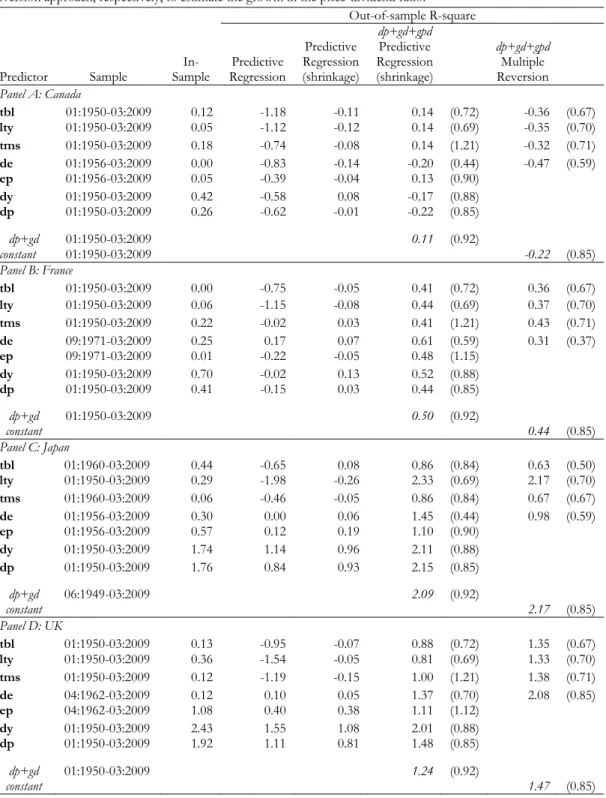
Panel A of Tables 3 and 4 displays the results for the Canadian stock market. Evidence of
stock market return predictability is fairly weak for Canada, with out-of-sample R-squares of as
much as 0.14% at the monthly frequency, and 0.79% at the annual frequency, using the
sum-of-the-parts approach. When compared with the results for the US stock market, this evidence
is even less compelling. Although the sum-of-the-parts method has in general higher
forecasting performance than both the predictive regression approach and the predictive
regression with shrinkage, the out-of-sample performance relative to the historical mean in
Canada is poor. At the monthly frequency, two predictive variables out of seven (the dividend
yield and dividend price ratio) deliver negative out-of-sample R-square statistics. Still at the
monthly frequency, interest-rate-related variables appear to have the highest out-of-sample
predictive power when estimating the growth in the price-dividend ratio using the predictive
regression model with shrinkage. In contrast, the multiple reversion approach always generates
negative R-square statistics.
If evidence of out-of-sample predictability in Canada is weak at a monthly horizon, it is almost
nil at an annual horizon. Forecasting stock market returns using only the dividend-price ratio
predictive regression model with shrinkage to estimate the growth in the price-dividend ratio,
only the term spread and the earnings price ratio outperform the historical average. The
multiple reversion approach improves the forecasting performance, relative to the predictive
regression model with shrinkage, of virtually all the predictive variables using annual data.
Results for France are presented in Panel B of Tables 3 and 4. Contrary to Canada, evidence of
stock market predictability is visible in the French market. While using traditional predictive
regressions leads in most cases to negative out-of-sample R-square statistics, estimating
separately each stock market return component significantly improves the results. Using the
dividend-price ratio and the dividend growth components alone gives an out-of-sample
R-square of 0.50% at the monthly frequency, and 5.43% at the annual frequency. While at a
monthly horizon, predictive variables do not in general improve the forecasting performance
of the sum-of-the-parts approach, at an annual horizon, except for the treasury-bill rate and
the long-term yield, using predictive variables to estimate the growth in the price-dividend ratio
always enhances the out-of-sample forecasting ability. Out-of-sample R-squares range from
5.71% using the earnings-price ratio to 6.87% using the dividend-price ratio.
Results for Japan are provided in Panel C of Tables 3 and 4. Out-of-sample predictability is
undoubtedly strong in Japan, especially at the monthly frequency. In the case of the Japanese
stock market, valuation ratios generate positive out-of-sample R-square measures when using
the traditional predictive regression model. The sum-of-the-parts method improves
considerably the forecasting performance on the traditional predictive regression model and
the predictive regression model with shrinkage. Estimating a zero growth for the
price-dividend ratio leads to an out-of-sample R-square of 2.09% at the monthly frequency, and
the same sample period. In fact, much of the forecasting performance of the sum-of-the-parts
method comes from estimating the stock market return using only the dividend-price ratio and
dividend growth components. While at a monthly horizon the long-term yield, the dividend
yield and the dividend-price ratio generate even higher out-of-sample R-square results (2.34%,
2.10%, and 2.14%, respectively) at an annual horizon only the long-term yield improves the
out-of-sample R-square statistic (13.33%). Finally, the multiple reversion approach to estimate
the price-dividend ratio growth delivers similar out-of-sample R-squares to those obtained
using the predictive regression with shrinkage.
Panel D of Tables 3 and 4 displays results for the UK. As for the Japanese market,
out-of-sample predictability is strong in the UK, even when compared to the US stock market, using
monthly data and annual data as well. The sum-of-the-parts method always improves
out-of-sample forecasts when compared to the traditional predictive regression model, and the
predictive regression model with shrinkage. Estimating the dividend price ratio and the
dividend growth components alone leads to an out-of-sample R-square of 1.24% with monthly
frequency, and 11.41% with annual frequency. Valuation ratios generate higher out-of-sample
R-square statistics at the annual frequency: 11.42% (dividend payout), 13.09% (earnings-price
ratio), 14.49% (dividend yield), and 19.30% (dividend-price ratio). In the case of the British
stock market, the multiple reversion approach increases even more the out-of-sample
performance. Using only the historical average of the growth in the price-dividend ratio leads
to an out-of-sample R-square of 1.47% using monthly returns and 12.49% using annual
returns.
Overall, the sum-of-the-parts method systematically improves the out-of-sample predictability
(2008) for the US stock market. These results confirm the robustness of the sum-of-the-parts
method across countries.
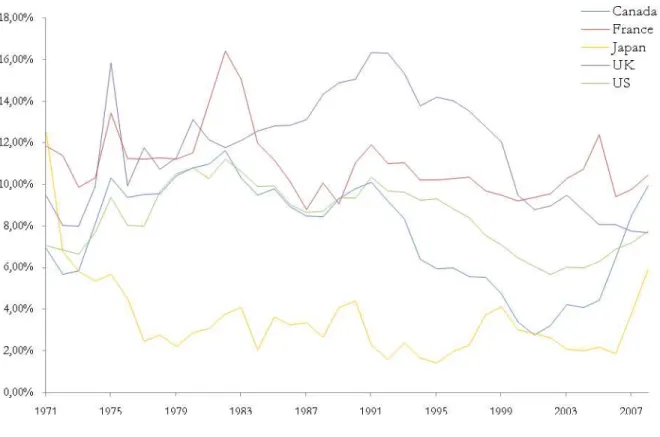
Figure 1 plots annual forecasts for the four international stock markets and for the US stock
market from 1971 to 2008 using the sum-of-the-parts method. The figure shows that stock
market return estimates differ considerably across countries. For example, in 1991 the annual
expected return for the UK stock market was 16.36% while for the Japanese stock market was
only 4.43%.
3.3 Market-Timing Strategies
The results I report in this study would not be useful for an investor if it was not possible to
test for their economic significance. In fact, out-of-sample R-squares are small in size. As
noticed by Cochrane (1999), market-timing strategies are “the most obvious implication of
return predictability”.
Assuming an investor with a mean-variance criterion, and a risk-aversion coefficient of , the
standard stock market portfolio allocation formula is given by:
(22)
where is the stock market return forecast from a given model, is the risk-free
rate12 at the end of period
s, and is the variance in stock market returns up to time s.
Note that the investor allocates a weight to the stock market portfolio at time s13, and
maintains this position for one-month (or one-year) time-horizon without rebalancing the
portfolio. Furthermore, no restriction on short-selling is imposed, so the weight invested in the
stock market can take any value, positive or negative14.
Equation (22) is built in such a way that the portfolio allocation changes as forecasts are
updated. That is, if an investor forecasts a higher stock market return for the next period, she
will allocate a higher weight to the market portfolio, and vice versa.
The realized return at time s+1 of a portfolio that invests only in the stock market and in the
risk-free asset will be:
(23)
where is the realized return on the stock market at time s+1, and is the return on
the risk-free asset also at time s+1.
By timing the market recursively, I obtain a time series of portfolio returns from time s+1 to
time T.
As suggested by Brennan and Xia (2004), and further employed by Campbell and Thompson
(2008), Goyal and Welch (2008), and Ferreira and Santa-Clara (2008), it is possible to evaluate
trading strategies based upon the out-of-sample forecasts for the stock market returns,
calculating the certainty equivalent measure ( ) as follows:
(24)
13 The weight that an investor chooses to allocate to the stock market portfolio at time s+1 is estimated at time s, using only
data that was available up to that period in time.
14 I also build trading strategies imposing restrictions on the weight an investor allocates to the stock market portfolio as in
where is the average portfolio return from time s+1 to time T, is the risk-aversion
coefficient and is assumed to be 2, and is the variance of the portfolio returns.
The certainty equivalent of a given strategy is the return that makes the investor indifferent
between investing in the strategy and investing in the risk-free asset.
Table 9 displays certainty equivalent gains relative to an allocation based on the unconditional
model forecasts. Monthly certainty equivalent measures from the unconditional benchmark
range from -0.1% for Japan, to 0.51% and 0.54%, for France and the UK, and to 0.61% for
Canada. An investor who has used the traditional predictive regression model to forecast stock
market returns of all four countries would have had in most cases economic losses. With the
exception of the Canadian stock market, the sum-of-the-parts method systematically leads to
economic profits when measured in terms of certainty equivalent gains. While at the monthly
frequency results are somewhat mixed, at the annual frequency market-timing strategies based
on the sum-of-the-parts forecasts for the French stock market, the Japanese stock market, and
the British stock market, generates higher certainty equivalent gains, when compared to the
certainty equivalent gains for the US stock market. The largest economic profit, in annual
terms, for a Canadian investor is 2.20%, for a French investor is 2.95%, for a Japanese investor
is 5.70%, and for a British investor is 5.98%.
3.4 International Asset Allocation
I have assessed so far the economic significance of stock market return predictability to a
representative investor that invests only in his domestic country. In this section, I take the
only to the domestic stock market index, or use his prior knowledge of stock market return
predictability to expand asset allocation to an international set, holding foreign stock market
indices as well. I follow two different approaches to model the investment decision of such
investor - a parametric approach, and a nonparametric approach.
Table 7 reports correlations between stock markets for the 1950 to 2009 period. According to
the traditional portfolio theory, international asset allocation should provide benefits for an
investor due to the low correlations across countries.
In the first approach, the US investor chooses to allocate his portfolio between the US stock
market and the four international stock markets. The Markowitz optimal portfolio weights’
vector for a risk-averse investor with a mean-variance criterion is given by:
(25)
where is the variance-covariance matrix up to time s and is estimated using all data
available up that period in time, and is the vector of expected stock market returns (based
on the sum-of-the-parts forecasts) in excess of the risk-free rate at the end of period s.
I impose restrictions on short-selling, so the weight invested in a given stock market index can
never take negative values. The weights are then rescaled so they add up to one.
In each point in time, the US investor updates the weights he allocates to each stock market as
new information becomes available. In this case not only changing forecasts, but also changes
At time s+1 the realized return of the portfolio is calculated as:
(26)
where is the vector of weights estimated at time s, and is the vector of realized returns
for the five stock market indices at time s+1.
In the nonparametric approach, I consider two different trading strategies. In the first trading
strategy, the US investor allocates his portfolio between the two stock markets with the largest
expected returns. He invests a fraction of 50 percent of his portfolio to each stock market
index. Although these weights remain fixed for the entire time period, the composition of the
portfolio may change over time with the forecasts for the different stock markets. For
example, in August 2006 the US investor would have allocated half of his portfolio to the
French stock market and half to the British stock market, while in the subsequent month he
would have allocated funds between the French stock market and the Canadian stock market.
In the second strategy, the investor adopts a long-short strategy that invests a fraction of 100
percent of the portfolio in the long position and a fraction of -100 percent in the short
position. The investor takes a short position on the stock market index with the lowest
expected return and uses the proceeds to invest in the stock market with the highest expected
return.
To measure the performance of the trading strategies, I calculate Sharpe ratios as follows:
where is the average return on the portfolio from time s+1 to time T, is the average
risk-free rate for the US also from time s+1 to time T, and is the standard deviation of the
portfolio returns.
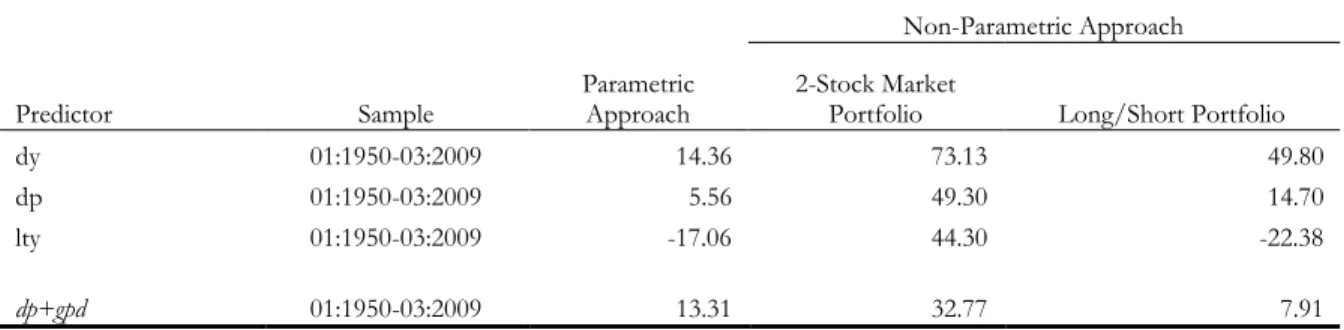
Table 8 displays annualized Sharpe ratio gains of both the parametric and non-parametric
approaches from February 1970 to March 2009. Gains in Sharpe ratio compare the Sharpe
ratio of an international investment strategy with the Sharpe ratio of an investment strategy
that holds only the US stock market (the benchmark portfolio). Table 8 shows that allowing a
US investor to invest in international stock markets expands its mean-variance frontier.
Investing only in the US stock market generates a Sharpe ratio of roughly 0.21%. The
maximum gain in Sharpe ratio from investing additionally in the four international stock
market indices, based on the sum-of-the parts forecasts is 14.36% (dividend yield). The
nonparametric method gives even larger economic profits. An investor who had used the
sum-of-the-parts forecasts to allocate her portfolio to the stock market indices with the highest
expected returns would have had an economic profit of as much as 79% when measured in
terms of Sharpe ratio gains.
4. Conclusions
Stock market return predictability is of major importance not only for researchers but also for
practitioners, and decision makers. That is why it has been received so much attention in
finance literature in the past decades. But most of the literature focuses on the U.S. market.
I extend the sum-of-the-parts method to forecast stock market returns, suggest by Ferreira and
Santa-Clara (2008), to four of the major international stock markets - Canada, France, Japan,
Welch (2008) performs poorly internationally, the sum-of-the-parts approach consistently
improves on the predictive regression model and on the predictive regression model with
shrinkage in the period of 1950 to 2009, in line with the results of Ferreira and Santa-Clara
(2008) for the US stock market.
Several conclusions can be drawn from the results. First, the sum-of-the-parts approach is not
only statistically robust across countries, but also economically significant. I investigate the
potential economic gains of market-timing strategies that hold the domestic stock market and
the risk-free asset. Certainty equivalent gains from timing the market with the sum-of-the-parts
method forecasts relative to the unconditional model forecasts are substantial.
Second, the sum-of-parts method leads to potentially large economic benefits for a US
investor that allocates his portfolio to international stock market indices additionally to the US
stock market based on the sum-of-the-parts forecasts. Expanding the investment opportunities
set of such investor relative to investing only in the domestic stock market leads to significant
economic profits as measured by gains in Sharpe ratio.
Finally, this study uncovers substantial differences in stock market return predictability,
specifically out-of-sample. I provide evidence that stock return predictability is not a
standardized phenomenon across countries. When compared to the US market, predictability
is strong in Japan and the UK. What drives such differences in expected returns across
countries is still an open question in finance literature. One possible explanation is simply
compensation for risk. But compensation for risk cannot explain for instance the 14 percent
difference in expected returns between the British stock market and the Japanese stock market
References
Ang, Andrew, and Geert Bekaert, 2007, “Stock market return predictability: Is it there?”,
Review of Financial Studies 20.
Bossaerts, Peter, and Pierre Hillion, 1999, “Implementing statistical criteria to select return forecasting models: what do we learn?”, Review of Financial Studies 12.
Breen, William, Lawrence Glosten, and Ravi Lagannathan, 1989, “Economic significance of predictable variations in stock index returns”, Journal of Finance 64.
Campbell, John, 1987, “Stock returns and term structure”, Journal of Financial Economics 18, 373-399.
Campbell, John, 2008, “Estimating the equity premium”, Canadian Economic Review 41, 1-21. Campbell, John, and Robert Shiller, 1988, “Stock prices, earnings and expected dividends”,
Journal of Finance 43, 661-676.
Campbell, J. Y., A. W. Lo, and C. MacKinlay, 1997, “The econometrics of financial markets”, Princeton University Press, Princeton, NJ.
Campbell, John, and Samuel Thompson, 2008, “Predicting the equity premium out of sample: Can anything beat the historical average?”, Review of Financial Studies 21, 1509-1531. Campbell, John, and Motohiro Yogo, 2006, “Efficient tests of stock return predictability”,
Journal of Financial Economics 81, 27-60.
Cochrane, John, 1991, “Explaining the variance of price-dividend ratios”, Review of Financial Studies, 5(2), 243-280.
Cochrane, John, 1999, “Portfolio Advice for a Multifactor World”, Economic Perspectives Federal Reserve Bank of Chicago 23(3), 59-78.
Cochrane, John, 2008, “The dog that didn’t bark: A defense of return predictability”,
Review of Financial Studies 21, 1533-1575.
Fama, Eugene, and Kenneth French, 2002, “The equity premium”, Journal of Finance 57, 637-659.
Fama, Eugene, and Kenneth French, 1988, “Dividend yields and expected stock returns”,
Journal of Financial Economics 22, 3-25.
Ferreira, Miguel, and Pedro Santa-Clara, 2008, “Forecasting the stock market returns: the sum of the parts is more than the whole”, working paper, Universidade Nova de Lisboa. Giot, P., and M. Petitjean, 2006, “International stock return predictability: Statistical evidence and economic significance”, CORE Discussion paper 88.
Goetzmann, W. N., and Jorion, P. (1993) “Testing the predictive power of dividend yields”, Journal of Finance, 48, 663-679.
Goyal, Amit, and Ivo Welch, 2003, “Predicting the equity premium with dividend ratios”,
Management Science 5, 639–654.
Goyal, Amit, and Ivo Welch, 2008, “A comprehensive look at the empirical performance of equity premium prediction”, Review of Financial Studies 21, 1255-1508.
Guo, Hui, 2006, “On the out-of-sample predictability of stock market returns”, Journal of Business 79, 645-670.
Guo, Hui, and Robert Savickas, 2006, “Understanding Stock Return Predictability”, working paper, Federal Reserve Bank of St. Louis.
Hjalmarsson, Erik, 2004, “On the predictability of global stock returns”, working paper, Yale University.
Hjalmarsson, Erik, 2006, “Should we expect significant out-of-sample results when predicting stock returns?”, International Finance Discussion Papers 855, Board of Governors of the Federal Reserve System.
Hodrick, Robert, 1992, “Dividend yields and expected stock returns: Alternative procedures for inference and measurement”, Review of Financial Studies 5, 357-386.
Inoue, Atsushi, and Lillian Kilian, 2004, “In-sample or out-of-sample tests of predictability: Which one should we use?”, Econometric Reviews 23, 371-402.
Keim, Donald B., Stambaugh, Robert F., 1986, “Predicting returns in the stock and bond markets”, Journal of Financial Economics 17, 357-390.
Kim, M. J., and C. R. Nelson, 1993, “Predictable stock returns: The role of small sample bias”, Journal of Finance 48, 641-661.
Lamont, Owen, 1998, “Earnings and expected returns”, Journal of Finance 53, 1563-1587. Lettau, Martin, and Sydney Ludvigson, 2001, “Consumption, aggregate wealth and expected stock returns”, Journal of Finance 56, 815-849.
Lewellen, Jonathan, 2004, “Predicting returns with financial ratios”, Journal of Financial Economics 74, 209-235.
Neely, C. J., and P. Weller, 2000, “Predictability in international asset returns: A reexamination”, Journal of Financial and Quantitative Analysis 35 (4), 601-620.
Paye, B., A. Timmermann, 2006, “Instability of return prediction models”, Journal of Financial Economics 13 (1), 274-315.
Pontiff, Jeffrey, and Lawrence D. Schall, 1998, “Book-to-market ratios as predictors of market returns”, Journal of Financial Economics 49, 141-160.
Schrimpf, Andreas, 2008, “International stock return predictability under model uncertainty”, discussion paper 08-048, ZEW - Centre for European Economic Research. Stambaugh, Robert F., 1999, “Predictive regressions”, Journal of Financial Economics 54, 375-421.
Table 1 - Monthly Summary Statistics
This table displays summary statistics on the stock market return components at the monthly frequency for each international stock market. The sample period is from January 1950 to March 2009. dp stands for dividend-price ratio, gd stands for the dividend growth, gpd stands for the growth in the price-dividend ratio, and rm is the total stock market return.
Mean Median Std Dev Min Max Kurt Skew AR(1)
Panel A: Canada
dp 0.28 0.28 0.09 0.08 0.52 -0.38 0.22 0.99
gd 0.43 0.40 2.53 -19.04 22.79 20.57 0.38 -0.02
gpd 0.07 0.01 4.71 -27.09 19.41 3.71 -0.70 0.08
rm 0.78 1.17 4.44 -25.52 15.31 3.76 -0.97 0.12
Panel B: France
dp 0.32 0.29 0.13 0.12 0.82 0.61 0.92 0.98
gd 0.63 0.48 3.86 -37.03 19.32 15.36 -0.78 -0.16
gpd -0.08 -0.16 6.58 -29.01 43.40 3.94 0.04 0.02
rm 0.86 1.25 5.36 -24.62 20.89 1.70 -0.38 0.15
Panel C: Japan
dp 0.24 0.13 0.23 0.03 1.17 1.91 1.56 0.99
gd 0.47 0.26 4.97 -35.76 25.11 6.99 -0.20 -0.15
gpd 0.19 0.22 5.95 -31.65 34.57 3.89 -0.44 0.18
rm 0.90 1.04 5.73 -29.78 24.69 2.42 -0.37 0.06
Panel D: UK
dp 0.38 0.38 0.11 0.17 1.00 2.25 0.65 0.98
gd 0.54 0.44 3.59 -19.29 27.68 10.00 0.02 -0.29
gpd 0.03 0.24 4.82 -25.39 39.56 7.69 0.32 0.22
rm 0.95 1.41 5.20 -30.80 43.24 8.85 0.02 0.11
Table 2 - Annual Summary Statistiscs
This table displays summary statistics on the stock market return components at the annual frequency for each international stock market. The sample period is from 1950 to 2008. dp stands for dividend-price ratio, gd stands for the dividend growth,
gpd stands for the growth in the price-dividend ratio, and rm is the total stock market return.
Mean Median Std Dev Min Max Kurt Skew AR(1)
Panel A: Canada
dp 3.27 3.23 1.06 1.25 5.71 -0.29 0.11 0.87
gd 5.18 4.48 10.16 -11.67 37.34 1.35 0.78 0.49
gpd 0.72 4.37 16.25 -50.43 32.49 0.56 -0.61 0.02
rm 9.17 10.48 16.05 -40.05 37.00 0.63 -0.75 -0.11
Panel B: France
dp 3.78 3.34 1.52 1.60 8.25 0.42 0.87 0.79
gd 7.38 7.96 10.35 -20.51 29.81 0.23 -0.17 -0.02
gpd -0.17 -0.45 25.55 -60.24 53.20 -0.27 0.04 -0.03
rm 10.99 11.85 23.80 -52.58 50.96 -0.13 -0.35 -0.03
Panel C: Japan
dp 2.75 1.53 2.52 0.33 12.90 3.61 1.74 0.90
gd 5.55 3.55 15.34 -26.74 85.32 12.00 2.39 -0.21
gpd 2.51 3.04 27.45 -63.03 65.53 -0.04 -0.17 -0.16
rm 10.81 9.44 26.23 -52.12 79.34 0.74 0.15 0.14
Panel D: UK
dp 4.57 4.40 1.47 2.10 11.37 6.79 1.62 0.55
gd 6.56 7.94 7.39 -13.41 23.07 0.90 -0.50 0.42
Table 3 - Monthly Forecasts
This table presents in-sample and out-of-sample R-square statistics (in percentage) at the monthly frequency for each international stock market. Each row corresponds to one predictive variable. The last row in each panel corresponds to sum-of-the-parts forecasts when the growth in the price-dividend ratio is estimated to be zero (i.e. using only the dividend price and dividend growth components). In-sample R-square statistics are obtained using the full sample. The out-of-sample R-square measure compares the mean-squared-error of a given model with the mean-squared error of the unconditional historical average. The forecast sample starts 20 years after the sample begins. Values in the seventh and ninth columns (in brackets) display sum-of-the-parts results for the US stock market using the predictive regression model with shrinkage, and the multiple reversion approach, respectively, to estimate the growth in the price-dividend ratio.
Out-of-sample R-square
Predictor Sample
In-Sample Predictive Regression Predictive Regression (shrinkage) dp+gd+gpd Predictive Regression (shrinkage) dp+gd+gpd Multiple Reversion
Panel A: Canada
tbl 01:1950-03:2009 0.12 -1.18 -0.11 0.14 (0.72) -0.36 (0.67)
lty 01:1950-03:2009 0.05 -1.12 -0.12 0.14 (0.69) -0.35 (0.70)
tms 01:1950-03:2009 0.18 -0.74 -0.08 0.14 (1.21) -0.32 (0.71)
de 01:1956-03:2009 0.00 -0.83 -0.14 -0.20 (0.44) -0.47 (0.59)
ep 01:1956-03:2009 0.05 -0.39 -0.04 0.13 (0.90)
dy 01:1950-03:2009 0.42 -0.58 0.08 -0.17 (0.88)
dp 01:1950-03:2009 0.26 -0.62 -0.01 -0.22 (0.85)
dp+gd 01:1950-03:2009 0.11 (0.92)
constant 01:1950-03:2009 -0.22 (0.85)
Panel B: France
tbl 01:1950-03:2009 0.00 -0.75 -0.05 0.41 (0.72) 0.36 (0.67)
lty 01:1950-03:2009 0.06 -1.15 -0.08 0.44 (0.69) 0.37 (0.70)
tms 01:1950-03:2009 0.22 -0.02 0.03 0.41 (1.21) 0.43 (0.71)
de 09:1971-03:2009 0.25 0.17 0.07 0.61 (0.59) 0.31 (0.37)
ep 09:1971-03:2009 0.01 -0.22 -0.05 0.48 (1.15)
dy 01:1950-03:2009 0.70 -0.02 0.13 0.52 (0.88)
dp 01:1950-03:2009 0.41 -0.15 0.03 0.44 (0.85)
dp+gd 01:1950-03:2009 0.50 (0.92)
constant 0.44 (0.85)
Panel C: Japan
tbl 01:1960-03:2009 0.44 -0.65 0.08 0.86 (0.84) 0.63 (0.50)
lty 01:1950-03:2009 0.29 -1.98 -0.26 2.33 (0.69) 2.17 (0.70)
tms 01:1960-03:2009 0.06 -0.46 -0.05 0.86 (0.84) 0.67 (0.67)
de 01:1956-03:2009 0.30 0.00 0.06 1.45 (0.44) 0.98 (0.59)
ep 01:1956-03:2009 0.57 0.12 0.19 1.10 (0.90)
dy 01:1950-03:2009 1.74 1.14 0.96 2.11 (0.88)
dp 01:1950-03:2009 1.76 0.84 0.93 2.15 (0.85)
dp+gd 06:1949-03:2009 2.09 (0.92)
constant 2.17 (0.85)
Panel D: UK
tbl 01:1950-03:2009 0.13 -0.95 -0.07 0.88 (0.72) 1.35 (0.67)
lty 01:1950-03:2009 0.36 -1.54 -0.05 0.81 (0.69) 1.33 (0.70)
tms 01:1950-03:2009 0.12 -1.19 -0.15 1.00 (1.21) 1.38 (0.71)
de 04:1962-03:2009 0.12 0.10 0.05 1.37 (0.70) 2.08 (0.85)
ep 04:1962-03:2009 1.08 0.40 0.38 1.11 (1.12)
dy 01:1950-03:2009 2.43 1.55 1.08 2.01 (0.88)
dp 01:1950-03:2009 1.92 1.11 0.81 1.48 (0.85)
dp+gd 01:1950-03:2009 1.24 (0.92)
Table 4 - Annual Forecasts
This table presents in-sample and out-of-sample R-square statistics (in percentage) at the annual frequency for each international stock market. Each row corresponds to one predictive variable. The last row in each panel corresponds to sum-of-the-parts forecasts when the growth in the price-dividend ratio is estimated to be zero (i.e. using only the dividend price and dividend growth components). In-sample R-square statistics are obtained using the full sample. The out-of-sample R-square measure compares the mean-squared-error of a given forecasting model with the mean-squared error of the unconditional historical average. The forecast sample starts 20 years after the sample begins. The values in the seventh and ninth columns (in brackets) correspond to sum-of-the-parts results for the US stock market using the predictive regression model with shrinkage, and the multiple reversion approach, respectively, to estimate the growth in the price-dividend ratio.
Out-of-sample R-square
Sample In-Sample
Predictive Regression Predictive Regression (shrinkage) dp+gd+gpd Predictive Regression (shrinkage) dp+gd+gpd Multiple Reversion
Panel A: Canada
tbl 1950-2008 0.03 -11.85 -1.89 -0.34 (5.59) 0.22 (8.00)
lty 1950-2008 0.16 -9.27 -1.41 -0.23 (5.16) 0.24 (8.03)
tms 1950-2008 1.48 -8.37 -1.25 0.70 (9.01) 0.29 (8.23)
de 1956-2008 0.28 -17.04 -3.01 -1.19 (6.38) 0.74 (8.27)
ep 1956-2008 0.18 -13.34 -1.82 0.79 (8.66)
dy 1950-2008 0.92 -3.36 -0.54 -0.20 (7.26)
dp 1950-2008 2.89 -4.86 0.92 -1.94 (6.57)
dp+gd 1950-2008 0.53 (8.29)
constant 1950-2008 0.35 (8.22)
Panel B: France
tbl 1950-2008 0.04 -7.50 -0.78 4.72 (5.59) 5.67 (8.00)
lty 1950-2008 1.46 -14.50 -1.54 3.93 (5.16) 5.63 (8.03)
tms 1950-2008 4.19 1.41 1.09 6.09 (9.01) 5.65 (8.23)
de 1971-2008 2.67 1.48 0.60 6.63 (6.51) 5.90 (7.69)
ep 1971-2008 0.54 -1.84 -0.30 5.71 (6.91)
dy 1950-2008 7.57 3.42 1.88 6.66 (7.26)
dp 1950-2008 10.77 1.99 2.53 6.87 (6.57)
dp+gd 1950-2008 5.43 (8.29)
constant 1950-2008 5.63 (8.22)
Panel C: Japan
tbl 1960-2008 3.63 -3.59 0.31 5.81 (7.04) 5.32 (7.47)
lty 1950-2008 3.42 -7.34 -0.82 13.33 (5.16) 12.38 (8.03)
tms 1960-2008 0.94 -3.73 -0.51 5.59 (8.26) 5.46 (7.55)
de 1956-2008 1.55 -3.78 -0.80 8.00 (6.38) 8.30 (8.27)
ep 1956-2008 8.68 1.60 2.60 6.72 (8.66)
dy 1950-2008 15.27 5.13 6.45 11.55 (7.26)
dp 1950-2008 17.08 1.12 6.86 11.32 (6.57)
dp+gd 1950-2008 12.69 (8.29)
constant 1950-2008 12.53 (8.22)
Panel D: UK
tbl 1950-2008 1.82 -18.53 -2.61 7.48 (5.59) 12.18 (8.00)
lty 1950-2008 6.49 -41.59 -4.45 5.69 (5.16) 12.06 (8.03)
tms 1950-2008 3.85 -12.33 -0.65 10.34 (9.01) 12.75 (8.23)
de 1950-2008 0.00 -1.83 -0.43 11.42 (4.25) 12.86 (7.73)
ep 1950-2008 10.85 7.37 3.26 13.09 (8.77)
dy 1950-2008 14.19 -4.90 5.97 14.49 (7.26)
dp 1950-2008 23.96 18.57 10.37 19.30 (6.57)
dp+gd 1950-2008 11.41 (8.29)
Figure 1 - Stock Market Return Forecasts at the Annual Frequency
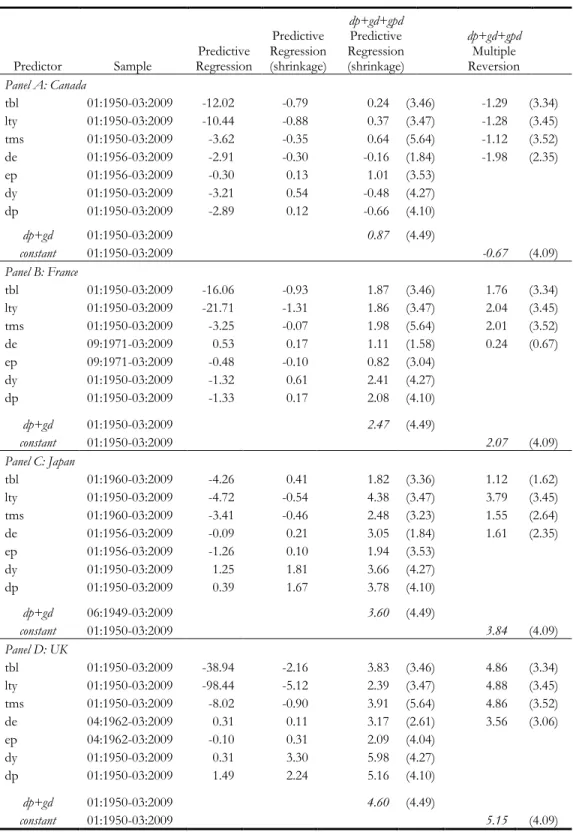
Table 5 - Certainty Equivalent Gains at the Monthly Frequency
This table displays annualized certainty equivalent gains (in percentage) of market-timing strategies at the monthly frequency. To calculate certainty equivalents I assume a risk-aversion coefficient (γ) of 2. Certainty equivalent gains are obtained as the difference between the certainty equivalent measure of a given forecasting model and the certainty equivalent of the unconditional model. The results in the sixth and eighth columns (in brackets) correspond to certainty equivalent gains for the US stock market using the sum-of-the-parts method, and estimating the growth in the price-dividend ratio with predictive regressions with shrinkage and with the multiple reversion approach, respectively.
Predictor Sample
Predictive Regression Predictive Regression (shrinkage) dp+gd+gpd Predictive Regression (shrinkage) dp+gd+gpd Multiple Reversion
Panel A: Canada
tbl 01:1950-03:2009 -12.02 -0.79 0.24 (3.46) -1.29 (3.34) lty 01:1950-03:2009 -10.44 -0.88 0.37 (3.47) -1.28 (3.45) tms 01:1950-03:2009 -3.62 -0.35 0.64 (5.64) -1.12 (3.52) de 01:1956-03:2009 -2.91 -0.30 -0.16 (1.84) -1.98 (2.35)
ep 01:1956-03:2009 -0.30 0.13 1.01 (3.53)
dy 01:1950-03:2009 -3.21 0.54 -0.48 (4.27)
dp 01:1950-03:2009 -2.89 0.12 -0.66 (4.10)
dp+gd 01:1950-03:2009 0.87 (4.49)
constant 01:1950-03:2009 -0.67 (4.09)
Panel B: France
tbl 01:1950-03:2009 -16.06 -0.93 1.87 (3.46) 1.76 (3.34) lty 01:1950-03:2009 -21.71 -1.31 1.86 (3.47) 2.04 (3.45) tms 01:1950-03:2009 -3.25 -0.07 1.98 (5.64) 2.01 (3.52) de 09:1971-03:2009 0.53 0.17 1.11 (1.58) 0.24 (0.67)
ep 09:1971-03:2009 -0.48 -0.10 0.82 (3.04)
dy 01:1950-03:2009 -1.32 0.61 2.41 (4.27)
dp 01:1950-03:2009 -1.33 0.17 2.08 (4.10)
dp+gd 01:1950-03:2009 2.47 (4.49)
constant 01:1950-03:2009 2.07 (4.09)
Panel C: Japan
tbl 01:1960-03:2009 -4.26 0.41 1.82 (3.36) 1.12 (1.62) lty 01:1950-03:2009 -4.72 -0.54 4.38 (3.47) 3.79 (3.45) tms 01:1960-03:2009 -3.41 -0.46 2.48 (3.23) 1.55 (2.64) de 01:1956-03:2009 -0.09 0.21 3.05 (1.84) 1.61 (2.35)
ep 01:1956-03:2009 -1.26 0.10 1.94 (3.53)
dy 01:1950-03:2009 1.25 1.81 3.66 (4.27)
dp 01:1950-03:2009 0.39 1.67 3.78 (4.10)
dp+gd 06:1949-03:2009 3.60 (4.49)
constant 01:1950-03:2009 3.84 (4.09)
Panel D: UK
tbl 01:1950-03:2009 -38.94 -2.16 3.83 (3.46) 4.86 (3.34) lty 01:1950-03:2009 -98.44 -5.12 2.39 (3.47) 4.88 (3.45) tms 01:1950-03:2009 -8.02 -0.90 3.91 (5.64) 4.86 (3.52) de 04:1962-03:2009 0.31 0.11 3.17 (2.61) 3.56 (3.06)
ep 04:1962-03:2009 -0.10 0.31 2.09 (4.04)
dy 01:1950-03:2009 0.31 3.30 5.98 (4.27)
dp 01:1950-03:2009 1.49 2.24 5.16 (4.10)
dp+gd 01:1950-03:2009 4.60 (4.49)