Validity of Maximum Heart Rate Prediction Equations for Children
and Adolescents
Fabiana Andrade Machado
1and Benedito Sérgio Denadai
2Departamento de Educação Física - Universidade Estadual de Maringá (UEM)1 - Maringá, PR; Departamento de Educação Física - Universidade
Estadual Paulista (UNESP)2 - Rio-Claro, SP - Brazil
Abstract
Background: There are no studies in the literature to validate equations that predict maximum heart rate (HRmax) in children and adolescents.
Objective: To analyze the validity of the HRmax predictive equations “220 - age” and “208 - (0.7 x age)” in boys aged 10 to 16 years.
Methods: A progressive maximal exertion test was carried out in 69 apparently healthy boys aged 10 to 16 years. The initial test velocity was 9 km/h, with 1-km/h increments every three minutes. The test was maintained until maximum voluntary exertion was achieved, considering HRmax as the highest heart rate attained during the test. The measured HRmax was compared with the values predicted by the “220 - age” and “208 - (0.7 x age)” equations, using ANOVA for repeated measures.
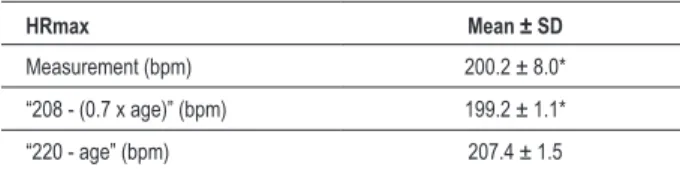
Results: The mean values of HRmax (bpm) were: 200.2 ± 8.0 (measured), 207.4 ± 1.5 (“220 - age”) and 199.2 ± 1.1 (“208 - (0.7 x age)”). The HRmax predicted by the “220 - age” equation was significantly higher (p < 0.001) than the measured HRmax and the HRmax predicted by the (“208 - (0.7 x age)”) equation. The correlation between the measured HRmax and age was not statistically significant (r = 0.096; p > 0.05).
Conclusion: The “220 - age” equation overestimated the measured HRmax and was not valid for this population. The “208 - (0.7 x age)” equation was valid for this population, showing results that were quite similar to those of measured HRmax. Future studies with larger sample sizes can verify whether the HRmax does not depend on age for this population, a situation in which the constant 200 bpm value would be more appropriate for HRmax. (Arq Bras Cardiol 2011; 97(2) : 136-140)
Keywords: Heart rate; child; adolescent; heart/physiology.
Mailing address: Fabiana Andrade Machado •
Av. Colombo, 5790 - Bloco M06 - Depto. Educação Física - Universidade Estadual de Maringá - 87020-900 - Maringá, PR - Brazil
Email: [email protected], [email protected]
Manuscript received October 09, 2010; revise manuscript received April 03, 2011; accepted April 11, 2011.
Introduction
Heart rate (HR) is considered an easily measurable physiological variable, being routinely used to evaluate cardiovascular response during exertion and recovery1,2. Maximum heart rate (HRmax), in turn, is considered one of the criteria to assess maximum exertion in exercise tests3,4 and is broadly used when prescribing exercising intensity4-6. HRmax can be directly determined, usually with progressive maximal exertion protocols or indirectly, with the help of predictive equations that constitute a low-cost and easy-to-apply method of determining it1,7,8.
Among the several equations proposed to predict HRmax, the most widely known is the equation “220 - age”4,9,10, which is curiously of unknown authorship, although it is very often
cited as being the work of Karvonen et al11, although the work carried out by these authors did not involve the creation of this equation7,10,12,13. Another equation worth mentioning is “208 - (0.7 x age)” proposed by Tanaka et al4, which was developed in a meta-analysis study, after collecting data from the literature on 18,712 subjects.
The main characteristic of these and other formulas used to predict HRmax is that all of them consider that the variable decreases with age14. Although this decrease is a general consensus for healthy adult men and women, it might not be true for children and adolescents, and even if it is, this decrease must be measured for this specific population, considering that the decrease rates of most equations was determined for a broad age range that only included children and adolescents in some cases9,15,16.
the validity of the two HRmax prediction equations - “220 - age” and “208 - (0.7 x age)” - in boys aged 10 to 16 years.
Methods
Population
Sixty-nine apparently healthy and active boys aged 10 to 16 years were enrolled in this study. The mean values ± Standard Deviations (SD) of age, height and body mass were: 12.6 ± 1.5 years; 152.7 ± 13.1 cm; 47.3 ± 14.1 kg, respectively; the age median (interquartile interval) was 12.1 years (11.4 - 13.8). Age was calculated centesimally, considering the birth date and the date when the test was performed. None of the participants participated in regular training programs. All procedures used in the study were previously approved by the local Research Ethics Committee. Participation was voluntary, with no bonus or onus for the subjects. Before the tests were performed, the children’s parents or tutors were informed of all the procedures the children would be submitted to and signed the Free and Informed Consent Form regarding test participation.
Maximal effort exercise test
Prior to the exercise test on a treadmill, the participants visited to lab for an ergometer adaptation session and also to have anthropometric measurements (body mass and height) taken. The progressive maximal exertion test was carried out on a multiprogrammable treadmill (Inbrasport Super ATL, Porto Alegre, Brazil).
After a three-minute warm-up at 5 km/h, the test was started at 9 km/h, with 1-km/h increments every three minutes. Constant inclination was maintained at 1% throughout the test. Heart rate (HR) was constantly monitored using a heart rate monitor (Polar Vantage XL). The test was maintained until voluntary exhaustion was attained and the participants were verbally encouraged to keep the test going for as long as possible. Maximum heart rate (HRmax) was defined as the highest HR achieved during the test4, being considered attained (valid) only when signs of intense exertion (hyperpnea, facial flushing, irregular steps) were observed17.
Statistical analysis
Data are presented as means ± standard deviations (SD) for all measured variables. The methods were compared using ANOVA for repeated measures with Bonferroni post hoc test. One-way ANOVA was used to compare the HRmax measured between age ranges. Pearson’s correlation coefficient was used to correlate the measured values with the predicted ones of HRmax, as well as to verify the association between age and measured HRmax.
Bland-Altman analysis18 was used to calculate the limits of concordance between the measured HRmax and the that predicted by age; the level of significance was set at p < 0.05.
Results
Table 1 shows the measured and predicted values of HRmax for boys aged 10 to 16 years. The values
demonstrated by the “220 - age” equation were significantly higher (p < 0.001) than the measured values and those estimated by the “208 - (0.7 x age)”, according to the ANOVA for repeated measures with Bonferroni post-hoc test. The correlation between the measured HRmax and the values predicted by the two equations was not statistically significant (p > 0.05), showing the same coefficient of correlation for both equations (r = -0.096).
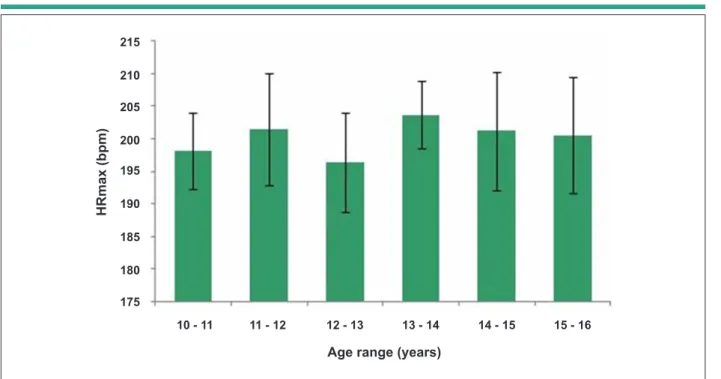
Figure 1 shows the mean values ± SD of HRmax for the different age ranges. One-way ANOVA did not show any significant different (p > 0.05) between the age ranges. The correlation between the measured HRmax values and age was not statistically significant (r = 0.096; p > 0.05). The absence of a tendency toward the increase or decrease of HRmax with age was observed visually. This was corroborated by the correlation between these variables, which was not statistically different from zero. HRmax variability for the several age ranges, represented by the SD in Figure 1, did not show any tendency toward increase or decrease with age, either. Figure 1 also shows the high SD values observed, in which the lowest and the highest values were 5.1 and 9.0 bpm for the age ranges of 13-14 and 14-15 years, respectively.
Figure 2 shows the dispersion charts of measured HRmax values in the sample. It is noteworthy the high dispersion of data corroborated by the high SD shown in Table 1 for measured HRmax. It can also be observed that the values predicted by the “220 - age” equation, represented by the dashed line, show a tendency toward HRmax overestimation. Additionally, the values predicted by the “208 - (0.7 x age)” equation, represented by the dotted line, seem to be better adjusted to the measured HRmax mean.
The analysis of concordance between the measured HRmax and that predicted by the equations showed as bias (difference between the means) ± SD of differences: 7.1 ± 8.3 bpm (“220 - age”) and -1.1 ± 8.2 bpm (“208 - (0.7 x age)”). It is worth mentioning the high bias of 7.1 bpm demonstrated by the difference between the means of values predicted by the “220 - age” equation and the measured HRmax values, which is in agreement with the overestimation of HRmax.
Discussion
The objective of the present study was to analyze the validity of two predictive equations for HRmax, “220 - age” and “208 - (0.7 x age)”, in boys aged 10 to 16 years. The main finding was that the “220-age” equation overestimated HRmax values on average, thus demonstrating that it is not valid for
Table 1 - Values of measured and estimated HRmax for boys aged
10 to 16 years (n = 69)
HRmax Mean ± SD
Measurement (bpm) 200.2 ± 8.0* “208 - (0.7 x age)” (bpm) 199.2 ± 1.1* “220 - age” (bpm) 207.4 ± 1.5
Figure 1 -Mean values ± SD of measured HRmax for the different age ranges (n = 69). There was no signiicant difference (p > 0.05) between the age ranges.
H
R
m
a
x
(b
p
m
)
Age range (years)
10 - 11 11 - 12 12 - 13 13 - 14 14 - 15 15 - 16
215
210
205
200
195
190
185
180
175
Figure 2 -Dispersion chart showing values of measured HRmax of the subjects (n = 69). The dotted line represents the values predicted by the equation “208 - (0.7 x age)”.
H
R
m
a
x
(b
p
m
)
Age (years)
9 10 11 12 13 14
230
220
210
200
190
180
170
15 16 17
Measured HRmax
220 - age
208 - (0,7 x age)
this population, whereas the “208 - (0.7 x age)” equation showed to be valid for this pediatric population. Moreover, we verified that HRmax was independent from age for this specific population, although it is important to emphasize that the studied sample (n = 69) does not allow definitive conclusions to be drawn regarding this absence of association.
range used when it was created. Regarding the “208 - (0.7 x age)” equation, it was generated by the linear regression of 18,712 subjects, especially between ages 20 and 70 years.
Table 1 showed that the mean value obtained with the “220 - age” equation was significantly higher (p < 0.001) than the measured values and those estimated by the “208 - (0,7 x age)” equation. Therefore, the “220 - age” equation overestimates, on average, HRmax values. When applying the “220 - age” equation, one can verify that the predicted HRmax linearly decreases from 210 bpm at 10 years to 204 bpm at 16 years, overestimating the mean value of measured HRmax of 200.2 bpm throughout the age range 10 to 16 years. This can be verified visually in Figure 2. Contrarily to the “220 - age” equation, there was no significant difference (p > 0.05) between the values predicted by the “208 - (0.7 x age)” equation and the measured values. The values predicted by the “208 - (0.7 x age)” equation decrease from 201 bpm at 10 years to 196.8 bpm at 16 years of age, showing values that are above (age < 11.1 years) and below (age ≥ 11.1 years) the mean of 200.2 bpm of the measured HRmax.
Figure 1 showed there was no significant difference (p > 0.05) among the several age ranges for the measured HRmax. This absence of difference was corroborated by the fact that the correlation between the measured HRmax and age was not statistically significant. Therefore, the present study does not allow us to affirm that HRmax decreases with age in the studied population. Although the sample was not small (n = 69), it does not allow us to draw definitive conclusions regarding the absence of association between HRmax and age. Another interesting point demonstrated by the results was the high HRmax variability across the several age ranges, which was represented by the SD. This high SD showed no tendency toward increase or decrease with age, either. Both Figure 1 and Figure 2 show this high SD pattern for HRmax. It is noteworthy the fact that not only the measured HRmax showed a high SD, of around 8 bpm, but the difference between the means (bias) of predicted and measured values also showed an equally high SD.
These values are in accordance with the literature, which reports a standard deviation value of 10 bpm for the predicted HRmax values4,10. When the bias and the SD of the difference between the predicted and measured HRmax values are analyzed, one can observe a broad limit of agreement for 95% of cases between measured values and those predicted by the “220 - age” (-9.5 to 23.7 bpm) and by the “208 - (0.7 x age)” equations (-17.5 to 15.3 bpm), which can result in errors of up to +12% and -9%, respectively, considering the mean HRmax of 202.2 bpm. Therefore, one can conclude that the high variability of HRmax is the main limiting factor for its prediction.
Conclusion
Based on these results, we conclude that the “220 - age” equation is not valid and appropriate for children and adolescents, as it overestimated, on average, the HRmax values for boys at the age range of 10 to 16 years. The “208 - (0.7 x age)” equation, in turn, showed results that were quite close to those of the measured HRmax and can be considered a valid equation for this pediatric age range. Moreover, if the age range is really independent from age for boys at this age range, which can be verified in future studies with larger sample sizes, the constant value of 200 bpm can become the most appropriate value for HRmax in this population.
Potential Conflict of Interest
No potential conflict of interest relevant to this article was reported.
Sources of Funding
There were no external funding sources for this study.
Study Association
This study is not associated with any post-graduation program.
References
1. American College of Sports Medicine. Diretrizes do ACSM para os testes de esforço e sua prescrição. 6ª. ed. Rio de Janeiro: Guanabara Koogan; 2003.
2. Almeida MB. Freqüência cardíaca e exercício: uma interpretação baseada em evidências. Rev Bras Cineantropom Desempenho Hum. 2007;9(2):196-202.
3. Denadai BS, Greco CC. Prescrição do treinamento aeróbio: teoria e prática. Rio de Janeiro: Guanabara Koogan; 2005.
4. Tanaka H, Monahan KG, Seals DS. Age – predicted maximal heart rate revisited. J Am Coll Cardiol. 2001;37(1):153-6.
5. Pollock ML, Graves JE, Swart DL, Lowenthal DT. Exercise training and prescription for the elderly. South Med J. 1994;87(5):S88-95.
6. Denadai BS. Variabilidade da freqüência cardíaca durante o exercício de carga constante realizado abaixo e acima do limiar anaeróbio. Rev Bras Cien Esporte. 1994;16(1):36-41.
7. Fernandes Filho J. A prática da avaliação física, teste, medidas e avaliação em escolares, atletas e academias de ginásticas. 2ª. ed. Rio de Janeiro:
8. Marins JCB, Giannichi RS. Avaliação e prescrição de atividade física – Guia prático. 3ª. ed. Rio de Janeiro: Shape; 2003.
9. Fernhall B, McCubbin JA, Pitetti, KH, Rintala P, Rimmer JH, Millar AL, et al. Prediction of maximal heart rate in individuals with mental retardation. Med Sci Sport Exerc. 2001;33(10):1655-60.
10. Robergs RA, Landwehr R. The surprising history of the ”HRmax=220-age” equation. JEPonline. 2002;5(2):1-10.
11. Karvonen MJ, Kentala E, Mustala O. The effects of training on heart rate: a longitudinal study. Ann Med Exper Fenn. 1957;35(3):307-15.
12. Barbosa FP, Oliveira HB, Fernandes PR, Fernandes Filho J. Estudo comparativo de equações de estimativa da frequência cardíaca máxima. Fit & Perform J. 2004;3(2):108-14.
13. Policarpo FB, Fernandes Filho J. Usar ou não a equação de estimativa (220 – idade)?. Rev Bras Cien Mov. 2004;12(3):77-9.
15. Froelicher VF, Myers JN. Exercise and the heart. 4th ed. Philadelphia: W B Saunders; 2000.
16. Lester M, Sheffield LT, Trammel P, Reeves TJ. The effect of age and athletic training on the maximal heart rate during muscular exercise. Am Heart J. 1968;76(3):370-6.
17. Armstrong N, Welsman JR. Assessment and interpretation of aerobic fitness in children and adolescents. Exerc Sport Sci Rev. 1994;22:435-76.
18. Bland JM, Altman DG. Statistical methods for assessing agreement between two methods of clinical measurement. Lancet. 1986;1(8476):307-10.