Comparison between 2D and 3D Echocardiography in the Evaluation
of Reverse Remodeling after CRT
Viviane Tiemi Hotta
1,2, Martino Martinelli Filho
1, Charles Mady
1, Wilson Mathias Jr
1, Marcelo Luiz Campos Vieira
1,3Instituto do Coração (InCor) da Faculdade de Medicina da Universidade de São Paulo1, Fleury Medicina e Saúde2, Hospital Israelita Albert Einstein3, São Paulo, SP - Brazil
Abstract
Background: Echocardiography is a useful method for screening and assessing response to cardiac resynchronization therapy (CRT). 3D echocardiography has already established its role in the evaluation of ventricular volumes and ejection fraction (LVEF) with excellent correlation of results when compared with magnetic resonance imaging (MRI).
Objective: To compare the evaluation of ventricular volumes (LVDV, LVSV), LVEF, and LV mass before and after CRT by 2D echocardiography and three-dimensional echocardiography.
Methods: We evaluated 24 patients with heart failure (HF), functional class (FC) III or IV (NYHA), sinus rhythm QRS ≥ 120
ms, during an optimized therapy for HF undergoing CRT. We conducted electrocardiogram (ECG), clinical evaluation, 2D and 3D echocardiography before, three and six months after CRT. The comparison between the techniques was performed using Pearson’s correlation (r).
Results: At baseline, the correlation between methods was 0.96 for evaluation of LVDV, 0.95 for evaluation of LVSV, 0.87 for LVEF and 0.72 for LV mass. After three months of CRT, the correlation between methods for analysis of LVDV was 0.96, 0.95 for LVSV, 0.95 for LVEF, and 0.77 for LV mass. After six months of CRT, the correlation between 2D and 3D echocardiography for analysis of LVDV was 0.98, 0.91 for LVSV, 0.96 for LVEF, and 0.85 for LV mass.
Conclusion: This study reported was a reduction of LVDV, LVSV, besides improvement in LVEF after CRT. There was an excellent correlation between the 2D and 3D echocardiography for evaluation of ventricular volumes and LVEF, and a good correlation between methods for evaluation of left ventricular mass before and after CRT. (Arq Bras Cardiol
2011; 97(2) : 111-121)
Keywords: Echocardiography; echocardiography, three-dimensional; stroke volume; ventricular dysfunction, left.
Mailing address: Viviane Tiemi Hotta •
Av. Dr. Enéas de Carvalho Aguiar, 44 - Cerqueira César - 05403-000 - São Paulo, SP - Brazil
E-mail: [email protected], [email protected]
Manuscript received September 22, 2010; revised manuscript received November 08, 2010; accepted on January 28, 2011.
Introduction
Echocardiography is a useful method for screening and evaluating response to cardiac resynchronization therapy (CRT) for patients with heart failure (HF) and severe ventricular conduction disturbance1-4. Three-dimensional
echocardiography (3D echocardiography) already has its established role in the evaluation of ventricular volumes and left ventricular ejection fraction (LVEF) with excellent correlation of results compared to cardiac magnetic resonance5,6.
Regarding the two-dimensional echocardiography (2D echocardiography), 3D echocardiography is closer to the real anatomy because of the absence of geometric inferences.
Once the 2D echocardiography has increased availability and has been the most widely used method for monitoring these patients, this study demonstrated its correlation with 3D echocardiography in the evaluation of ventricular volumes
(left ventricular diastolic volume and left ventricular end-systolic volume), ejection fraction and left ventricular mass before and after CRT.
Methods
We conducted a prospective observational study from January 1, 2007 to June 1, 2009. The project was approved by the Scientific and Ethics Committee of InCor - HCFMUSP, by the Ethics Committee for Analysis of Research Projects (CAPPesq) of the Clinical Board of Hospital das Clínicas da Universidade de São Paulo. This study presents partial results of a doctoral thesis conducted in the period described based on a convenience sample.
We studied patients diagnosed with cardiomyopathy of nonischemic etiology who fulfilled the following criteria:
1. Aged 18 to 75 years;
2. Optimized drug therapy at maximum dose tolerated by the patient for at least one month before being included in the study;
3. Sinus rhythm;
5. LVEF < 0.35 (measured by two-dimensional echocardiography by the Simpson’s method); 6. Left ventricular end-diastolic diameter (LVEDD) >
55 mm;
7. Presence of signs and symptoms of HF class III or IV (NYHA).
Patients older than 40 years with risk factors for coronary artery disease underwent coronary angiography to exclude ischemic etiology.
Exclusion criteria were: 1) improper echocardiographic image for three-dimensional analysis; block of three-dimensional examination was considered improper for analysis when two or more segments were not viewed; 2) presence of cardiac translational artifacts; 3) atrial fibrillation or large irregular heart rhythm pre-CRT; 4) patients unable to remain in short period of apnea (15-20 seconds) for three-dimensional echocardiographic image acquisition; 5) death before completion of at least the first reassessment (at three months after CRT ).
Patients who met the inclusion criteria were referred to the implantation of a biventricular pacemaker (BvPa). Before hospital discharge, patients underwent echocardiographic evaluation, to program optimal Atrioventricular Interval (AVI) through the Ritter’s formula7,8.
After discharge, the electronic programming of BvPa was reassessed on the tenth day after the pacemaker implantation and after one and three months after implantation, according to the routine of InCor’s Clinical Unit of Arrhythmia and Cardiac Pacing. The purpose of these evaluations was to ensure the proper operation of BvPa in each patient.
ECG, clinical evaluation, two-dimensional (2D) and
three-dimensional (3D) echocardiography were performed before, three and six months after CRT. We evaluated the following parameters: left ventricular volumes (diastolic - LVDV, and systolic - LVSV), left ventricular ejection fraction (LVEF) and left ventricular mass.
We evaluated the volumetric blocks of eight patients included in the protocol for the analysis of intra and interobserver variation. We evaluated the following variables: left ventricular diastolic and systolic volume, left ventricular ejection fraction, obtained by three-dimensional analysis. For the intraobserver analysis, two analyses of the same volumetric block were performed by the same observer with an interval of one month between readings.
Clinical analysis
All patients underwent a clinical evaluation consisting of history taking, physical examination, 12-lead electrocardiogram, and classification of functional class according to the NYHA (New York Heart Association), in addition to evaluating the quality of life using the Minessota Living with Heart Failure Questionnaire (MLHFQ).
The functional class by NYHA classification stratifies the degree of limitation imposed by the HF in the patient’s daily activities. This classification has a functional nature and is also a way to evaluate the quality of life with HF2. The MLHFQ
consists of 21 questions that assess how the patient perceives the effects of the disease and treatment in their daily lives.
The questions focus on symptoms such as dispnea, fatigue, edema, and the psychological status and impact of the disease on the daily and labor routine9.
Echocardiography
Echocardiographic studies were performed using the equipment iE33 Philips Medical Systems, Andover, MA, USA. Two-dimensional echocardiography, cardiac flow analysis by Doppler and real time three-dimensional evaluation were performed. The images were acquired on longitudinal paraesternal planes of 2, 3 and 4 left, lateral and apical chambers as standardized by the American Society of Echocardiography10.
Two-dimensional analysis
T h e f o l l o w i n g p a r a m e t e r s w e r e e v a l u a t e d i n echocardiographic studies: 1) left ventricular diastolic diameter and left ventricular systolic diameter in left-chamber longitudinal parasternal view; 2) left ventricular end-diastolic volume (VDVE) (Simpson’s method); 3) left ventricular end-systolic volume (LVSV) (Simpson’s method); 4) LVEF (Simpson’s method); 5) evaluation of mitral flow for analysis of ventricular diastole with pulsed Doppler study.
Three-dimensional analysis
Patients were positioned in the left lateral position and an X3 matrix array transducer was used, compatible with the equipment iE33, Philips Medical Systems. Real time three-dimensional images were acquired in expiratory apnea (15 to 20 seconds) with observation of cardiac cycle from electrocardiographic recording. For the evaluation of ventricular volumes and LVEF, gain and compression adjustments were performed to allow imaging of good technical quality and clear identification of endocardial borders.
Volumetric block (full volume) was made from the acquisition of four small subvolumes in consecutive cardiac cycles combined to provide a pyramidal block of greater volume (110o x 100o). In each acquisition, adjustments were
made so that the entire left ventricular volume was contained in the block evaluated.
LVDV, LVSV and LVEF were assessed later on a workstation equipped with a specific program (Q-Lab, versions 5.0. And 6.0., Philips Medical System, Andover, MA, USA) by a semiautomatic algorithm for identification of endocardial borders. This program provides, for every frame acquired, the view of four-chamber, two-chamber and cross-sectional apical planes. For the volumetric reconstruction of LV, five reference points are identified. From these reference points, endocardial borders are identified for the automatic calculation of LVDV, LVSV and LVEF. In cases where automatic detection showed suboptimal quality (lack of identification of endocardial borders) the images were edited.
Statistical analysis
The comparison between the parameters measured by two-dimensional and three-dimensional echocardiography was performed using linear regression and Pearson correlation (r) tests. We performed the analysis of intraobserver and interobserver variation between measurements of left ventricular diastolic and systolic volumes, left ventricular ejection fraction, by calculating the concordance correlation coefficient.
We used Excel (2007) for the organization and tabulation of results, and a computer program for statistical analysis (SPSS version 13.0, Chicago, IL, USA).
Results
We evaluated 63 patients who met the inclusion criteria from January 1, 2007 to June 1, 2009. This paper presents some results from a doctoral thesis (June 1, 2006 to June 18, 2010), and patients were selected during the data collection period for the thesis. Out of 63 patients evaluated in the period, only 35 were referred to CRT. Out of these, eight patients died before the first reevaluation and were excluded from the analysis, since the purpose of the study was the evaluation of reverse remodeling.
Out of the eight deaths that occurred before the first reassessment at three months: one patient needed a heart transplant, dying after transplantation for infectious complications; one patient had a cardiac arrest (PEA - Pulseless Electrical Activity) in the operating room, being successfully resuscitated and transferred to the ICU after the procedure, but died of cardiogenic shock; one patient died of septic shock secondary to infection of pacemaker pocket; five patients died from refractory congestive heart failure.The decision to refer the patient to CRT was taken jointly by InCor’s pacemaker and congestive heart failure teams.
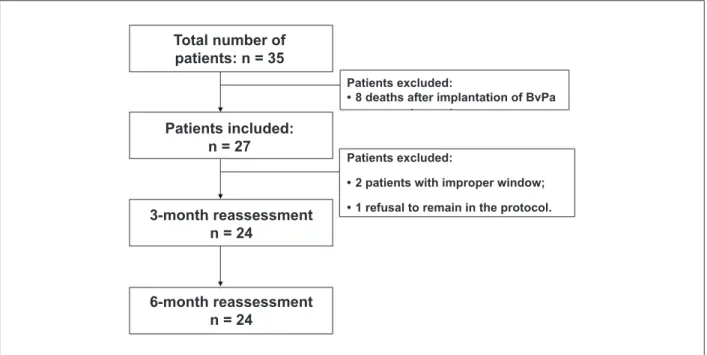
Thus, during the study period, we evaluated 35 patients who underwent implantation of BvPa. There were eight deaths before the three-month revaluation. Out of the 27 remaining patients, two were excluded for inadequate echocardiographic image, and one patient refused to perform examinations of monitoring after the CRT. Then, 24 patients underwent re-evaluation before, three and six months after CRT (figure 1). All patients agreed to participate in the study and signed a consent form.
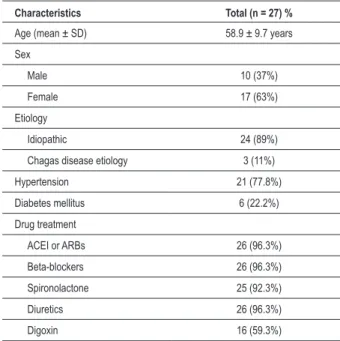
The average age of the 27 patients analyzed was 58.9 ± 9.7 years, of which 10/27 (37%) were male and 17/27 (63%) were female. The etiology of cardiomyopathy was idiopathic in most patients (24/27 patients; 89%), and Chagas disease in 3/27 patients (11%). Most patients (21/27 patients; 77.8%) were hypertensive, while 6/27 patients (22.2%) had a history of diabetes mellitus (Table 1).
In relation to drug treatment, 26/27 patients (96.3%) were using angiotensin-converting enzyme inhibitors (ACEI) or angiotensin II receptor blockers (ARBs); 26/27 patients (96.3% ) were using beta-blockers and diuretics; 25/27 patients (92.3%) were on spironolactone; and 16/27 patients (59.3%) were using digoxin. The treatment was maintained unchanged throughout the follow-up period (Table 1).
With respect to clinical progression after three months of CRT, there was improvement in FC (NYHA), p < 0.001 of at least one grade in 18/24 (75%) of patients and maintenance of FC in 6/24 (25%) of patients. At six months after CRT, 19/24 (79%) showed improvement in FC (NYHA) and 5/24 (21%) showed no change in FC, p < 0.001 (Fig. 2A). Improved quality of life was measured by the Minnesota score (MLHFQ) three months after CRT in 21/24 (88%) of patients, worsening in 1/24 (4%), and 2/24 (8%) of patients with no changes (p < 0.001). At six months after CRT, 20/24 (83%) of patients
Figure 1 -Flowchart.
Total number of
patients: n = 35
Patients included:
n = 27
3-month reassessment
n = 24
6-month reassessment
n = 24
Patients excluded:
• 8 deaths after implantation of BvPa
Patients excluded:
• 2 patients with improper window;
Table 1 - Clinical characteristics of the sample (total)
Characteristics Total (n = 27) %
Age (mean ± SD) 58.9 ± 9.7 years
Sex
Male 10 (37%)
Female 17 (63%)
Etiology
Idiopathic 24 (89%)
Chagas disease etiology 3 (11%)
Hypertension 21 (77.8%)
Diabetes mellitus 6 (22.2%)
Drug treatment
ACEI or ARBs 26 (96.3%)
Beta-blockers 26 (96.3%)
Spironolactone 25 (92.3%)
Diuretics 26 (96.3%)
Digoxin 16 (59.3%)
ACEI - angiotensin-converting enzyme inhibitors; ARBs - angiotensin II receptor blockers.
improved in MLHFQ, 3/24 (13%) had worsened and 1/24 (4%) patient presented no change, p < 0.001 (Fig. 2B).
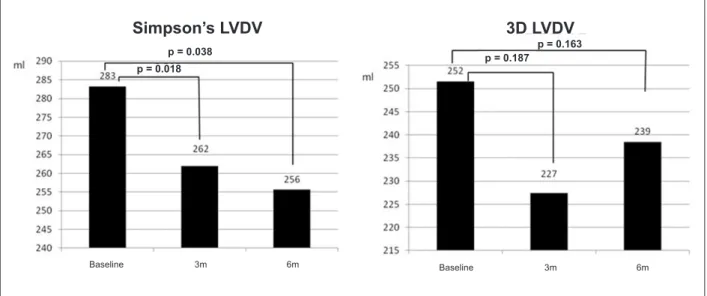
The analysis of ventricular volumes by the two-dimensional mode, using the Simpson’s method (LVDV: 283 ± 117 ml; LVSV: 219 ± 93 ml at baseline) revealed decreased left ventricular diastolic and systolic volumes (LVDV: 262 ± 124 ml, p = 0.018; LVSV: 196 ± 105 ml, p = 0.007) after three months of CRT. This reduction was maintained in the evaluation after six months of CRT (LVDV: 256 ± 137 ml, p = 0.038; LVSV: 185 ± 114 ml, p = 0.027) (Table 2, Fig. 3 and 4).
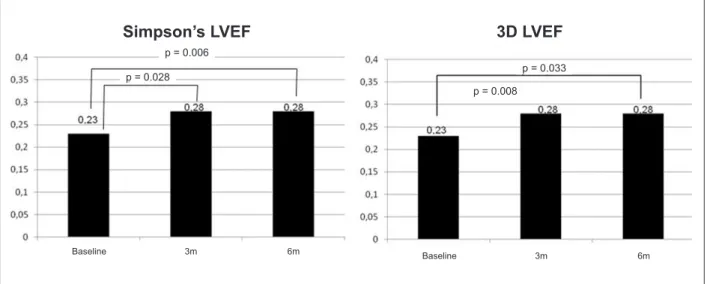
The left ventricular ejection fraction (0.23 ± 0.05), evaluated by Simpson’s method, also showed improvement at three months (0.28 ± 0.07, p = 0.028) after CRT, which remained stable at six months (0.28 ± 0.10, p = 0.006), after CRT (Table 2) (Fig. 5).
The analysis by 3D echocardiography showed medians and standard deviations of ventricular systolic and diastolic volumes of 252 ± 105 ml and 194 ± 86 ml, respectively, at baseline. After the CRT, there was no significant reduction in ventricular volumes, evaluated at 3D echocardiography. Three months after CRT, there was a reduction of 25 ml (10%) in average values of LVDV and 26 ml (13%) in average values of LVSV in relation to the baseline (LVDV: 227 ± 113 ml, p = 0.187; LVSV: 168 ± 95 ml, p = 0.065). At six months after CRT, the reduction of LVDV was 13 ml (5%) and 6 ml (6%) of the LVSV in relation to the baseline (LVDV: 239 + 129 ml, p = 0.163; LVSV: 183 + 115 ml, p = 0.347) (Table 2, Fig. 2 and 3). With respect to LVEF, there was an improvement (21.7%) compared to baseline values (LVEF: 0.23 ± 0.05), as shown at month three after CRT (LVEF: 0.28 ± 0.07, p = 0.008) and was maintained at month six (LVEF: 0.28 ± 0.10, p = 0.033) (Table 2, Fig. 5).
There was no change in left ventricular mass at month three (p = 0.511 by 3D echocardiography) and month six (p = 0.706 for 2D echocardiography, p = 0.479 on 3D echocardiography), after CRT (Table 2).
At baseline, the correlation between methods was 0.96 for evaluation of LVDV, 0.95 for evaluation of LVSV, 0.87 for LVEF and 0.72 for LV mass. After six months of CRT, the correlation between 2D and 3D echocardiography for analysis of LVDV was 0.96, 0.95 for LVSV, 0.95 for LVEF and 0.77 for LV mass. After six months of CRT, the correlation between 2D and 3D echocardiography for analysis of LVDV was 0.98, 0.91 for LVSV, 0.96 for LVEF and 0.85 for LV mass (Figures 6 and 7).
Regarding the evaluation of intra and interobserver variation on 3D echocardiography, the concordance correlation coefficient (CCC) of analysis of intraobserver LFDV was 0.95 (95% confidence interval: 0.80 to 0.99) and interobserver was 0.95 (95% confidence interval: 0.77 to 0.99). The CCC of intraobserver analysis of LVSV was 0.97 (95% confidence interval: 0.86 to 0.99) and interobserver was 0.95 (95% confidence interval: 0.81 to 0.99). The CCC of intraobserver LVEF analysis was 0.97 (95% confidence interval: 0.86 to 0.99) and interobserver was 0.92 (95% confidence interval: 0.71 to 0.98).
Discussion
In patients with advanced HF, left ventricular dilation is considered an important independent predictor of worse prognosis11. Patients with idiopathic dilated
cardiomyopathy and significant ventricular dilation have reduction of coronary flow reserve detected in myocardial perfusion imaging with nuclear medicine techniques and pharmacological stress echocardiography with dipiridamole12-14. These findings are associated with higher
systolic stress and left ventricular wall in areas of abnormal oxygen consumption, suggesting the presence of ischemia and a worse prognosis in these patients.
Therefore, patients with severe heart failure and significant ventricular dilation, as evidenced by increased LVDD and ventricular volumes, may have a poorer response to CRT because of lower coronary flow reserve and the presence of areas with abnormal pattern of oxygen consumption. The evaluation of the degree of ventricular dilation analyzed by 2D and 3D echocardiography at baseline provides important information about the evolution of patients after CRT. Thus, we know the importance of evaluating LVSV and LVDV before CRT.
In a study by Anthony et al15, patients in the earliest stages
of cardiomyopathy and minor alterations in ventricular geometry were more likely to respond to CRT.Additionally, the evaluation of volumetric changes after CRT provides important predictive information about the clinical outcomes in the natural evolution of the disease, as demonstrated originally by Yu et al16 and confirmed in a recent study by Ypenburg
et al17. Data regarding the use of pharmacological therapies
with prognosis in the long term: the greater the rate of reverse remodeling, better the clinical evolution and vice versa.
The value of three-dimensional echocardiography in the evaluation of ventricular volumes, ejection fraction and left ventricular mass has been proven in a number of studies with an excellent correlation of results compared to cardiac magnetic resonance imaging5,6. The acquisition of
volumetric blocks, through 3D echocardiography, to evaluate these parameters, can be performed quickly, using an array transducer, and the quantification of data by a trained and experienced operator takes on average six to eight minutes18,19.
Hence, 3D echocardiography is a very useful tool in echocardiography, increasing the accuracy of calculations of
volumes, LVEF and left ventricular mass, without increasing significantly the duration of the test. However, currently, 3D echocardiography is not yet widely available; it requires specific equipment and computer programs for the quantification of data, and requires adequate training for the acquisition of volumetric blocks of good technical quality.
Two-dimensional echocardiography, in turn, is widely available and has been the most widely used method for evaluation of patients about to undergo CRT and to evaluate the response after this therapy.
This study compared the evaluation of data about the morphology and left ventricular function by 2D and 3D echocardiography, before CRT, which helps selecting
Figure 2 -A) Evolution of FC (NYHA) over baseline (pre-CRT), three and six months after implantation of BvPa. After CRT, there was improvement of CF in most patients. At baseline, most patients were in FC III or IV. At three months of CRT, most patients are in FC I and II (NYHA). The improvement was maintained at six months of
reassessment. B) The mean scores of quality of life assessed by MLHFQ at baseline, three and six months after CRT are represented. There was signiicant improvement
in quality of life from month three (p < 0.001), which is maintained at the sixth month of re-evaluation (p < 0.001). 6 months
FC (NYHA)
Quality of Life
(Minnesota’s Questionnaire)
Score
Pre MLHFQ MLHQ3M MLHFQ 6M
Baseline 3 months
p < 0.001
p < 0.001 p < 0.001
p < 0.001
FC I
FC II
FC III
Table 2 - Evolution of total sample
Parameter Baseline (pre CRT) (n = 27) 3 months (after CRT) (n = 21) p 6 months (after CRT) (n = 24) p
Minnesota score 60 ± 21 33 ± 21 <0.001 33 ± 24 <0.001
Functional class
I 0 (0%) 4 (19%)
<0.001
9 (37%)
<0.001
II 0 (0%) 12 (57%) 10 (42%)
III 26 (96%) 5 (24%) 5 (21%)
IV 1 (4%) 0 (0%) 0 (0%)
ECG
HR (bpm) 72 ± 13 70 ± 8 NS 68 ± 8 NS
PR interval (ms) 204 ± 36 164 ±37 <0.001 155 ± 20 <0.001
QRS duration (ms) 164 ± 23 153 ± 33 0.075 146 ± 28 0.003
BRE 96.3% (1)
LVDD (2D) (mm) 74 ± 9 72 ± 12 NS 72 ± 13 NS
LVSD (2D) (mm) 67 ± 7 64 ± 13 NS 65 ± 13 NS
LVDV (2D) (ml) 283 ± 117 262 ± 124 0.018 256 ± 137 0.038
LVSV (2D) (ml) 219 ± 93 196 ± 105 0.007 185 ± 114 0.027
LVEF (2D) 0.23 ± 0.05 0.27 ± 0.08 0.028 0.28 ± 0.10 0.006
LVDV (3D) (ml) 252 ± 105 227 ± 113 0.187 239 ± 129 0.163
LVSV (3D) (ml) 194 ± 86 168 ± 95 0.065 183 ± 115 0.347
LVEF (3D) 0.23 ± 0.05 0.28 ± 0.07 0.008 0.28 ± 0.10 0.033
Mass (2D) (g) 188 ± 51 173 ± 51 0.024 177 ± 48 0.706
Mass (3D) (g) 252 ± 66 263 ± 110 0.511 263 ± 108 0.479
ECG - Eletrocardiogram; LVDD - Left ventricle diastolic diameter; LVSD - Left ventricle systolic diameter; LVDV - Left ventricular diastolic volume; LVSV - Left ventricular systolic volume; LVEF - Left ventricular ejection fraction.
Figure 3 -Evaluation of LVDV at baseline, three and six months after CRT by the Simpson’s method (left) and 3D echocardiography (right).
Simpson’s LVDV
3D LVDV
p = 0.038
p = 0.018
p = 0.187
p = 0.163
Baseline 3m 6m Baseline 3m 6m
candidates to CRT, three and six months after CRT, in order to assess response to treatment.
The evaluation of ventricular volumes after CRT is important to recognize left ventricular reverse remodeling, defined as reduction of left ventricular diastolic and systolic volumes and
Figure 4 -Evaluation of LVSV at baseline, three and six months after CRT by the Simpson’s method (left) and 3D echocardiography (right).
Simpson’s LVSV
3D LVSV
p = 0.027
p = 0.007
Baseline 3m 6m Baseline 3m 6m
p = 0.347
p = 0.065
Figure 5 -Evaluation of LVEF at baseline, three and six months after CRT by the Simpson’s method (left) and 3D echocardiography (right).
Simpson’s LVEF
3D LVEF
p = 0.006
p = 0.028
Baseline 3m 6m
Baseline 3m 6m
p = 0.033
p = 0.008
(NYHA) and quality of life16,20. Once proven the superiority
of 3D echocardiography, compared to 2D echocardiography, in the assessment of ventricular volumes, mass and LVEF, it is essential to assess the correlation between these two techniques, as the 2D echocardiography is the most widely used method in patients undergoing CRT.
Ventricular volumes (LVDV and LVSV) assessed both by Simpson’s method and by 3D echocardiography provide additional information on patient selection and response rate to CRT. The improvement and the degree of improvement in LVEF after CRT present good correlation with the improvement in clinical outcome of patients undergoing CRT. According to Di Biase et al21, an increase of six points or more in LVEF at
three months after CRT presents a rate around 66% of event-free within five years of follow up.
In this study, a significant improvement of LVEF measured by both methods (Simpson and 3D echocardiography) three
months after CRT, which remained stable at six months of CRT in the total study sample. There was also an excellent correlation between methods for measuring left ventricular volume throughout the study, which demonstrates the usefulness of echocardiography in the monitoring and evaluation of reverse remodeling of patients undergoing CRT, while 3D echocardiography is not part of the echocardiography evaluation in daily clinical practice.
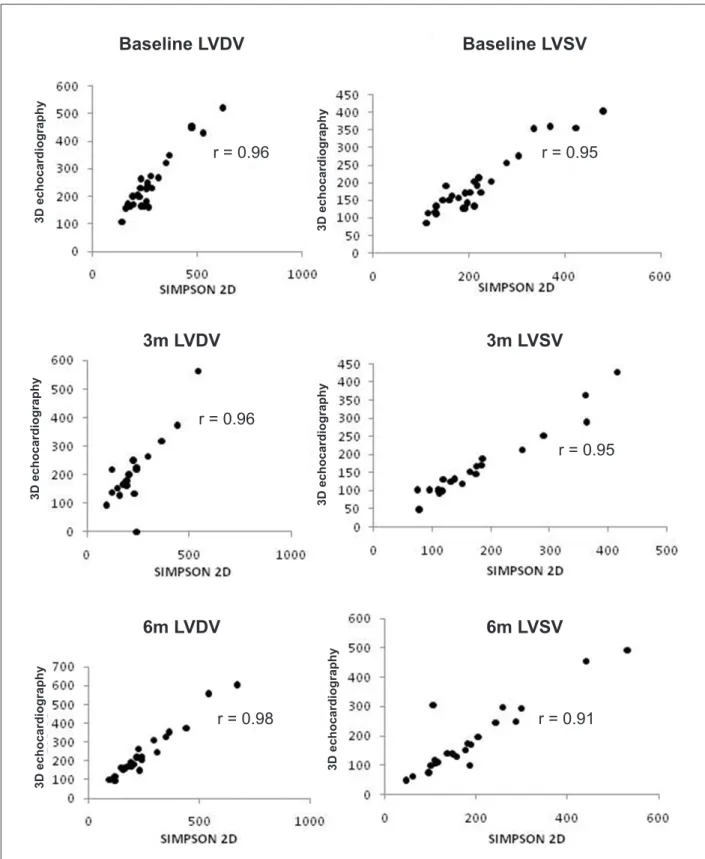
Figure 6 -The comparison between the Simpson’s methods (2D echocardiography) and 3D echocardiography for the assessment of ventricular volumes is shown below. There was good correlation between the two methods for assessment of LVDV and LVDV at baseline, three and six months after CRT.
Baseline LVDV
Baseline LVSV
r = 0.96
3m LVDV
3m LVSV
6m LVDV
6m LVSV
r = 0.95
r = 0.96
r = 0.95
r = 0.98
r = 0.91
3
D
e
c
h
o
c
a
rd
io
g
ra
p
h
y
3
D
e
c
h
o
c
a
rd
io
g
ra
p
h
y
3
D
e
c
h
o
c
a
rd
io
g
ra
p
h
y
3
D
e
c
h
o
c
a
rd
io
g
ra
p
h
y
3
D
e
c
h
o
c
a
rd
io
g
ra
p
h
y
3
D
e
c
h
o
c
a
rd
io
g
ra
p
h
2D echocardiography is the most widely used method in clinical practice due to its availability and cost. Hence, the results of this study, demonstrating the excellent correlation
between methods (2D and 3D echocardiography), makes 2D echocardiography a reliable method for evaluating reverse remodeling after CRT.
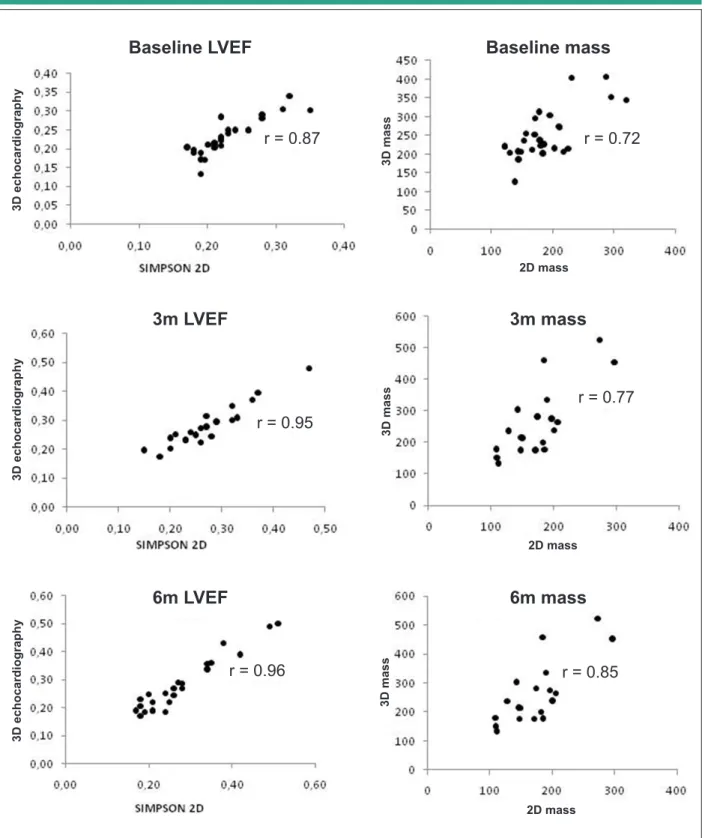
Figure 7 -Correlations between the LVEF measured by 2D echocardiography and 3D echocardiography. There was an excellent correlation (r) between the two methods at all evaluation times (left). There was also a good correlation between LV mass evaluated at the evaluation times (baseline, three and six months after CRT) (right).
Baseline LVEF
Baseline mass
3m LVEF
3m mass
6m LVEF
6m mass
3
D
e
c
h
o
c
a
rd
io
g
ra
p
h
y
3
D
e
c
h
o
c
a
rd
io
g
ra
p
h
y
3
D
e
c
h
o
c
a
rd
io
g
ra
p
h
y
r = 0.87
r = 0.72
r = 0.95
r = 0.77
r = 0.96
r = 0.85
3
D
m
a
s
s
3
D
m
a
s
s
3
D
m
a
s
s
2D mass
2D mass
References
1. Jessup M, Abraham WT, Casey DE, Feldman AM, Francis GS, Ganiats TG, et al. 2009 focused update: ACCF/AHA Guidelines for the Diagnosis and Management of Heart Failure in Adults: a report of the American College of Cardiology Foundation/American Heart Association Task Force on Practice Guidelines: developed in collaboration with the International Society. Circulation. 2009;119(14):1977-2016.
2. Bocchi EA, Marcondes-Braga FG, Ayub-Ferreira SM, Rohde LE, Oliveira WA, Almeida DR, et al; Sociedade Brasileira de Cardiologia. III Diretriz brasileira de insuficiência cardíaca crônica. Arq Bras Cardiol. 2009;93(1 supl.1):1-71.
3. Bradley DJ, Bradley EA, Baughman KL, Berger RD, Calkins H, Goodman SN, et al. Cardiac resynchronization and death from progressive heart failure: a meta-analysis of randomized controlled trials. JAMA. 2003;289(6):730-40.
4. Cleland JGF, Daubert JC, Erdmann E, Freemantle N, Gras D, Kappenberger L, et al. Cardiac Resynchronization-Heart Failure (CARE-HF) Study Investigators. The effect of cardiac resynchronization on morbidity and mortality in heart failure. N Engl J Med. 2005;352(15):1539-49.
5. Mannaerts HF, Van Der Heide JA, Kamp O, Papavassiliu T, Marcus JT, Beek A, et al. Quantification of left ventricular volumes and ejection fraction using freehand transthoracic three-dimensional echocardiography: comparison with magnetic resonance imaging. J Am Soc Echocardiogr. 2003;16(2):101-9.
6. Hotta VT, Cruz CBBV, Rassi DC, Vieira MLC, Mathias Jr W, Avila LFR, et al. Subvalvular mitral pseudoaneurysm evaluated by three-dimensional echo. Echocardiography. 2010;27(4):473-5.
7. Ritter P, Padeletti L, Gillio-Meina L, Gaggini G. Determination of the optimal atrioventricular delay in DDD pacing: comparison between echo and peak endocardial acceleration measurements. Europace. 1999;1(2):126-30.
8. Ritter P, Dib JC, Lelievre T. Quick determination of the optimal AV delay at rest in patients paced in DDD mode for complete AV block. Eur J Cardiac Pacing Electrophysiol.1994;4:A163.
9. Carvalho VO, Guimarães GV, Carrara D, Bacal F, Bocchi EA. Validação da versão em português do Minnesota Living with Heart Failure Questionnaire. Arq Bras Cardiol. 2009;93(1):39-44.
10. Cerqueira MD, Weissman NJ, Dilsizian V, Jacobs AK, Kaul S, Laskey WK, et al. Standardized myocardial segmentation and nomenclature for tomographic imaging of the heart: a statement for healthcare professionals from the Cardiac Imaging Committee of the Council on Clinical Cardiology of the American Heart Association. Circulation. 2002;105(4):539-42.
11. Lee TH, Hamilton MA, Stevenson LW, Moriguchi JD, Fonarow GC, Child JS, et al. Impact of left ventricular cavity size on survival in advanced heart failure. Am J Cardiol. 1993;72(9):672-6.
12. Neglia D, Michelassi C, Trivieri MG, Sambuceti G, Giorgetti A, Pratali L, et al. Prognostic role of myocardial blood flow impairment in idiopathic left ventricular dysfunction. Circulation. 2002;105(2):186-93.
13. Morales MA, Neglia D, L’Abbate A. Reduction of myocardial blood flow reserve in idiopathic dilated cardiomyopathy without overt heart failure and its relation with functional indices: an echo-Doppler and positron emission tomography study. J Cardiovasc Med (Hagerstown). 2008;9(8):778-82.
14. van den Heuvel AF, van Veldhuisen DJ, van der Wall EE, Blanksma PK, Siebelink HM, Vaalburg WM, et al. Regional myocardial blood flow reserve impairment and metabolic changes suggesting myocardial ischemia in patients with idiopathic dilated cardiomyopathy. J Am Coll Cardiol. 2000;35(1):19-28.
15. António N, Teixeira R, Coelho L, Lourenço C, Monteiro P, Ventura M, et al. Identification of ‘super-responders’ to cardiac resynchronization therapy: the importance of symptom duration and left ventricular geometry. Europace. 2009;11(3):343-9.
16. Yu CM, Bleeker GB, Fung JW, Schalij MJ, Zhang Q, van der Wall EE, et al. Left ventricular reverse remodeling but not clinical improvement predicts
Study limitations
There was a slight increase in ventricular volume between three and six months after CRT, as detected by 3D echocardiography. We believe that this finding is still due to the limitations inherent in current technology of 3D echocardiography equipment. Patients included in this study had very high values of LVDD and significant dilation of ventricular volumes, making it difficult to include the entire left ventricle in the acquisition of three-dimensional block. Despite being excluded from the blocks with impossibility of evaluating two or more myocardial segments, the difficulty in assessing the sidewall on the coronal plane and inferior and anterior walls on the sagittal plane may have limited the calculation of left ventricular volumes on 3D echocardiography. Furthermore, limitations in the degree of opening of the ultrasonic beam and the low frame rate (20 to 30 volumes/second) of 3D echocardiography may have resulted in no significant difference between left ventricular
volumes of GI and GII before the CRT.
3D echocardiography, though available for about four decades, has not yet reached its final format and presents physical limitations and limitations in its format for presentation in various acquisition, reading and interpretation programs. The development of 3D echocardiography will undoubtedly enable working, in the near future, with patients with large ventricular dilatation with a marked variation in heart rhythm (atrial fibrillation) and respiratory rate.
Another limitation is the non-use of cardiac MRI in the assessment of ventricular volumes and LVEF for comparison with 2D and 3D echocardiography, since this is the standard method of reference for this purpose.
Conclusion
In this study, we observed a reduction of left ventricular diastolic and systolic volumes in addition to improvement in LVEF after CRT. There was an excellent correlation between the 2D and 3D echocardiography for evaluation of ventricular volumes and LVEF, and a good correlation between methods for evaluation of left ventricular mass before and after CRT.
Potential Conflict of Interest
No potential conflict of interest relevant to this article was reported.
Sources of Funding
This study was partially funded by SOCESP from July 2009 to July 2010
Study Association
long-term survival after cardiac resynchronization therapy. Circulation. 2005;112(11):1580-6.
17. Ypenburg C, van Bommel RJ, Borleffs CJ, Bleeker GB, Boersma E, Schalij MJ, et al. Long-term prognosis after cardiac resynchronization therapy is related to the extent of left ventricular reverse remodeling at midterm follow-up. J Am Coll Cardiol. 2009;53(6):483-90.
18. Kapetanakis S, Kearney MT, Siva A, Gall N, Cooklin M, Monaghan MJ. Real-time three-dimensional echocardiography: a novel technique to quantify global left ventricular mechanical dyssynchrony. Circulation. 2005;112(7):992-1000.
19. Marsan NA, Bleeker GB, Ypenburg C, Ghio S, van de Veire NR, Holman ER, et al. Real-time three-dimensional echocardiography permits quantification of left ventricular mechanical dyssynchrony and predicts acute response to cardiac resynchronization therapy. J Cardiovasc Electrophysiol. 2008;19(4):392-9.
20. Bleeker GB, Bax JJ, Fung JW, van der Wall EE, Zhang Q, Schalij MJ, et al. Clinical versus echocardiographic parameters to assess response to cardiac resynchronization therapy. Am J Cardiol. 2006;97(2):260-3.