Left Ventricular End Diastolic Pressure and Acute Coronary
Syndromes
Rogério Teixeira, Carolina Lourenço, Rui Baptista, Elisabete Jorge, Paulo Mendes, Fátima Saraiva, Silvia Monteiro,
Francisco Gonçalves, Pedro Monteiro, Maria J. Ferreira, Mário Freitas, Luís Providência
Departamento de Cardiologia, Hospital Universitário e Faculdade de Medicina de Coimbra - Portugal
Abstract
Background: Data is lacking in the literature regarding the prognostic impact of left ventricular-end diastolic pressure (LVEDP) across acute coronary syndromes (ACS).
Objective: To assess LVEDP and its prognostic implications in ACS patients.
Methods: Prospective, longitudinal and continuous study of 1,329 ACS patients from a single center between 2004 and 2006. Diastolic function was determined by LVEDP. Population was divided in two groups: A - LVEDP < 26.5 mmHg (n
= 449); group B - LVEDP ≥ 26.5 mmHg (n = 226).
Results: There were no significant differences between groups with respect to risk factors for cardiovascular disease, medical history and medical therapy during admission. In group A, patients with non-ST elevation ACS were more frequent, as well as normal coronary angiograms. In-hospital mortality was similar between groups, but one-year survival was higher in group A patients (96.9 vs 91.2%, log rank p = 0.002). On a multivariate Cox regression model,
a LVEDP ≥ 26.5 mmHg (HR 2.45, 95%CI 1.05 - 5.74) remained an independent predictor for one-year mortality, when
adjusted for age, LV systolic ejection fraction, ST elevation ACS, peak troponin, admission glycemia, and diuretics at 24
hours. Also, a LVEDP ≥ 26.5 mmHg was an independent predictor for a future readmission due to congestive HF (HR 6.65 95%CI 1.74 – 25.5).
Conclusion: In our selected population, LVEDP had a significant prognostic influence. (Arq Bras Cardiol 2011; 97(2) : 100-110)
Keywords: Heart failure; ventricular dysfunction, left; acute coronary syndrome/prognoses.
Mailing address: Rogério Teixeira •
Rua Maria Vitória Bobone, Condomínio Zen, lote 3, Ap 332 - Quinta da Portela - 3000-050 - Coimbra - Portugal
E-mail: [email protected]
Manuscript received on 09/06/10; revised received on 09/10/10; accepted on 03/18/11.
Introduction
After 10 to 20 seconds of coronary artery occlusion, relaxation time starts to shorten with a simultaneous rise in left ventricular end-diastolic pressure (LVEDP). Wall motion abnormalities occur between 15 and 30 seconds after culprit occlusion, and are followed by a drop in ejection fraction. After this cascade, ischemic symptoms and electrical signs of ischemia may ensue. Nevertheless, this presentation is highly variable, and is dependent on collateral flow, collateral perfusion and ischemic preconditioning1.
According to the 1998 European Society Cardiology working group report about how to diagnose diastolic HF, three obligatory conditions have to be simultaneously satisfied: 1 - the presence of signs of congestive heart failure (HF); 2 - presence of normal or only mildly abnormal left ventricular (LV) systolic function; 3 - evidence of abnormal LV relaxation, filling, diastolic distensibility or diastolic stiffness2.
The 2007 revised document challenged the third topic, recognizing the difficulties in the assessment of diastolic LV function, and based on recent data3, the measurement of
diastolic LV function was not required to attain the diagnosis of diastolic HF, also named HF with normal ejection fraction. Nevertheless the authors remarked that invasively acquired evidence of diastolic LV dysfunction remains definite evidence of HF with preserved systolic function4.
Both documents stated that the presence of a LVEDP > 16 mmHg in the presence of a non-dilated left ventricle is synonymous of LV diastolic distensibility reduction and therefore, a marker of LV diastolic dysfunction5.
Previous authors demonstrated that an elevated pulmonary capillary wedge pressure (PCWP) and a low cardiac index were independent predictors of outcome in the context of acute myocardial infarction (AMI)6-8. Most of the present data in the
literature on ACS patients and diastolic function is related to the noninvasive echocardiographic assessment of LV diastolic function. As reported by Oh et al9a restrictive filling pattern
after an AMI was associated with the occurrence of in-hospital HF. Other echocardiographic indexes were also considered of prognostic value, such as the deceleration time (DT) < 140 ms10-12, and also the E/E’ ratio greater than 15, as reported
with AMI the E/E’ ratio had a prognostic role with respect to all-cause mortality with an incremental value over age and left ventricular ejection fraction. Nevertheless, there was some conflicting data in the literature regarding diastolic function as a maker of prognosis, such as the study ATTenuation by Adenosine of Cardiac Complications(ATTACC), a randomized controlled trial of the addictive value of adenosine over fibrinolysis in ST elevation AMI, which failed to demonstrate the independent prognostic importance of restrictive filling defined by either a DT < 140 ms, or E/A ratio > 214.
Due to the lack of prognostic data related to invasively determined left ventricular filling patterns in current ACS patients, namely with respect to LVEDP, we hypothesized that LVEDP would predict an adverse outcome after an ACS. To test this hypothesis, we evaluated the prognostic value of LVEDP in a non-selected single center ACS population admitted for an invasive strategy during the acute phase.
Methods
Study population
The present was a continuous, observational, and prospective study of 1,459 consecutive admissions due to ACS, between May 2004 and December 2006, in a single center coronary care unit. We excluded 130 records as they were readmissions. The final population consisted of 1,329 patients. Of these, we selected the ones admitted for an invasive strategy - 786 patients.
AMI was defined according to the Universal Definition of myocardial infarction, as a positive cardiac biomarker (namely troponin I) with symptoms of ischemia or ECG changes indicative of new ischemia (ST and T wave and new bundle branch block)15.
Regarding ECG data, ST elevation AMI was defined by a new onset of ST elevation > 2 mm in the precordial leads for men and 1.5 mm for women and greater than 1 mm in other leads. Non-ST elevation AMI, in addition to the previous laboratorial and clinical criteria, could be associated or not with ECG ischemic changes (namely ST depression or T wave inversion)15.
Unstable angina was defined either by new onset angina (at least class III CCS), progressive angina, or angina at rest, with or without ECG ischemic changes, and a negative cardiac biomarker assay16.
LV systolic function was assessed by echocardiography, according to the Simpson method. The examination considered for this study was performed within 24 hours after the invasive assessment.
LVEDP was determined in the catheterization laboratory using a calibrated fluid filled system before left ventriculography. LVEDP was measured at the Z-point, which was identified on the left ventricular pressure trace as the point at which the slope of the ventricular pressure upstroke changes, approximately 50 ms after the ECG Q wave, and generally coinciding with the ECG R wave17. The decision to determine
LVEDP was left at the discretion of the hemodynamicist. All the patients were referred to the invasive procedure primarily to diagnose coronary artery disease, and not exclusively for an invasive assessment of LV hemodynamics.
Cardiac biomarkers namely, troponin I and MBCK were assessed daily, and the peak values during hospital stay were used in our analysis.
Population was divided in two groups based on the LVEDP. Group A included 449 patients that had LVEDP < 26.5 mmHg.
Group B patients had LVEDP ≥ 26.5 mmHg and comprised
226 individuals. LVEDP was not determined in 111 patients. This investigation conformed to the principles outlined in the Declaration of Helsinki. The local ethics committee approved the research protocol and informed consent has been obtained from all subjects.
Baseline data and patient follow-up
We analyzed standardized records during admission that included demographic, clinical, electrical, echocardiographic and laboratorial data. Medical therapy, catheterization data, intra-hospital course and discharge medication were also recorded.
We performed a median clinical follow up of 19 months after hospital discharge. The information was collected by phone call, from hospital records or at the outpatient clinic. The primary endpoint was all-cause mortality one year after discharge. Other results were also analyzed, such as the combined result of cardiovascular death, non-fatal infarction, re-admission for unstable angina, and unscheduled percutaneous coronary intervention - MACE, and re-admission for congestive HF one year after the culprit ACS admission.
Statistical analysis
The Kolmogorov-Smirnov test was used to assess if continuous variables were normally or non-normally distributed. Continuous data were presented as mean and standard deviation and compared with the Student t-test. Categorical variables were reported as frequencies and percentages, and the χ2 test or the exact Fisher tests were
used when appropriate.
The cumulative survival curves were constructed with the use of the Kaplan-Meier method and groups were compared with the Log rank test. The observational period started at hospital discharge and lasted for one year.
A multivariate Cox regression analysis was performed for the primary endpoint, and also for HF readmission one year after the ACS. Variables that were significant at the bivariate level (p < 0.05) or that had a clinical relevance, were included in the models.
With the exception of the Kolmogorov-Smirnov all statistical tests were two-tailed and a p value less than 0.05 was deemed significant. The analysis was performed with the SPSS 15 (Statistical Package for Social Sciences) from SPSS Inc, Chicago, IL.
Results
LVEDP was available for 675 patients. The mean value for the population was 23.2 mmHg, with a maximum value of 52.0 mmHg, and a minimum of 2.3 mmHg.
The study cohort consisted of 499 male and 176 female individuals with a mean age of 63.5 years. The baseline demographic, clinical characteristics and in-hospital management of both groups of patients are presented in Tables 1 to 4.
A higher LVEDP was associated with STEMI, higher peak values of cardiac biomarkers, a lower left ventricular ejection fraction (LVEF), and a more dilated left ventricle. There was a negative significant correlation between LVEDP and LVEF (r: -0.324, p value < 0.01).
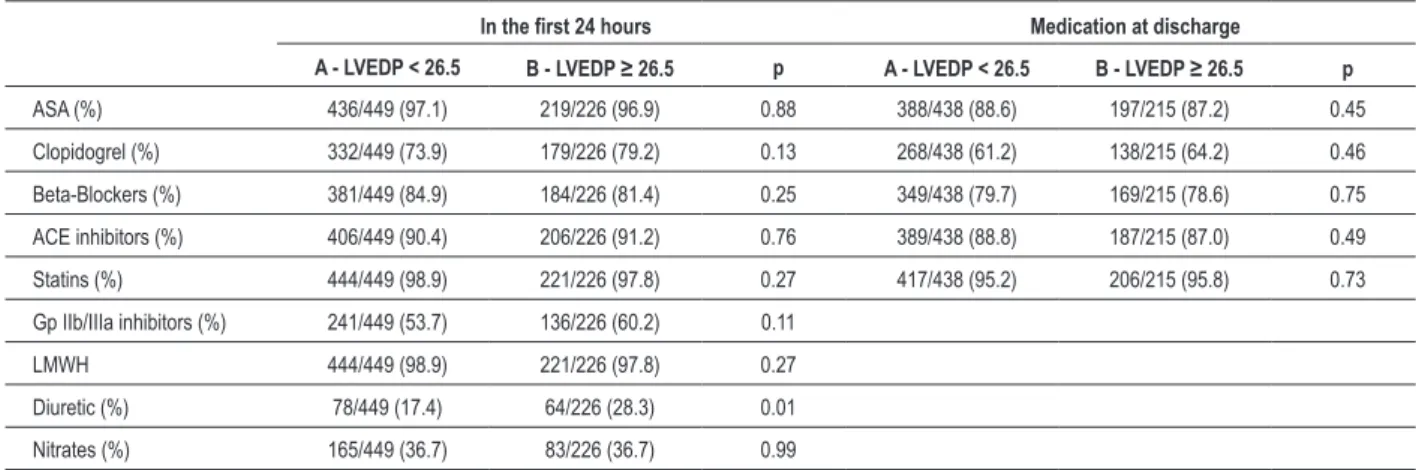
Patients with a lower LVEDP had a lower likelihood of in-hospital HF, were less often prescribed a diuretic at 24 hours (17.4 vs 28.3%, p = 0.001), and had more frequently a normal coronary angiogram.
There were no other significant differences with respect to intrahospital and discharge medical therapy. The in-hospital mortality was similar for both groups (2.4 vs 4.9%, p = 0.095).
Outcome
With respect to follow up, data was available for 618 (lost-to-follow-up rate of 5.4%) of the discharged patients.
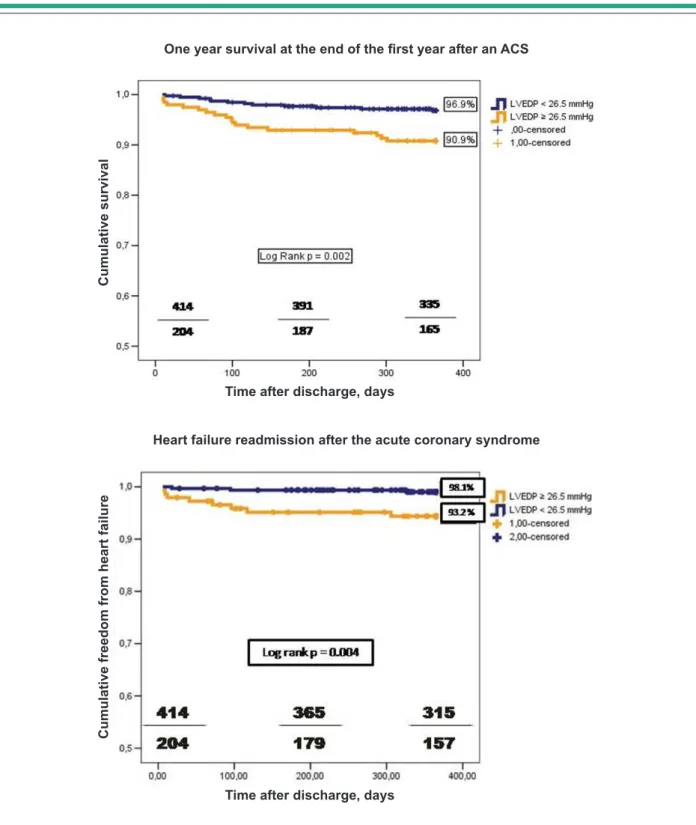
A higher LVEDP was associated with a lower survival status at one, six and twelve months after discharge - Table 5. The cumulative one year survival rate was significantly lower for group B patients (96.9 vs 91.2% log rank p = 0.002) - Figure 1. This difference remained significant for the subgroup with
preserved systolic function (LVEF ≥ 40%), but the stratification
proposed for LVEDP as a survival marker was not significant for the depressed LV function (LVEF < 40%). The p value for interaction between these last three variables was not significant (0.59).
In the univariate analysis, a LVEDP ≥ 26.5 mmHg was
significantly associated with a higher mortality one year after discharge - Table 6, as were age, LVEF, STEMI, diuretics at 24 hours, glycemia at admission, and the peak value of
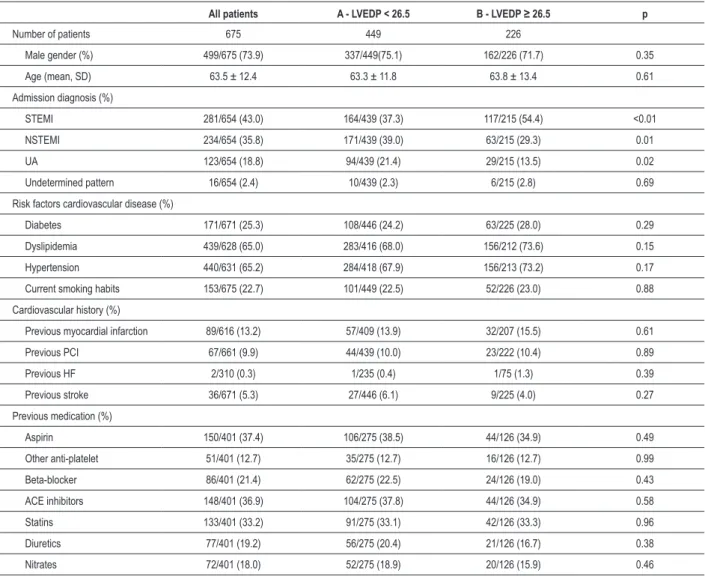
Table 1 - Baseline characteristics
All patients A - LVEDP < 26.5 B - LVEDP ≥ 26.5 p
Number of patients 675 449 226
Male gender (%) 499/675 (73.9) 337/449(75.1) 162/226 (71.7) 0.35
Age (mean, SD) 63.5 ± 12.4 63.3 ± 11.8 63.8 ± 13.4 0.61
Admission diagnosis (%)
STEMI 281/654 (43.0) 164/439 (37.3) 117/215 (54.4) <0.01
NSTEMI 234/654 (35.8) 171/439 (39.0) 63/215 (29.3) 0.01
UA 123/654 (18.8) 94/439 (21.4) 29/215 (13.5) 0.02
Undetermined pattern 16/654 (2.4) 10/439 (2.3) 6/215 (2.8) 0.69
Risk factors cardiovascular disease (%)
Diabetes 171/671 (25.3) 108/446 (24.2) 63/225 (28.0) 0.29
Dyslipidemia 439/628 (65.0) 283/416 (68.0) 156/212 (73.6) 0.15
Hypertension 440/631 (65.2) 284/418 (67.9) 156/213 (73.2) 0.17
Current smoking habits 153/675 (22.7) 101/449 (22.5) 52/226 (23.0) 0.88
Cardiovascular history (%)
Previous myocardial infarction 89/616 (13.2) 57/409 (13.9) 32/207 (15.5) 0.61
Previous PCI 67/661 (9.9) 44/439 (10.0) 23/222 (10.4) 0.89
Previous HF 2/310 (0.3) 1/235 (0.4) 1/75 (1.3) 0.39
Previous stroke 36/671 (5.3) 27/446 (6.1) 9/225 (4.0) 0.27
Previous medication (%)
Aspirin 150/401 (37.4) 106/275 (38.5) 44/126 (34.9) 0.49
Other anti-platelet 51/401 (12.7) 35/275 (12.7) 16/126 (12.7) 0.99
Beta-blocker 86/401 (21.4) 62/275 (22.5) 24/126 (19.0) 0.43
ACE inhibitors 148/401 (36.9) 104/275 (37.8) 44/126 (34.9) 0.58
Statins 133/401 (33.2) 91/275 (33.1) 42/126 (33.3) 0.96
Diuretics 77/401 (19.2) 56/275 (20.4) 21/126 (16.7) 0.38
Nitrates 72/401 (18.0) 52/275 (18.9) 20/126 (15.9) 0.46
Table 2 - Hemodynamic, electrical and laboratory data
All patients A - LVEDP < 26.5 B - LVEDP ≥ 26.5 p
Hemodynamic data on admission
Heart rate, bpm (mean, SD) 76.5 ± 15.3 75.2 ± 15.3 78.8 ± 15.4 0.05
Systolic blood pressure, mmHg (mean, SD) 135.0 ± 24.3 136.3 ± 23.2 134.8 ± 26.8 0.46
Diastolic blood pressure, mmHg (mean, SD) 73.9 ± 14.2 73.4 ± 13.7 74.3 ± 15.3 0.48
TIMI risk score ≤ 2 (%) 342/675 (50.7) 236/449 (52.6) 106/226 (46.9) 0.17
TIMI risk score 3 - 4 (%) 276/675 (40.9) 177/449 (39.4) 99/226 (43.8) 0.27
TIMI risk score ≥ 5 (%) 57/675 (8.4) 36/449 (8.0) 21/226 (9.3) 0.57
Body mass index (kg/m2) 27.7 ± 4.8 27.4 ± 4.6 28.3 ± 5.3 0.03
Electrical data on admission (%)
Sinus Rhythm 613/671 (91.4) 409/446 (91.7) 204/225 (90.7) 0.65
AF 36/671 (5.4) 23/446 (5.2) 13/225 (5.8) 0.74
ST depression 47/671 (7.0) 33/446 (7.4) 14/225 (6.2) 0.57
T wave inversion 96/671 (14.3) 69/446 (15.5) 27/225 (12.0) 0.23
Laboratory (mean, SD)
Peak Troponin I, U/l 44.5 ± 63.0 33.0 ± 58.2 53.9 ± 69.0 <0.01
Peak MBCK mass, U/l 125.4 ± 177.7 96.9 ± 134.8 171.0 ± 233.2 <0.01
Total cholesterol, mg/dl 194.7 ± 49.6 192.7 ± 48.4 199.0 ± 53.2 0.20
LDL cholesterol, mg/dl 131.2 ± 37.0 130.4 ± 36.1 133.9 ± 39.7 0.34
HDL cholesterol, mg/dl 43.3 ± 10.3 42.4 ± 10.0 44.5 ± 10.5 0.04
Glomerular iltration rate ml/min 71.5 ± 21.5 72.4 ± 20.7 69.4 ± 23.2 0.12
Admission glycemia, mg/dl 149.4± 63.9 155.5 ± 68.4 144.7 ± 59.0 0.06
Admission hemoglobin, g/dl 14.2 ± 1.6 14.2 ± 1.7 14.0 ± 1.6 0.20
Minimum hemoglobin, g/dl 12.4 ± 1.7 12.4 ± 1.7 12.1 ± 1.7 0.06
AF - atrial ibrillation; LVEDP - left ventricular-end diastolic pressure.
Table 3 - In-hospital management
In the irst 24 hours Medication at discharge
A - LVEDP < 26.5 B - LVEDP ≥ 26.5 p A - LVEDP < 26.5 B - LVEDP ≥ 26.5 p
ASA (%) 436/449 (97.1) 219/226 (96.9) 0.88 388/438 (88.6) 197/215 (87.2) 0.45
Clopidogrel (%) 332/449 (73.9) 179/226 (79.2) 0.13 268/438 (61.2) 138/215 (64.2) 0.46
Beta-Blockers (%) 381/449 (84.9) 184/226 (81.4) 0.25 349/438 (79.7) 169/215 (78.6) 0.75
ACE inhibitors (%) 406/449 (90.4) 206/226 (91.2) 0.76 389/438 (88.8) 187/215 (87.0) 0.49
Statins (%) 444/449 (98.9) 221/226 (97.8) 0.27 417/438 (95.2) 206/215 (95.8) 0.73
Gp IIb/IIIa inhibitors (%) 241/449 (53.7) 136/226 (60.2) 0.11
LMWH 444/449 (98.9) 221/226 (97.8) 0.27
Diuretic (%) 78/449 (17.4) 64/226 (28.3) 0.01
Nitrates (%) 165/449 (36.7) 83/226 (36.7) 0.99
ASA - acetyl salicylic acid; LMWH - low molecular weight heparin; Gp - glycoprotein; LVEDP - left ventricular-end diastolic pressure.
troponin I. In a composite model that included the previous seven variables, LVEDP as a continuous variable was not an independent predictor of outcome (HR 1.03, 95% CI 0.98 - 1.08, p = 0.17) - Table 6. There were no interactions between LVEDP and LVEF regarding this endpoint, as in a Cox
regression model that included only those two variables, they both remained significant (data not shown).
Table 4 - Echo and cath lab data
A - LVEDP < 26.5 B - LVEDP ≥ 26.5 p
Echocardiographic data
Left atrium, mm º 41.4 ± 6.6 41.4 ± 6.5 0.97
LV end systolic diameter, mm º 38.9 ± 6.9 41.7 ± 7.8 <0.01
LV end diastolic diameter, mm º 56.2 ± 6.6 58.4 ± 6.6 <0.01
LVEF, % º 54.6 ± 9.05 48.8 ± 11.2 <0.01
LVEF < 40% * 58/447 (13.0) 64/226 (28.3) <0.01
LV shortening fraction, % º 31.5 ± 5.5 29.8 ± 6.2 0.01
LV motility wall abnormality * 233/332 (70.2) 146/175 (83.4) 0.01
Mitral regurgitation * 202/359 (56.3) 115/191 (60.2) 0.73
Pulmonary artery systolic pressure, mmHg º 32.4 ± 10.4 31.9 ± 11.0 0.81
Cath lab data
Time to balloon (primary angioplasty), hours 2.0 ± 1.9 1.5 ± 1.5 0.06
Coronary angiogram ≤ 48 hours *+ 79/224 (35.3) 30/70 (42.9) 0.25
Coronary angiogram > 48 hours * + 145/224 (64.7) 40/70 (57.1) 0.25
Normal coronary angiogram * 68/418 (16.3) 19/211 (9.0) 0.01
1 vessel coronary disease * 172/418 (41.1) 91/211 (43.1) 0.64
2 vessel coronary disease * 96/418 (23.0) 52/211 (24.6) 0.64
3 vessel coronary disease * 77/418 (18.4) 49/211 (23.2) 0.16
Fully revascularized* 172/350 (49.1) 94/192 (49.0) 0.96
Partially revascularized* 89/350 (26.0) 50/192 (26.0) 0.88
Not revascularized* 89/350 (25.4) 48/192 (25.0) 0.91
Stent* 258/418 (61.7) 133/211 (63.0) 0.75
Drug eluting stents* 181/258 (70.2) 91/132 (68.9) 0.81
Surgical revascularization* 16/418 (3.8) 6/211 (2.8) 0.53
º - mean ± SD; * - %; + for non-ST elevation ACS; LVEF - left ventricular ejection fraction, LVEDP - left ventricular-end diastolic pressure.
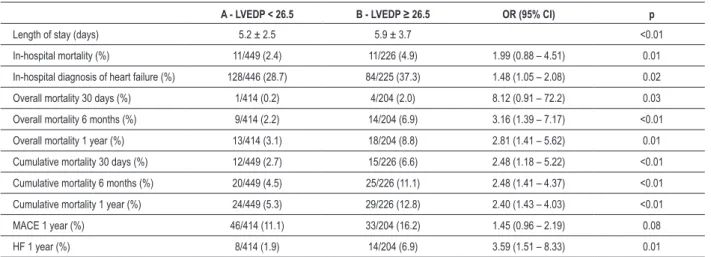
Table 5 - Outcomes in the hospital and 1 year after discharge
A - LVEDP < 26.5 B - LVEDP ≥ 26.5 OR (95% CI) p
Length of stay (days) 5.2 ± 2.5 5.9 ± 3.7 <0.01
In-hospital mortality (%) 11/449 (2.4) 11/226 (4.9) 1.99 (0.88 – 4.51) 0.01
In-hospital diagnosis of heart failure (%) 128/446 (28.7) 84/225 (37.3) 1.48 (1.05 – 2.08) 0.02
Overall mortality 30 days (%) 1/414 (0.2) 4/204 (2.0) 8.12 (0.91 – 72.2) 0.03
Overall mortality 6 months (%) 9/414 (2.2) 14/204 (6.9) 3.16 (1.39 – 7.17) <0.01
Overall mortality 1 year (%) 13/414 (3.1) 18/204 (8.8) 2.81 (1.41 – 5.62) 0.01
Cumulative mortality 30 days (%) 12/449 (2.7) 15/226 (6.6) 2.48 (1.18 – 5.22) <0.01
Cumulative mortality 6 months (%) 20/449 (4.5) 25/226 (11.1) 2.48 (1.41 – 4.37) <0.01
Cumulative mortality 1 year (%) 24/449 (5.3) 29/226 (12.8) 2.40 (1.43 – 4.03) <0.01
MACE 1 year (%) 46/414 (11.1) 33/204 (16.2) 1.45 (0.96 – 2.19) 0.08
HF 1 year (%) 8/414 (1.9) 14/204 (6.9) 3.59 (1.51 – 8.33) 0.01
Figure 2. The proposed stratification of the LVEDP also had a
significant impact in the subpopulation with LVEF ≥ 40%, but
not in the ones with LVEF < than 40%. The p value for the interaction of LVEDP, LVEF, and HF in the follow-up was not significant (0.37). LVEDP as a continuous variable remained an independent predictor of HF readmission, in a composite model that included LVEDP (as a continuous variable), age,
LVEF, peak troponin I, STEMI, TIMI risk score, diuretics at 24 hours and atrial fibrillation - Table 7.
Discussion
Our data confirmed LVEDP as a risk stratification variable during an ACS. As a continuous variable and after adjustment, Figures 1. e 2 -Outcomes with respect to overall survival and HF readmission one year after the ACS.
Heart failure readmission after the acute coronary syndrome
One year survival at the end of the irst year after an ACS
C
um
ul
ati
ve
fr
ee
do
m
fr
om
h
ea
rt
fa
ilu
re
C
um
ul
ati
ve
s
ur
vi
va
l
Time after discharge, days
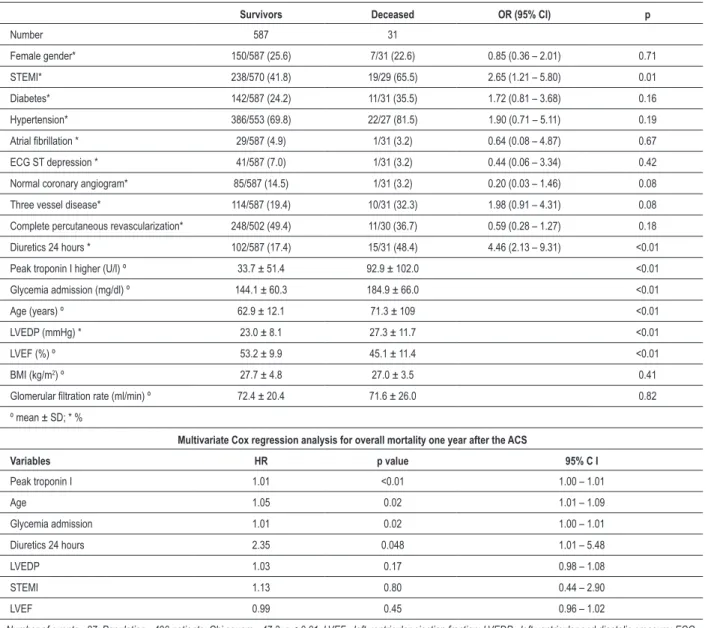
Table 6 - Univariate predictors of all-cause mortality one year after the ACS
Survivors Deceased OR (95% CI) p
Number 587 31
Female gender* 150/587 (25.6) 7/31 (22.6) 0.85 (0.36 – 2.01) 0.71
STEMI* 238/570 (41.8) 19/29 (65.5) 2.65 (1.21 – 5.80) 0.01
Diabetes* 142/587 (24.2) 11/31 (35.5) 1.72 (0.81 – 3.68) 0.16
Hypertension* 386/553 (69.8) 22/27 (81.5) 1.90 (0.71 – 5.11) 0.19
Atrial ibrillation * 29/587 (4.9) 1/31 (3.2) 0.64 (0.08 – 4.87) 0.67
ECG ST depression * 41/587 (7.0) 1/31 (3.2) 0.44 (0.06 – 3.34) 0.42
Normal coronary angiogram* 85/587 (14.5) 1/31 (3.2) 0.20 (0.03 – 1.46) 0.08
Three vessel disease* 114/587 (19.4) 10/31 (32.3) 1.98 (0.91 – 4.31) 0.08
Complete percutaneous revascularization* 248/502 (49.4) 11/30 (36.7) 0.59 (0.28 – 1.27) 0.18
Diuretics 24 hours * 102/587 (17.4) 15/31 (48.4) 4.46 (2.13 – 9.31) <0.01
Peak troponin I higher (U/l) º 33.7 ± 51.4 92.9 ± 102.0 <0.01
Glycemia admission (mg/dl) º 144.1 ± 60.3 184.9 ± 66.0 <0.01
Age (years) º 62.9 ± 12.1 71.3 ± 109 <0.01
LVEDP (mmHg) * 23.0 ± 8.1 27.3 ± 11.7 <0.01
LVEF (%) º 53.2 ± 9.9 45.1 ± 11.4 <0.01
BMI (kg/m2) º 27.7 ± 4.8 27.0 ± 3.5 0.41
Glomerular iltration rate (ml/min) º 72.4 ± 20.4 71.6 ± 26.0 0.82
º mean ± SD; * %
Multivariate Cox regression analysis for overall mortality one year after the ACS
Variables HR p value 95% C I
Peak troponin I 1.01 <0.01 1.00 – 1.01
Age 1.05 0.02 1.01 – 1.09
Glycemia admission 1.01 0.02 1.00 – 1.01
Diuretics 24 hours 2.35 0.048 1.01 – 5.48
LVEDP 1.03 0.17 0.98 – 1.08
STEMI 1.13 0.80 0.44 – 2.90
LVEF 0.99 0.45 0.96 – 1.02
Number of events - 27; Population - 490 patients; Chi square - 47.3; p < 0.01. LVEF - left ventricular ejection fraction; LVEDP - left ventricular end diastolic pressure; ECG - Eletrocardiogram; BMI - body mass index.
LVEDP had a prognostic impact regarding HF readmission after an ACS - for each 1 mmHg increase, the relative risk increased 1.10 times (1.04 to 1.16). On the contrary, LVEDP was not an independent predictor with respect to in-hospital mortality, one-year mortality and one-year ischemic complications (MACE rate). The cutoff of 16 mmHg used to identify LV diastolic dysfunction4, was not an univariate predictor of follow-up
mortality. It was associated with a higher rate of readmission for HF (data not shown), but with lower sensitivity and specificity.
Prognosis
As previously reported, a higher PCWP - a maker of LV diastolic distensibility, in the context of acute MI was associated with larger infarcts18 and with a worse LV systolic function19.
In our population, a higher LVEDP was more frequently related with STEMI, and with higher peak values of troponin I. That was in agreement with the work of Bronzear et al20,
as ischemic myocardium was associated with higher LV filling pressures and reduced left ventricular distensibility during pace-induced ischemia.
Our work also corroborated the previous clinical data reported by Killip and Kimball in 1967, as a higher LV filling pressure was synonymous of an in-hospital diagnosis of HF21.
Similarly to recently published data on the Forrester invasive classification, PCWP was not an independent predictor of in-hospital outcome8, as LVEDP was not in our study. This lack of
Table 7 - Univariate predictors of readmission for congestive heart failure one year after the ACS
No event Event OR (95% CI) p
Number 596 22
Female gender* 151/596 (25.3) 6/22 (27.3) 1.11 (0.43 – 2.88) 0.84
STEMI* 243/578 (42.0) 14/21 (66.7) 2.76 (1.10 – 6.93) 0.03
Diabetes* 146/596 (24.5) 7/22 (31.8) 1.10 (0.83 – 1.48) 0.44
Hypertension* 392/560 (70.0) 16/20 (80.0) 1.71 (0.57 – 5.20) 0.34
TIMI risk score ≤ 2* 311/596 (52.2) 3/22 (13.6) 0.15 (0.04 – 0.49) <0.01
LVEDP ≥ 26.5mmHg * 190/596 (31.9) 14/22 (63.6) 3.74 (1.54 – 9.07) 0.02
Atrial ibrillation * 27/596 (4.5) 3/22 (13.6) 3.33 (0.93 – 11.94) 0.05
Normal coronary angiogram* 85/596 (14.3) 1/22 (4.5) 0.29 (0.04 – 2.16) 0.20
Incomplete percutaneous revascularization* 259/511 (50.7) 14/22 (66.7) 1.95 (0.77 – 4.90) 0.15
Diuretics 24 hours * 107/596 (18.0) 10/22 (45.5) 3.81 (1.60 – 9.04) 0.01
LVEDP (mmHg) º 22.8 ± 8.2 30.8 ± 8.6 <0.01
Peak troponin I (U/l) º 35.0 ± 53.3 88.5 ± 104.6 <0.01
Age (years) º 62.9 ± 12.1 74.2 ± 7.1 <0.01
LVEF (%) º 53.2 ± 9.9 41.1 ± 10.0 <0.01
BMI (kg/m2)º 27.7 ± 4.8 28.0 ± 3.0 0.77
º mean ± SD; * %
Multivariate Cox regression analysis for readmission due to congestive heart failure one year after the ACS
Variables HR p value 95% C I
LVEDP 1.10 <0.01 1.04 – 1.16
Age 1.10 0.01 1.02 – 1.16
Peak troponin I 1.01 0.03 1.00 – 1.01
Diuretics 24 hours 1.44 0.49 0.52 – 3.94
LVEF 0.98 0.31 0.95 – 1.02
Atrial ibrillation 0.94 0.95 0.12 – 7.38
STEMI 0.73 0.63 0.21 – 2.57
TIMI risk score ≤ 2 0.27 0.09 0.06 – 1.27
Number of events - 17; Population - 489; Chi square - 52.1 ; p < 0.01. LVEF - left ventricular ejection fraction; LVEDP - left ventricular-end diastolic pressure.
medical treatment with nitrates, diuretics and vasodilators influenced the loading conditions of the LV, and consequently LVEDP, and lastly, time evolution of the ACS might have had an impact on myocardial ischemia, development of fibrosis and changes in LV geometry, which also influenced filling pressures and LV distensibility22.
As previously described, early myocardial stunning may transiently increase LVEDP with subsequent normalization of filling pressures over the long term23. That associated with the
exclusion of the 111 patients could also in our opinion explain the lower sensitivity and specificity of the proposed cutoff for LVEDP for the primary outcome of our analysis.
The importance of diastolic function as a marker of prognosis was in agreement with previous authors that analyzed the role of various echocardiographic markers, such as E/A ratio, the DT of the E wave, and the E/E’ ratio9-13.
The E/E’ is the most reliable method of diastolic function assessment as correlation with LV filling pressures, and contrary
to other indexes, it is present even in patients with preserved systolic function. When the E/E’ ratio exceedes 15, LV filling pressures are elevated and when the ratio is lower than 8, LV filling pressures are low24. An E/E’ ratio ranging from 8 to 15
is considered suggestive, but not diagnostic, of diastolic LV dysfunction and other non-invasive investigations need to be performed to confirm the diagnosis of diastolic dysfunction4.
Other disadvantages of the E/E´ ratio are due to the fact that tissue Doppler cannot separate active contraction from passive tethering, annular velocities vary depending on the location of the sample, and are influenced by “local” acute myocardial infarction and the presence of mitral annulus calcification12.
Analyzing data from the work of Hill et al13, an E/E’ ratio
greater than 15 had a prognostic significance, but the mean E/E’ ratio for the selected 250 patients post-AMI was 13.8 ± 6.8, which was precisely in the “grey” zone area of the diastolic function assessment13. Nevertheless, the E/E’ ratio > 15 was
survival as a categorical variable (with a cutoff of 26.5 mmHg, data not shown), but lost that capacity as a continuous one.
From diastolic to congestive HF
The higher prognostic value of invasive hemodynamic versus clinical signs of elevated filling pressures had already been described by Shell et al25.In our population we observed
that the assessment of diastolic function had a higher predictive value for congestive HF readmission than clinical variables such as the Killip-Kimball class, and even the percutaneous revascularization grade.
The natural history of HF from an ischemic etiology is based on the development of diastolic dysfunction, followed by diastolic HF, and finally by the onset of systolic HF26. Pressure
overload of the LV will cause myocyte stretching, increased wall stress, poorer subendocardial perfusion, and reduced energy production, which in turn will lead to neurohormonal activation and ventricular remodeling. These compensatory mechanisms are deleterious, and therefore will lead in the future to loss of LV systolic function and impaired survival.
Our data strongly support this paradigm, as diastolic function was a determinant of congestive HF future admission, and therefore of LV remodeling namely in the group of patients with preserved systolic function. In the population with LVEF under 40% during the index ACS, diastolic function was not powerful enough to determine prognosis - systolic dysfunction overcame diastolic dysfunction.
This subset of ACS patients with preserved ejection fraction and higher LVEDP should therefore not be stereotyped as low-risk, and neurohormonal blocking, vasodilators and probably diuretics could have a crucial importance.
Study limitations
Although the present cohort represented a consecutive group of patients, not all patients submitted to a coronary angiogram had an invasive assessment of LV diastolic function as this was performed at the discretion of the invasive cardiologist. Moreover, only 60% of the 1,329 patients admitted to our coronary care unit were submitted to an invasive strategy. Therefore an exclusion of the highest risk patients might have occurred. We also regret our lost-to-follow-up rate of 5.4%.
Either systolic or diastolic indexes reflected instantaneous measurements, and could vary across the ACS period. Therefore a single measurement might not reflect the best prognostic index. Furthermore, there were no reports on the diastolic function previous to the index ACS admission, nor there was a noninvasive echocardiographic assessment of the mitral inflow.
Conclusions
In our ACS population, LVEDP was an independent predictor of a future HF readmission.
Potential Conflict of Interest
No potential conflict of interest relevant to this article was reported.
Sources of Funding
There were no external funding sources for this study.
Study Association
This study is not associated with any post-graduation program.
References
1. Carroll JD, Hess OM, Hirzel HO, Turina M, Krayenbuehl HP. Effects of ischemia, bypass surgery and past infarction on myocardial contraction, relaxation and compliance during exercice. Am J Cardiol. 1989;63(10):65E-71E.
2. European Study Group on Diastolic Heart Failure. How to diagnose diastolic heart failure. Eur Heart J. 1998;19(7):990-1003.
3. Zile MR, Gaasch WH, Carroll JD, Feldman MD, Aurigemma GP, Schaer GL, et al. Heart failure with a normal ejection fraction: is measurement of diastolic function necessary to make the diagnosis of diastolic heart failure? Circulation. 2001;104(7):779-82.
4. Paulus WJ, Tschope C, Sanderson JE, Rusconi C, Flachskampf FA, Rademakers FE, et al. How to diagnose diastolic heart failure: a consensus statement on the diagnosis of heart failure with normal left ventricular ejection fraction by the Heart Failure and Echocardiography Associations of the European Society of Cardiology. Eur Heart J. 2007;28(20):2539-50.
5. Yamakado T, Takagi E, Okubo S, Imanaka-Yoshida K, Tarumi T, Nakamura M, et al. Effects of aging on left ventricular relaxation in humans. Circulation. 1997;95(4):917-23.
6. Forrester JS, Diamond G, Chatterjee K, Swan HJ. Medical therapy of acute myocardial infarction by application of hemodynamic subsets (first of two parts). N Engl J Med. 1976;295(24):1356-62.
7. The Multicenter Postinfarction Research Group. Risk stratification and survival after myocardial infarction. N Engl J Med. 1983;309:331-6.
8. Siniorakis E, Arvanitakis S, Voyatzopoulos G, Hatziandreou P, Plataris G, Alexandris A, et al. Hemodynamic classification in acute myocardial infarction. Chest. 2000;117(5):1286-90.
9. Oh JK, Ding ZP, Gersh BJ, Bailey KR, Tajik AJ. Restrictive left ventricular diastolic filling identifies patients with heart failure after acute myocardial infarction. J Am Soc Echocardiogr. 1992;5(5):497-503.
10. Temporelli PL, Gianuzzi P, Nicolosi GL, Latini R, Franzosi MG, Gentile F, et al. Doppler-derived mitral deceleration time as a strong prognostic marker of left ventricular remodeling and survival after acute myocardial infarction: results of the GISSI-3 echo substudy. J Am Coll Cardiol. 2004;43(9):1646-53.
11. Schwammenthal E, Alder Y, Amichai K, Sagie A, Behar S, Hod H, et al. Prognostic value of global myocardial performance indices in acute myocardial infarction: comparison to measures of systolic and diastolic left ventricular function. Chest. 2003;124(5):1645-51.
12. Moller J, Egstrup K, Kober L, Poulsen S, Nyvad O, Torp-Pedersen C. Prognostic importance of systolic and diastolic function after acute myocardial infarction. Am Heart J. 2003;145:147-53.
14. Quintana M, Edner M, Kahan T, Hjemdahl P, Sollevi A, Rehnqvist N. Is left ventricular diastolic function an independent marker of prognosis after acute myocardial infarction? Int J Cardiol. 2004;96(2):183-9.
15. Thygesen K, Alpert J, White HD; Joint ESC/ACCF/AHA/WHF Task Force for the Redifinition of Myocardial Infarction. Universal definition of myocardial infarction. Eur Heart J. 2007;28(20):2525-38.
16. Anderson JL, Adams CD, Antman EM, Bridges CR, Califf RM, Casey DE Jr,et al. ACC/AHA 2007 guidelines for the management of patients with unstable angina/non-ST-elevation myocardial infarction: a report of the American College of Cardiology/American Heart Association Task Force on Practice Guidelines (Writing Committee to revise the 2002 Guidelines for the Management of Patients with Unstable Angina/Non-ST-Elevation Myocardial Infarction): developed in collaboration with the American College of Emergency Physicians, American College of Physicians, Society for Academic Emergency Medicine, Society for Cardiovascular Angiography and Interventions, and Society of Thoracic Surgeons. Circulation. 2007;116(7):e148-304.
17. Braunwald E, Fishman AP, Cournand A. Time relationship of dynamic events in the cardiac chambers, pulmonary artery and aorta in man. Circ Res. 1956;4(1):100-7.
18. Johannessen KA, Cerqueira MD, Stratton JR. Influence of myocardial infarction size on radionuclide and Doppler echocardiographic measurements of diastolic function. Am J Cardiol. 1990;65(11):692-7.
19. Otasevic P, Neskovic AN, Popovic Z, Vlahović A, Bojić D, Bojić M, et al. Short early filling decelaration time on day 1 after acute myocardial infarction
is associated with short and long term left ventricular remodelling. Heart. 2001;85(5):527-32.
20. Bronzwaer JG, de Bruyne B, Ascoop CA, Paulus WJ. Comparative effects of pacing-induced and balloon coronary occlusion ischemia on left ventricular diastolic function in man. Circulation. 1991;84(1):211-22.
21. Killip T 3rd, Kimball JT. Treatment of myocardial infarction in a coronary care unit: a two year experience with 250 patients. Am J Cardiol. 1967;20(4):457-64.
22. Moller JE, Hillis GS, Oh JK, Seward JB, Reeder GS, Wright RS, et al. Left atrial volume: a powerful predictor of survival after acute myocardial infarction. Circulation. 2003;107(17):2207-12.
23. Weisse AB, Saffa RS, Levinson GE, Jacobson WW Jr, Regan TJ. Left ventricular function during the early and late stages of scar formation following experimental myocardial infarction. Am Heart J. 1970;79(3):370-83.
24. Ommem SR, Nishimura RA, Appleton CP, Miller FA, Oh JK, Redfield MM, et al. Clinical utility of Doppler echocardiography and tissue Doppler imaging in the estimation of left ventricular filling pressures: a comparative simultaneous Doppler-catheterization study. Circulation. 2000;102(15):1788-94.
25. Shell WE, DeeWood MA, Peter T, Mickle D, Prause JA, Forrester JS, et al. Comparison of clinical signs and hemodynamic state in the early hours of transmural myocardial infarction. Am Heart J. 1982;104(3):521-8.