online | memorias.ioc.fiocruz.br
Prevalence of tuberculosis respiratory symptoms and associated
factors in the indigenous populations of Paraguay (2012)
Sarita Aguirre1, Celia Martínez Cuellar2, María Belén Herrero3, Gustavo Chamorro Cortesi4, Nilda Gimenez de Romero4, Mirian Alvarez5, Jose Ueleres Braga6,7/+
1Ministry of Public Health and Social Welfare of Paraguay, Tuberculosis Control Program, Asunción, Paraguay 2Universidad Nacional de Asunción, Facultad de Ciencias Médicas, Asunción, Paraguay
3Facultad Latinoamericana de Ciencias Sociales, Department of International Relations, Buenos Aires, Argentina 4Ministry of Public Health and Social Welfare of Paraguay, Central Public Health Laboratory, Asunción, Paraguay
5Ministry of Public Health and Social Welfare of Paraguay, Department of Statistics of the Tuberculosis Control Program, Asunción, Paraguay 6Fundação Oswaldo Cruz-Fiocruz, Escola Nacional de Saúde Pública, Departamento de Epidemiologia e Métodos Quantitativos, Rio de Janeiro, RJ, Brasil 7Universidade do Estado do Rio de Janeiro, Instituto de Medicina Social, Departamento de Epidemiologia, Rio de Janeiro, RJ, Brasil
BACKGROUND The prevalence of respiratory symptoms and confirmed tuberculosis (TB) among indigenous groups in Paraguay is unknown.
METHODS This study assessed the prevalence of respiratory symptoms, confirmed pulmonary TB, and associated socio-economic factors among indigenous Paraguayan populations. Indigenous persons residing in selected communities were included in the study. A total of 24,352 participants were interviewed at home between October and December 2012. Respiratory symptomatic individuals were defined as those with respiratory symptoms of TB. A hierarchical Poisson regression analysis was performed with four levels: individual characteristics, living conditions and environmental characteristics, source of food, and type of nutrition.
FINDINGS In this study, 1,383 participants had respiratory symptoms (5.7%), but only 10 had culture-confirmed TB (41/100,000 inhabitants). The small number of cases did not allow evaluation of the risk factors for TB. Age older than 37 years was associated with a two-fold increased risk of symptoms. Female sex; family history of TB; type of housing; home heating; a lack of hunting, fishing, or purchasing food; and a lack of vegetable consumption were also associated with the presence of symptoms. A lack of cereal consumption had a protective effect. Members of the Ayoreo or Manjui ethnic groups had a three-fold increased risk of symptoms.
MAIN CONCLUSION Individual characteristics, dietary habits, and belonging to specific ethnic groups were associated with respiratory symptoms.
Key words: pulmonary tuberculosis - population groups - cross-sectional studies - risk factors
doi: 10.1590/0074-02760160443
+ Corresponding author: ueleres@gmail.com Received 4 October 2016
Accepted 20 March 2017
Despite being a curable and preventable disease, tu-berculosis (TB) remains a significant public health is-sue worldwide. The determinants of TB epidemiology include socioeconomic inequality, delayed diagnosis, and lack of social support for the care of sick individu-als (Hargreaves et al. 2011). TB largely affects the vul-nerable sections of the population, including indigenous populations (AFN 2009, Tollefson et al. 2013).
An approximate population of 370,000,000 indigenous persons worldwide comprises 5% of the global population (UN 2012). While there is evidence to suggest that the bur-den of TB increases considerably among the indigenous populations (Fanning 1999, Fitzgerald et al. 2000, Das et al. 2006, Barry & Konstantinos 2009, CDC 2010), the current global burden of TB remains unknown (Hoeppner & Mar-ciniuk 2000, Culqui et al. 2010, Tollefson et al. 2013). The Stop TB Initiative highlighted the need to improve surveil-lance in indigenous villages in order to assess the burden of TB among these populations (AFN 2009).
Ten percent of the population in Latin America is indigenous (Culqui et al. 2010). The majority suffer dis-crimination and live in isolation and poverty. TB in these indigenous populations is associated with high poverty, migration, marginalisation, lack of territorial rootedness, environment destruction, and unmet basic needs (Culqui et al. 2010, Lopez et al. 2013). Poor living conditions in-crease the susceptibility to illness in these populations, and there are often language, geographical, and cultural barriers that lead to a delayed diagnosis of TB, which re-sults in the delayed identification of transmission sources within the community and an increased risk of new cases (Culqui et al. 2010, Lopez et al. 2013, Tollefson et al. 2013).
According to the 2002 Census, there are 20 ethnic groups in Paraguay, which constitute 1.7% of the national population (DGEEC 2012). Based on the results of the 2012 Survey of Indigenous Households, approximately 112,800 persons belong to indigenous communities (DGEEC 2012).
The estimated incidence of respiratory symptoms (RS) and the prevalence of TB among the indigenous popula-tions of Paraguay are not known; thus, this study primar-ily aims to fill this knowledge gap. The objective of this study was to assess the prevalence of RS and pulmonary TB among the indigenous population of Paraguay and to identify the major socio-economic factors associated with TB in this population.
SUBJECTS AND METHODS
The study group consisted of the indigenous popu-lation residing habitually or permanently in indigenous communities nationwide. Any person living in a com-munity for more than six months prior to the initial visit and who had not travelled outside the community for more than three of the previous six months was consid-ered a habitual resident of the community. The inclusion criteria were as follows: persons belonging to any indig-enous group in Paraguay, habitual residence within the selected communities, and voluntary verbal consent to participate in the survey.
The participants were interviewed in their homes by interviewers from the National Program for Tuber-culosis Control (NPTC) of Paraguay, using a structured questionnaire to collect the study data. A maximum of three visits was made. The questionnaire applied in the survey collected data on demographic, economic, and housing characteristics, as well as information on personal and family history of TB, access to health ser-vices, and TB-related symptoms. The survey was organ-ised in four sections: population characteristics, housing characteristics, prevalence of TB, and knowledge of TB.
A pilot test including 42 residents of the Jukyty indige-nous community (not included in the study) was performed before the commencement of the survey. The participants in this study were provided a special form of informed con-sent to request their agreement to participate in the inter-view, which ensured ethical safeguards in accordance with the principles established in the Declaration of Helsinki.
Individuals with RS were examined, and two sputum samples were collected following fasting. Direct bacillo-scopic examination was performed in the health services laboratories that attend this community, and culture ex-amination was performed in the central laboratory after storage and delivery according to the standards of the National Tuberculosis Control Program of Paraguay.
Sputum samples were sent to the laboratories located closest to the community. The fieldwork lasted seven weeks (October-December, 2012). The sampling design was mul-tistep, stratified with simple random sampling within the strata, with 94 communities selected from among 584 ex-isting indigenous communities. The sample size was based on a prevalence of 0.5%, absolute error of 0.1%, finite popu-lation of 117,528 inhabitants, and design effect of 1.5. Thus, the calculated sample size was 24,266 indigenous persons.
Individuals with RS were defined as those report-ing the presence of RS related to TB (a cough lastreport-ing three or more weeks, coughing up blood, chest pain, or pain when breathing or coughing). Pulmonary TB was defined as the presence of respiratory symptoms with a positive culture (Lowenstein-Jensen method).
A hierarchical Poisson regression analysis was per-formed to identify associated factors. The four levels (di-mensions) of the analysis and their respective independent variables were: (level 1) Individual characteristics - age (< 38 years or > 38 years), sex (male/female), education level
[Educación Escolar Básica (EEB) Level 1, 2, or ≥ level 3];
(level 2) living conditions and environmental characteris-tics - family history of TB (yes/no); type of housing; type of toilet (flush toilet/other); home heating type (none/some heating); access to a television (yes/no); ownership of horse, donkey, ox (yes/no); main cooking method (wood/ other); (level 3) sourcing of food - personal garden (yes/ no); hunting or fishing (yes/no); purchase of foods (yes/ no); receipt of donations (yes/no); and (level 4) type of nu-trition - vegetables (yes/no), cereals (yes/no), fruit (yes/ no), meat (yes/no), dairy products (yes/no). An “Ayoreo/ Manjui Ethnicity” variable was constructed, composed of the two ethnic groups with the highest prevalence of RS, and was included in the final multiple regression analysis.
The prevalence measures and their respective
confi-dence intervals [95% CI (conficonfi-dence interval)] were cal -culated. The prevalence ratio (PR) was calculated for the putative factors associated with RS. A simple Poisson regression was used to assess the individual effect of the independent variables on RS. Variables that were sig-nificant in the simple regression model (p < 0.20) were included in the respective multiple regression models. A multiple Poisson regression analysis was performed for each level, controlling for potential confounding vari-ables. Only significant variables (p < 0.05) for each of the models were incorporated into the final regression model. The final model included variables with a signifi-cance level of p < 0.05. All statistical procedures were performed using Stata version 11.0.
RESULTS
The interviewers visited 19 communities located across 13 departments. The survey included 24,352 people, 1,383 (5.7%) of whom had RS. Of these, 10 par-ticipants were culture-confirmed as having TB (41 per 100,000 inhabitants). The limited number of confirmed TB cases prevented the study of the associated factors.
Analysis of individual characteristics (level 1) revealed the highest frequency of RS among those of Ayoreo and
Manjui ethnicities (Table I). Persons aged 38 to 95 years and divorcees had the highest RS prevalence. The RS prevalence also differed according to the work status of the household head. The RS prevalence was higher among female sex and individuals with a higher education status and without a visible BCG scar (Table I).
TABLE I
Individual characteristics of the survey population, stratified according to respiratory symptoms (level 1), Paraguay, 2012
Respiratory symptomatic
p-value
No Yes Total
n (%) n (%) N (%)
Ethnic group
Aché 131 91,6 12 8,4 143 100
Angaité 600 96,3 23 3,7 623 100
Ava Guaraní 3936 95,9 170 4,1 4106 100
Ayoreo 731 79,3 191 20,7 922 100
Chamacoco Tomahoro 95 100 0 0 95 100
Chamacoco Yvytoso 858 96,7 29 3,3 887 100
Enxet 671 94,1 42 5,9 713 100
Guana 22 95,7 1 4,3 23 100
Guaraní Nandeva 445 96,1 18 3,9 463 100
Guaraní occidental 944 97,6 23 2,4 967 100
Lengua Enlhet Sur 2568 95,4 124 4,6 2692 100
Maká 784 95,7 35 4,3 819 100
Manjui 95 81,2 22 18,8 117 100
Mbya 1941 93,4 138 6,6 2079 100
Nivaclé 4347 93,7 291 6,3 4638 100
Páî-Tavyterâ 2712 93,4 191 6,6 2903 100
Sanapaná 280 97,2 8 2,8 288 100
Toba Maskoy 366 95,8 16 4,2 382 100
Toba-Qom 882 97,7 21 2,3 903 100
Total 22408 94,3 1355 5,7 23763 100 < 0.001
Age (year groups)
0-37 years 18490 95,4 881 4,6 19371 100
38-95 years 4487 89,9 502 10,1 4989 100
Total 22977 94,3 1383 5,7 23062 100 < 0.001
Sex
Male 11835 95,1 611 4,9 12446 100
Female 11080 93,5 771 6,5 11850 100
Total 22915 94,3 1382 5,7 24296 100 < 0.001
Civil status
Civil marriage 2471 92,3 205 7,7 2676 100
Traditional wedding 2538 92,3 211 7,7 2749 100
Separated 279 94,6 16 5,4 295 100
Divorced 11 78,6 3 21,4 14 100
Widower 379 84 72 16 451 100
Single 13295 95,4 645 4,6 13940 100
Cohabitation 3726 94,4 220 5,6 3946 100
Total 22699 94,3 1372 5,7 24071 100 < 0.001
Education level
Up to EEB 1° y 2° level 14088 94,8 768 5,2 14856 100
EEB 3° level or above 8889 93,5 615 6,5 9504 100
Total 22977 94,3 1383 5,7 24360 100 < 0.001
Household head work status
Salaried 1.123 93,7 76 6,3 1.199 100
Laborer 418 9,6 177 4,1 4.357 100
Self employed 16.161 93,9 1.053 6,1 17.214 100
None 1.449 95,1 75 4,9 1.524 100
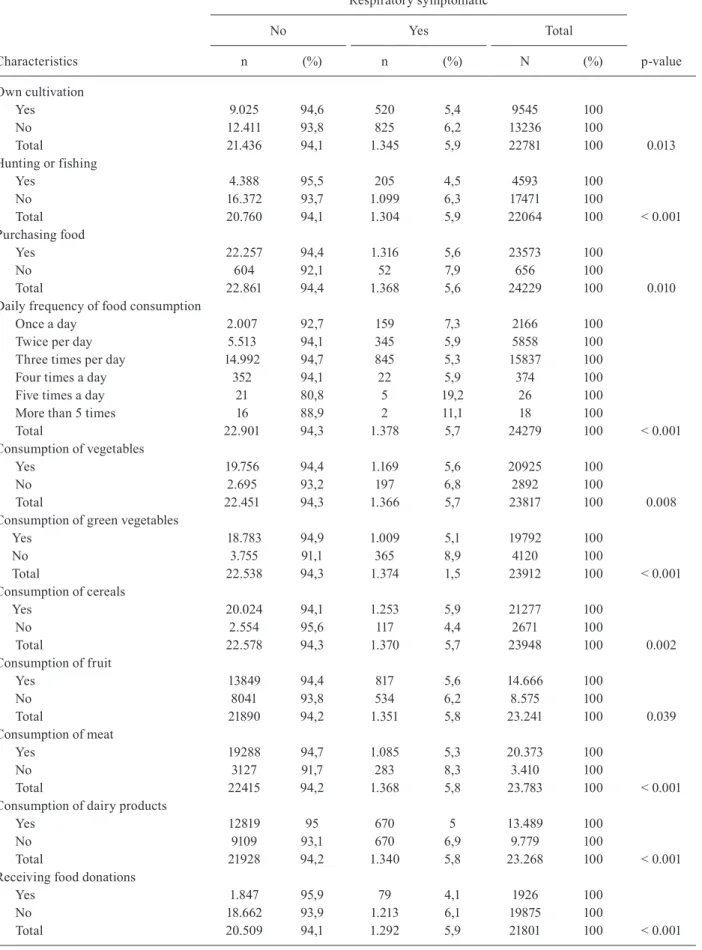
Analysis of the modes of obtaining food and diet (levels 3 and 4) revealed that individuals with their own gardens had fewer RS. Conversely, RS were more fre-quently observed among participants who did not eat vegetables, meat, dairy, or fruit as well as among those with higher consumption of grain (Table III).
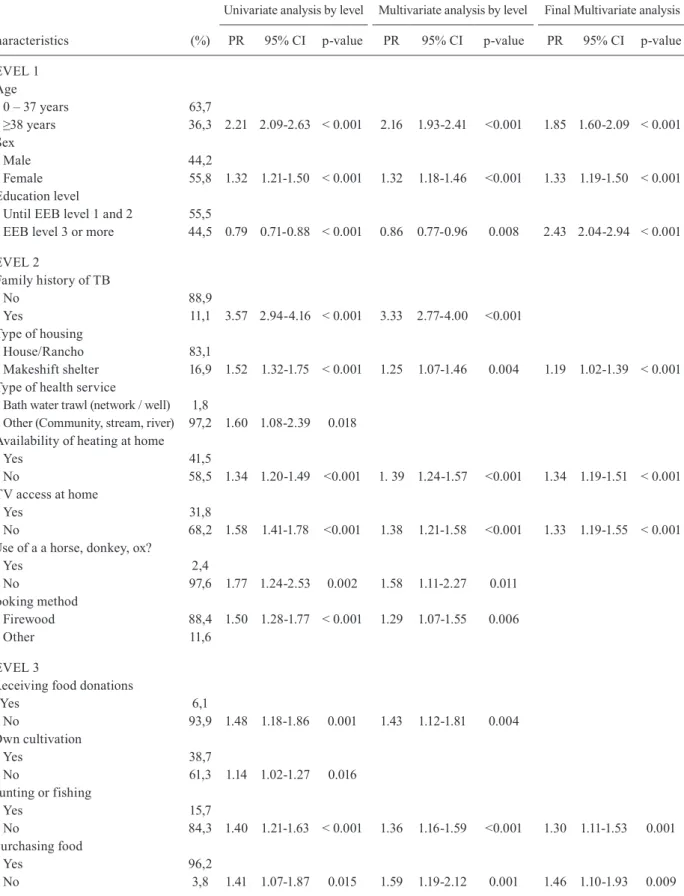
Univariate analysis showed that TB symptoms were associated with age, sex, educational level and family history of TB. Symptoms were also associated with the type of housing; availability of sanitary services; and the lack of a home heating system, personal garden, con-sumption of donated food and hunting or fishing, as well as the purchase of food. Diets without vegetables, meat and dairy, as well as the means used for cooking, were also positively associated with the presence of symptoms. Finally, diets that included cereals or fruit were also risk factors for the development of symptoms (Table IV).
The lack of a heating system and the use of a wood-fired stove increased the risk for RS. The lack of access to a television, means of transport by animal and donated food were associated with an increased risk of RS (Table IV).
The final hierarchical analysis (Table IV) showed that age > 37 years increased the risk of symptoms by nearly two-fold. Female sex and family history of TB were also risk factors. The following factors were as-sociated with an increased risk of RS: type of housing and home heating; not hunting or fishing; not purchasing food; and not consuming vegetables. Conversely, lack of grain consumption was a protective factor. Finally, be-longing to the Ayoreo or Manjui ethnic groups increased the risk of symptoms by three-fold.
DISCUSSION
The active identification of RS for the diagnosis of pulmonary TB is one of the most important tools from the perspective of public health. To our knowledge, this is the first study to estimate the prevalence of RS in an indigenous population in Paraguay and to address the burden of disease in this population.
The RS prevalence among indigenous communi-ties in Paraguay in this study was 5.7% (1,383 cases). A total of 10 cases of TB were found. These results are comparable to those of large-scale studies conducted in other Latin American countries. Peru has reported an RS prevalence of 5% among the general population (Col-lazos et al. 2010). The estimated RS prevalence rates in
two regions of Brazil are 5.7% and 4.8%, respectively (Freitas et al. 2011). Finally, Colombia reported an RS prevalence of 3.6% (García et al. 2004). The importance of these findings is that a significant proportion of respi-ratory symptomatic individuals may be pulmonary TB cases. In a study carried out in Vaupés (Colombia) to examine the prevalence of RS and TB and its associated factors, the prevalence of RS was 14.3%, with a 14-fold increase in the risk of TB in participants with RS (García et al. 2004). García et al. (2004) reported that the preva-lence of RS among the indigenous population was al-most twice that among non-indigenous persons. This ob-servation is consistent with a study in Colombia, which reported that indigenous populations are much more likely to develop TB than non-indigenous populations in the area due to their generally deficient nutritional states and overcrowded conditions (Henao et al. 1999). Simi-larly, we also observed that the indigenous population in the current study was at risk of having symptoms. Fur-thermore, the results of our study show that individuals of Ayoreo or Manjui ethnicity had more than three-fold increased risk of having symptoms.
The findings of our study also suggest that the indig-enous populations with RS suffer the worst deprivation, suggesting that RS prevalence is a multidimensional problem involving different factors related to individual characteristics, living conditions, social characteristics specific to the surrounding environment, type of nutri-tion and access to certain material goods. This is con-sistent with a study by Muniyandi et al. (2007), which observed a higher prevalence of RS and TB among pop-ulations exposed to greater poverty.
Living in makeshift homes, without a heating sys-tem and without a syssys-tem for cooking are criteria that increase the risk of symptoms. Most previous studies did not assess the association between these housing charac-teristics and the prevalence of RS within the community. However, our results are consistent with the findings of a study conducted in two cities in Colombia by Daza Ara-na (2013), which concluded that living in poor housing with inadequate ventilation and in homes with roofs pre-dominantly made of waste material were associated with an increased prevalence of RS (Moreno & Peña 2010). In addition, research conducted in Bucaramanga, Colom-bia (Nóbrega et al. 2010) found that RS was associated with households with no windows, with occupancies > 3 Respiratory symptomatic
p-value
No Yes Total
n (%) n (%) N (%)
Visible BCG scar
Yes 10810 92,5 876 7,5 11686 100
No 3398 91,3 324 8,7 3722 100
Total 14208 92,2 1200 11,6 15408 100 0,017
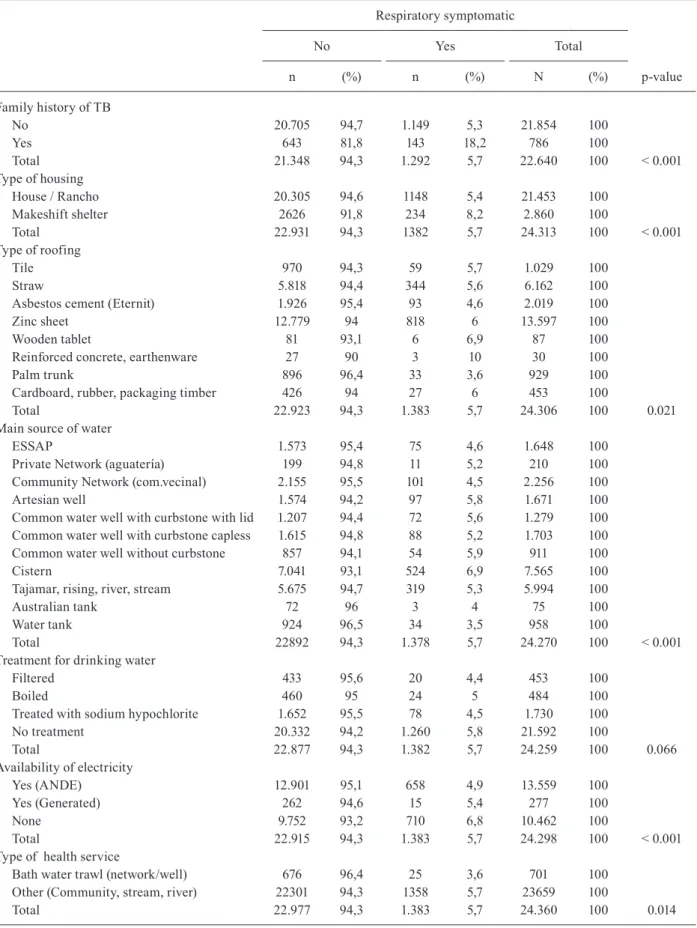
TABLE II
Living conditions and availability of goods and resources of the surveyed population, stratified according to respiratory symptoms (level 2), Paraguay, 2012
Respiratory symptomatic
p-value
No Yes Total
n (%) n (%) N (%)
Family history of TB
No 20.705 94,7 1.149 5,3 21.854 100
Yes 643 81,8 143 18,2 786 100
Total 21.348 94,3 1.292 5,7 22.640 100 < 0.001
Type of housing
House / Rancho 20.305 94,6 1148 5,4 21.453 100
Makeshift shelter 2626 91,8 234 8,2 2.860 100
Total 22.931 94,3 1382 5,7 24.313 100 < 0.001
Type of roofing
Tile 970 94,3 59 5,7 1.029 100
Straw 5.818 94,4 344 5,6 6.162 100
Asbestos cement (Eternit) 1.926 95,4 93 4,6 2.019 100
Zinc sheet 12.779 94 818 6 13.597 100
Wooden tablet 81 93,1 6 6,9 87 100
Reinforced concrete, earthenware 27 90 3 10 30 100
Palm trunk 896 96,4 33 3,6 929 100
Cardboard, rubber, packaging timber 426 94 27 6 453 100
Total 22.923 94,3 1.383 5,7 24.306 100 0.021
Main source of water
ESSAP 1.573 95,4 75 4,6 1.648 100
Private Network (aguatería) 199 94,8 11 5,2 210 100
Community Network (com.vecinal) 2.155 95,5 101 4,5 2.256 100
Artesian well 1.574 94,2 97 5,8 1.671 100
Common water well with curbstone with lid 1.207 94,4 72 5,6 1.279 100 Common water well with curbstone capless 1.615 94,8 88 5,2 1.703 100 Common water well without curbstone 857 94,1 54 5,9 911 100
Cistern 7.041 93,1 524 6,9 7.565 100
Tajamar, rising, river, stream 5.675 94,7 319 5,3 5.994 100
Australian tank 72 96 3 4 75 100
Water tank 924 96,5 34 3,5 958 100
Total 22892 94,3 1.378 5,7 24.270 100 < 0.001
Treatment for drinking water
Filtered 433 95,6 20 4,4 453 100
Boiled 460 95 24 5 484 100
Treated with sodium hypochlorite 1.652 95,5 78 4,5 1.730 100
No treatment 20.332 94,2 1.260 5,8 21.592 100
Total 22.877 94,3 1.382 5,7 24.259 100 0.066
Availability of electricity
Yes (ANDE) 12.901 95,1 658 4,9 13.559 100
Yes (Generated) 262 94,6 15 5,4 277 100
None 9.752 93,2 710 6,8 10.462 100
Total 22.915 94,3 1.383 5,7 24.298 100 < 0.001
Type of health service
Bath water trawl (network/well) 676 96,4 25 3,6 701 100
Other (Community, stream, river) 22301 94,3 1358 5,7 23659 100
Respiratory symptomatic
p-value
No Yes Total
n (%) n (%) N (%)
Type of waste disposal
Buried 1.142 95,6 53 4,4 1.195 100
burned 14.223 94,6 808 5,4 15.031 100
Thrown in water course 94 96,9 3 3,1 97 100
Thrown outdoors 3.752 92,1 324 7,9 4.076 100
Garbage collection 3.719 95,1 193 4,9 3.912 100
Total 22.930 94,3 1.381 5,7 24.311 100 < 0.001
Type of home heating
None 11650 93,5 809 6,5 12459 100
Other 11327 95,2 574 4,8 11901 100
Total 22977 94,3 1.383 5,7 24.360 100 <0.001
Cooking methods
Firewood 19096 94 1.222 6 20.318 100
Other 3881 96 161 4 4042 100
Total 22915 94,3 1.380 5,7 24.360 100 < 0.001
Access to a refrigerator
Yes 5.060 96 212 4 5.272 100
No 15.492 93,5 1.082 6,5 16.574 100
Total 20.552 94,1 1.294 5,9 21.846 100 < 0.001
Access to a kitchen
Yes 4.080 95,8 181 4,2 4.261 100
No 16.298 93,6 1.113 6,4 17.411 100
Total 20.378 94 1.294 6 21.672 100 < 0.001
Access to a cellphone
Yes 13.799 94,7 768 5,3 14.567 100
No 7.953 93,5 551 6,5 8.504 100
Total 21.752 94,3 1.319 5,7 23.071 100 < 0.001
Access to a TV
Yes 9.114 95,6 416 4,4 9.530 100
No 12.014 93,1 894 6,9 12.908 100
Total 21.128 94,2 1.310 5,8 22.438 100 < 0.001
Access to a radio
Yes 16.328 94,5 956 5,5 17.284 100
No 5.472 93,8 364 6,2 5.836 100
Total 21.800 94,3 1.320 5,7 23.120 100 0.044
Access to a computer or notebook
Yes 458 96,4 17 3,6 475 100
No 19.638 93,9 1.267 6,1 20.905 100
Total 20.096 94 1.284 6 21.380 100 0.024
Access to a car
Yes 434 97,3 12 2,7 446 100
No 19.621 93,9 1.269 6,1 20.890 100
Total 20.055 94 1.281 6 21.336 100 0.003
Access to a motorcycle
Yes 9.441 95,1 482 4,9 9.923 100
No 11.609 93,3 833 6,7 12.442 100
Total 21.050 94,1 1.315 5,9 22.365 100 < 0.001
Access to a horse, donkey, or ox
Yes 870 96,6 31 3,4 901 100
No 19.251 93,9 1.250 6,1 20.501 100
Respiratory symptomatic
p-value
No Yes Total
n (%) n (%) N (%)
Access to a bicycle
Yes 7.366 94 471 6 7.837 100
No 13.102 94,1 818 5,9 13.920 100
Total 20.468 94,1 1.289 5,9 21.757 100 0.689
Source: own elaboration.
people per room, and a floor predominantly made of ce-ment. This finding is consistent with the study by Krieg-er and Higgins, who reported that poor housing condi-tions were associated with health condicondi-tions, including the transmission of TB (Krieger & Higgins 2002).
Daza Arana (2013) concluded that the socioeconomic context influences the prevalence of RS and suggested that efficient methodologies of community-based re-search, based upon the specific characteristics of each territory, could be developed to further enhance the detec-tion of RS (Daza Arana 2013). The author also found that a moderate level of food insecurity was associated with a greater risk of RS. Henao et al. (1999) also found that poor diet was associated with RS. The results of our study relating to nutrition conditions indicate that participants lacking vegetables in their diet had an increased risk of RS, while the lack of consumption of cereals proved to be a protective factor for the development of symptoms. Our study examined a low-income population; this finding may reflect the prevalent type of diet in this population. An example of this is the finding that the proportion of participants with RS was higher among those who did not practice hunting or fishing to obtain nutrition.
Freitas et al. (2011) found that RS was associated with lower socioeconomic status, as indicated by the lower income level in this population. The increased risk of RS was also associated with a lower level of educa-tion. The authors suggested that populations with low socioeconomic status have less access to health services (Freitas et al. 2011). Socioeconomic status and educa-tional level may influence care seeking and attendance at health services. A study in Brazil found that barri-ers to access to health services in indigenous population influenced the presence of RS, as individuals were less likely to seek medical care (Nóbrega et al. 2010). In our study, the types of housing and home heating increased the risk of having symptoms. However, additional stud-ies are necessary to investigate how socioeconomic fac-tors contribute to increased incidence of RS.
The risk of RS among those with a family history of TB is indicative of disease transmission in this popula-tion. Moreover, after ethnic group, family history was the variable with the most significant impact on the increased risk of symptoms. Finally, in our study, fe-male sex and older age were associated with a higher prevalence of RS. However, other studies have reported
male sex to be a risk factor for RS. Our findings may be explained by the fact that the women in our study spent more time at home than did the men. In addition, indigenous women tend to minimise their symptoms and therefore delay seeking care (Thorson et al. 2004, WHO 2004). Women also act as the caregivers of the family, particularly for their children; because of their role in the household economy, women may consider the health of other household members before their own, as well as prioritising the family economy above any personal expenses. The finding of age as a risk factor is consis-tent with previous research (García et al. 2004). In this sense, the results of our study are consistent with other evidence suggesting that the risk of respiratory symp-toms and developing TB increases with age.
Considering the small number of confirmed TB cases and the indicators of sensitivity and specificity, it is worth studying the factors. A systematic review of the sensitivity and specificity of questioning individu-als regarding the presence of symptoms for the detection of bacteriologically confirmed active pulmonary TB in HIV-negative persons and persons with unknown HIV status considered eligible for TB screening revealed eight studies that provided data on ‘any TB symptom’ as a screen for symptomatic status. The number and dura-tion of each symptom that qualified as a positive sta-tus differed across studies, ranging from four to eight symptoms. Cough, haemoptysis, fever, night sweats and weight loss were the most common (Tollefson et al. 2013). Thus, the results of our study are consistent with those of previous analyses, confirming that the presence of various symptoms in RS, particularly cough lasting three or more weeks, was the most frequent symptom.
This study has several limitations. In view of the small number of TB cases detected, it was not possible to examine the socioeconomic factors associated with TB. In addition, due to the complexity of the fieldwork and process of data collection in these communities, there was some loss of information and missing data. Howev-er, this does not imply a non-response bias in our study.
re-TABLE III
Mode of obtaining food (level 3) and type of feeding (level 4), Paraguay, 2012
Characteristics
Respiratory symptomatic
p-value
No Yes Total
n (%) n (%) N (%)
Own cultivation
Yes 9.025 94,6 520 5,4 9545 100
No 12.411 93,8 825 6,2 13236 100
Total 21.436 94,1 1.345 5,9 22781 100 0.013
Hunting or fishing
Yes 4.388 95,5 205 4,5 4593 100
No 16.372 93,7 1.099 6,3 17471 100
Total 20.760 94,1 1.304 5,9 22064 100 < 0.001
Purchasing food
Yes 22.257 94,4 1.316 5,6 23573 100
No 604 92,1 52 7,9 656 100
Total 22.861 94,4 1.368 5,6 24229 100 0.010
Daily frequency of food consumption
Once a day 2.007 92,7 159 7,3 2166 100
Twice per day 5.513 94,1 345 5,9 5858 100
Three times per day 14.992 94,7 845 5,3 15837 100
Four times a day 352 94,1 22 5,9 374 100
Five times a day 21 80,8 5 19,2 26 100
More than 5 times 16 88,9 2 11,1 18 100
Total 22.901 94,3 1.378 5,7 24279 100 < 0.001
Consumption of vegetables
Yes 19.756 94,4 1.169 5,6 20925 100
No 2.695 93,2 197 6,8 2892 100
Total 22.451 94,3 1.366 5,7 23817 100 0.008
Consumption of green vegetables
Yes 18.783 94,9 1.009 5,1 19792 100
No 3.755 91,1 365 8,9 4120 100
Total 22.538 94,3 1.374 1,5 23912 100 < 0.001
Consumption of cereals
Yes 20.024 94,1 1.253 5,9 21277 100
No 2.554 95,6 117 4,4 2671 100
Total 22.578 94,3 1.370 5,7 23948 100 0.002
Consumption of fruit
Yes 13849 94,4 817 5,6 14.666 100
No 8041 93,8 534 6,2 8.575 100
Total 21890 94,2 1.351 5,8 23.241 100 0.039
Consumption of meat
Yes 19288 94,7 1.085 5,3 20.373 100
No 3127 91,7 283 8,3 3.410 100
Total 22415 94,2 1.368 5,8 23.783 100 < 0.001
Consumption of dairy products
Yes 12819 95 670 5 13.489 100
No 9109 93,1 670 6,9 9.779 100
Total 21928 94,2 1.340 5,8 23.268 100 < 0.001
Receiving food donations
Yes 1.847 95,9 79 4,1 1926 100
No 18.662 93,9 1.213 6,1 19875 100
Total 20.509 94,1 1.292 5,9 21801 100 < 0.001
TABLE IV
Univariate and multivariate analysis of the characteristics associated with the prevalence of respiratory symptoms among the indigenous population of Paraguay, by level and hierarchical final model
Characteristics (%)
Univariate analysis by level Multivariate analysis by level Final Multivariate analysis
PR 95% CI p-value PR 95% CI p-value PR 95% CI p-value
LEVEL 1 Age
0 – 37 years 63,7
≥38 years 36,3 2.21 2.09-2.63 < 0.001 2.16 1.93-2.41 <0.001 1.85 1.60-2.09 < 0.001 Sex
Male 44,2
Female 55,8 1.32 1.21-1.50 < 0.001 1.32 1.18-1.46 <0.001 1.33 1.19-1.50 < 0.001 Education level
Until EEB level 1 and 2 55,5
EEB level 3 or more 44,5 0.79 0.71-0.88 < 0.001 0.86 0.77-0.96 0.008 2.43 2.04-2.94 < 0.001
LEVEL 2
Family history of TB
No 88,9
Yes 11,1 3.57 2.94-4.16 < 0.001 3.33 2.77-4.00 <0.001 Type of housing
House/Rancho 83,1
Makeshift shelter 16,9 1.52 1.32-1.75 < 0.001 1.25 1.07-1.46 0.004 1.19 1.02-1.39 < 0.001 Type of health service
Bath water trawl (network / well) 1,8
Other (Community, stream, river) 97,2 1.60 1.08-2.39 0.018 Availability of heating at home
Yes 41,5
No 58,5 1.34 1.20-1.49 <0.001 1. 39 1.24-1.57 <0.001 1.34 1.19-1.51 < 0.001 TV access at home
Yes 31,8
No 68,2 1.58 1.41-1.78 <0.001 1.38 1.21-1.58 <0.001 1.33 1.19-1.55 < 0.001 Use of a a horse, donkey, ox?
Yes 2,4
No 97,6 1.77 1.24-2.53 0.002 1.58 1.11-2.27 0.011
Cooking method
Firewood 88,4 1.50 1.28-1.77 < 0.001 1.29 1.07-1.55 0.006
Other 11,6
LEVEL 3
Receiving food donations
Yes 6,1
No 93,9 1.48 1.18-1.86 0.001 1.43 1.12-1.81 0.004
Own cultivation
Yes 38,7
No 61,3 1.14 1.02-1.27 0.016
Hunting or fishing
Yes 15,7
No 84,3 1.40 1.21-1.63 < 0.001 1.36 1.16-1.59 <0.001 1.30 1.11-1.53 0.001 Purchasing food
Yes 96,2
Characteristics (%)
Univariate analysis by level Multivariate analysis by level Final Multivariate analysis
PR 95% CI p-value PR 95% CI p-value PR 95% CI p-value
LEVEL 4
Consumption of green vegetables
Yes 0,3
No 99,7 1.73 1.54-1.95 < 0.001 1.63 1.42-1.86 <0.001 1.22 1.07-1.74 0.003 Consumption of cereals
Yes 91,5
No 8,5 0.74 0.61-0.89 0.003 0.69 0.57-0.84 <0.001 0.72 0.59-0.89 0.001 Consumption of fruit
Yes 60,5
No 39,5 1.11 1.01-1.24 0.045 0.82 0.72-0.94 0.004
Consumption of meat
Yes 79,3
No 23,6 1.55 1.36-1.77 < 0.001 1.38 1.19-1.60 <0.001 Consumption of dairy products
Yes 50
No 50 1.37 1.23-1.53 < 0.001 1.22 1.08-1.39 0.001 Etnia Ayoreo/Manjui
No 84,6
Yes 15,4 3.25 2.75-3.85 < 0.001
CI: confidence interval. Source: own elaboration.
search is needed in order to better understand the associa-tion between the prevalence of RS, the underlying social and economic context, and the individual characteristics of participants, as well as to evaluate the relative contribution of each of these factors with the increased prevalence of RS among indigenous populations in Paraguay.
In conclusion, the findings of our study indicate that individual factors, dietary habits, and ethnic groups were associated with an increased prevalence of RS among indigenous populations in Paraguay. The detection of symptoms could enable the identification of targeted ac-tions, optimisation of resources, and elaboration of long and short-term policies to reduce the prevalence of TB and contribute to disease control. Finally, the ethnic groups with higher prevalence are not explained by the current lit-erature but offer a valuable finding for later investigations to elucidate why the RS differ in these indigenous groups.
ACKNOWLEDGEMENTS
To the Tuberculosis Control Program of Paraguay, to Breanne Nicole Lesnar, for her invaluable contribution in the translation of this paper, and to all of the participants for shar-ing their stories and makshar-ing this study possible.
AUTHORS’ CONTRIBUTION
SA, CM, GCC, NG and MA - Responsible for the final re-view of the protocol design and the writing of the manuscript; MBH - participated in the protocol design, data analysis and responsible for the manuscript preparation; JUB - participated in the protocol design, data analysis and writing of the manu-script, mainly responsible for the final manuscript review.
REFERENCES
AFN - Assembly of First Nations. A global indigenous peoples’. In-itiative to Stop TB: our children, our future. Assembly of First Nations Inuit Tapiriit Kanatami. Toronto: 2009; 17 pp.
Barry C, Konstantinos A. Tuberculosis notifications in Australia, 2007. Commun Dis Intell Q Rep. 2009; 33(3): 304-15.
CDC - Centers for Disease Control. Decrease in reported tuberculosis cases - United States, 2009. MMWR Morb Mortal Wkly Rep. 2010; 59(10): 289-94.
Collazos C, Carrasquilla G, Ibáñez M, López LE. Prevalencia de sin-tomáticos respiratorios en instituciones prestadoras de servicios de salud de Bogotá, D.C., junio de 2005 a marzo de 2006. Bio-medica. 2010; 30(4): 519-29.
Culqui DR, Trujillo OV, Cueva N, Aylas R, Salaverry O, Bonilla C. Tuberculosis en la población indígena del Perú 2008. Rev Peru Med Exp Salud Publica. 2010, 27(1): 278-315.
Das D, Baker M, Calder L. Tuberculosis epidemiology in New Zea-land: 1995-2004. N Z Med J. 2006; 119(1243): U2249.
Daza Arana JE. Prevalencia de sintomáticos respiratorios y factores relacionados en los residentes de dos territorios vulnerables de la
ciudad de Santiago de Cali, año 2012 [Tesis de Maestria]. Cali:
Universidad del Valle; 2013.
DGEEC - Dirección General de Estadística, Encuestas y Censos. II
Censo Nacional Indígena 2002 [homepage on the Internet]. 2012
Available from: http://www.dgeec.gov.py/Publicaciones/Biblio-teca/censo indigena 2012/Pueblos indigenas en el Paraguay Re-sultados preliminares.
Fitzgerald JM, Wang L, Elwood RK. Tuberculosis: 13. Control of the disease among aboriginal people in Canada. CMAJ. 2000; 162(3): 351-5.
Freitas FTM, Yokota RTC, Castro APB, Andrade SSCA, Nascimento GL, Moura NFO, et al. Prevalência de sintomáticos respiratórios em regiões do Distrito Federal, Brasil. Rev Panam Salud Publica. 2011; 29(6): 451-6.
García I, De la Hoz F, Reyes Y, Montoya P, Guerrero MI, León CI. Prevalencia de sintomáticos respiratorios, de infección y enferme-dad tuberculosa y factores asociados: estudio basado en población, Mitú, Vaupés, 2001. Biomedica. 2004; 24(Suppl. 1): 124-31.
Hargreaves JR, Boccia D, Evans CA, Adato M, Petticrew M, Porter JD. The social determinants of tuberculosis: from evidence to ac-tion. Am J Public Health. 2011; 101(4): 654-62.
Henao G, De la Hoz F, León C, Ribón W, Guerrero M. Epidemiología clásica y molecular de la tuberculosis en el Guaviare 1997-1998. Informe Quincenal Epidemiológico Nacional. 1999; 4: 85-91.
Hoeppner VH, Marciniuk DD. Tuberculosis in aboriginal Canadians. Can Respir J. 2000; 7(2): 141-6.
Krieger J, Higgins DL. Housing and health: time again for public health action. Am J Public Health. 2002; 92(5): 758-68.
Lopez PA, Fernández PV, Morel IM. Prevalencia de tuberculosis en indígenas del departamento de Itapúa. Asunción. 2013.
Moreno LL, Peña CET. Prevalencia de sintomáticos respiratorios y tuberculosis en la población en condición de desplazamiento, Bu-caramanga, 2007. MedUNAB. 2010; 13(2): 75-80.
Muniyandi M, Ramachandran R, Gopi PG, Chandrasekaran V, Sub-ramani R, Sadacharam K, et al. The prevalence of tuberculosis in different economic strata: a community survey from South India. Int J Tuberc Lung Dis. 2007; 11(9): 1042-5.
Nóbrega RG, Nogueira JA, Netto AR, Sá LD, Silva ATMC, Villa TCS. The active search for respiratory symptomatics for the con-trol of tuberculosis in the Potiguara indigenous scenario, Paraíba, Brazil. Rev Lat Am Enfermagem. 2010; 18: 1169-76.
Thorson A, Hoa NP, Long NH, Allebeck P, Diwan VK. Do women with tuberculosis have a lower likelihood of getting diagnosed? Prevalence and case detection of sputum smear positive pulmo-nary TB, a population-based study from Vietnam. J Clin Epide-miol. 2004; 57(4): 398-402.
Tollefson D, Bloss E, Fanning A, Redd JT, Barker K, McCray E. Bur-den of tuberculosis in indigenous peoples globally: a systematic review. Int J Tuberc Lung Dis. 2013; 17(9): 1139-50.
UN - United Nations. State of the world’s indigenous peoples. New York: 2012.