INTRODUCTION
Growth can be studied from at least three interre-lated perspectives: dimensional, compositional and func-tional (Reeds and Fiorotto, 1990). From the dimensional viewpoint, the term growth refers to an increase in some measure of size (height, length, weight) with age. These different types of size-age relationships are typically de-scribed by fitting experimental data to the appropriate mathematical model, frequently using nonlinear regres-sion techniques. This approach condenses the numerical information included in the longitudinal data set into a few biologically interpretable parameters.
Among the different mathematical models available for fitting growth curves, perhaps the most extensively used in mice are the special cases of Richards function (Richards, 1959): logistic (Monteiro and Falconer, 1966), Gompertz (Laird and Howard, 1967) and von Bertalanffy (Gall and Kyle, 1968). Two of the three parameters yielded by these models, asymptotic size and maturing rate, have particu-lar importance because of their usefulness in describing the shape of a growth curve (Fitzhugh, 1976).
In some situations of primary production, certain growth patterns may be more desirable than others (Tallis, 1968), and any particular advantageous pattern can generally be expressed in terms of the two aforementioned parameters. In meat animals for example, a profitable model should combine a rapid, early body weight gain and a small mature body size, as seen in beef cattle (Dickerson, 1976) and poultry (Grossman and Bohren, 1985).
The relevance of animal breeding research with
labo-ratory mice to farm animals is nowadays widely accepted (Roberts, 1965; Malik, 1984). Although these mouse mod-els cannot be expected to be exact modmod-els of similar phe-nomena in livestock, they can be valuable for studying the biochemical and physiological determinants of growth, leading to a better understanding of growth biology.
Artificial selection for growth rate or body weight in laboratory rodents has usually been effective in bring-ing about noticeable changes in mature weight. However, since the larger the mature size of a mammal, the longer it tends to take to mature (Taylor, 1965), comparisons of growth traits between animals of the same chrono-logical age but of different mature sizes could result in misleading conclusions because of differences in physi-ological age.
We examined the growth pattern of four lines of mice artificially selected for different body conformations, and with different adult sizes. The relationship between asymp-totic weight and maturing rate for body weight was stud-ied in order to provide baseline information about their interaction and because of the relevance of these param-eters for growth studies.
MATERIAL AND METHODS
Body conformation index
The mice used in this experiment (CBi+, CBi-, CBi/C and CBi/L) were selected for body conformation at 49 days of age (Di Masso et al., 1991a) by means of an index which combines body weight and tail length, two positively
corre-Asymptotic weight and maturing rate in mice selected for body conformation
Ricardo J. Di Masso, Patricia S. Silva and María Teresa Font
Abstract
Growth patterns of four lines of mice selected for body conformation were analyzed with the logistic function, in order to provide baseline information about the relationship between asymptotic weight and maturing rate of body weight. Two lines were divergently selected favoring the phenotypic correlation between body weight and tail length (agonistic selection: CBi+, high body weight and long tail; CBi-, low body weight and short tail), whereas the other two lines were generated by a disruptive selection performed against the correlation between the aforementioned traits (antagonistic selection: CBi/C, high body weight and short tail; CBi/L, low body weight and long tail). The logistic parameters A (asymptotic weight) and k (maturing rate) behaved in CBi/C and CBi- mice and in CBi+ females as expected in terms of the negative genetic relationship between mature size and earliness of maturing. An altered growth pattern was found in CBi/ L mice and in CBi+ males, because in the former genotype, selected for low body weight, the time taken to mature increased, whereas in the latter, selected for high body weight, there was a non-significant increase in the same trait. In accordance with the selective criterion, different sources of genetic variation for body weight could be exploited: one inversely associated with earliness of maturing (agonistic selection), and the other independent of maturing rate (antagonistic selection), showing that genetic variation of A is partly independent of k.
lated traits (rP = 0.56, rG = 0.60) in the base population stock
(CBi). This index was constructed as follows:
I = [(Xi - x) / SX] ± [(Yi - y) / SY]
where Xi and Yi are the individual scores for body weight and tail length, respectively, x and y are the base popula-tion means, and SX and SY are the phenotypic standard de-viations of each character. Both terms of the index were either added or subtracted to differentiate between the two procedures applied. Two lines were divergently selected favoring the aforementioned phenotypic correlation (ago-nistic selection: CBi+, high body weight and long tail; CBi-, low body weight and short tail), whereas the other two were obtained by a disruptive selection performed against the correlation between body weight and tail length (antagonistic selection: CBi/C, high body weight and short tail; CBi/L, low body weight and long tail). Mice from CBi stock were used as controls. Since tail length was used as an estimator of skeletal length (Baker and Cockrem, 1970; Hetzel and Nicholas, 1986), the four se-lected lines presented different biomass per unit of skel-eton weight ratios (Di Masso et al., 1991b, 1998), show-ing different body conformations. The agonistic selection generated two lines with different shapes, since CBi+ had increased body weight and tail length, whereas both traits decreased in CBi-. Genotypes from the antagonistic se-lection experiment showed different forms with increas-ing body weight and decreasincreas-ing tail length in CBi/C, and decreasing body weight and increasing tail length in CBi/ L. These genotypes also differ in the pattern of fat depo-sition (Trumper et al., 1989, Di Masso et al., 1992), in the humoral immune response to sheep red blood cells (Scharovsky et al., 1991) and in bone biomechanics (Di Masso et al., 1997).
Animals
Mice belonging to litters randomly standardized at one day of age, to yield eight pups with a 1:1 sex ratio, were weaned at three weeks of age, individually marked using ear notching and assigned, eight individuals of the same sex, to standard polypropylene cages (32 x 24 x 10 cm) with wood shavings for bedding. Animals (16 per geno-type-sex subgroup) were housed contemporaneously in the same breeding room, kept at 23 ± 1ºC with alternate 12-h light/dark periods. Pelleted food (Aliper Lab. Chow) and water were provided ad libitum. Individual body weights were recorded to the nearest tenth of a gram, weekly from weaning to 17 weeks of age.
Curve fitting
A nonlinear estimation procedure (GraphPad Prism Software, Version 2.0) based on Marquardt’s algorithm (Marquardt, 1963) was used to fit the experimental
indi-vidual weight-age data with a reparameterized form of the logistic function (Dieulefait, 1932) W(t) = A/{1 + exp[(k
-t)/b]}, to estimate A and k, the asymptotic value of size as t→∞, interpreted as average size (weight) at maturity, and the maturing rate of the curve (i.e., the relative rate at which A is attained), respectively. In this particular reparameterized version, k is the age at the inflexion point and, since the logistic curve is symmetrical, it represents the time taken to reach 50% of the mature body weight (A).
Statistical analysis
Goodness of fit was evaluated by the coefficient of multiple determination (R2), and also judged by the
signifi-cance of the tests performed to verify the random distribu-tion of the residuals. For statistical analysis, asymptotic weight (A) and maturing rate for body weight (k) were treated as metric traits. Since in mice sexes almost always show quite different growth patterns (Timon and Eisen, 1969; Eisen, 1976; Koops et al., 1987; Kastelic et al., 1996), males and females were treated separately after demonstrat-ing a nonsignificant genotype x sex interaction effect. Dif-ferences in asymptotic weight and maturing rate among genotypes within the selection procedure were assessed by one way analysis of variance (Sokal and Rohlf, 1969).
RESULTS
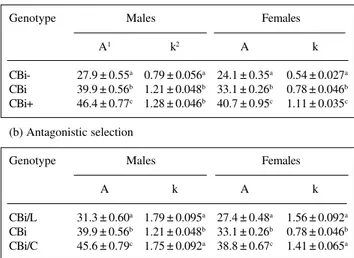
In both sexes, mice with positive selection for body weight (CBi/C and CBi+) were heavier than controls, whereas lines selected for low body weight (CBi/L and CBi-) were lighter than CBi (Table I). Although not shown, there was good agreement between actual weights and the
Table I - Mean ± standard error nonlinear least-squares estimates of logistic growth curve parameters: mature weight (A) and maturing rate (k).
(a) Agonistic selection
Genotype Males Females
A1 k2 A k
CBi- 27.9 ± 0.55a 0.79 ± 0.056a 24.1 ± 0.35a 0.54 ± 0.027a
CBi 39.9 ± 0.56b 1.21 ± 0.048b 33.1 ± 0.26b 0.78 ± 0.046b
CBi+ 46.4 ± 0.77c 1.28 ± 0.046b 40.7 ± 0.95c 1.11 ± 0.035c
(b) Antagonistic selection
Genotype Males Females
A k A k
CBi/L 31.3 ± 0.60a 1.79 ± 0.095a 27.4 ± 0.48a 1.56 ± 0.092a
CBi 39.9 ± 0.56b 1.21 ± 0.048b 33.1 ± 0.26b 0.78 ± 0.046b
CBi/C 45.6 ± 0.79c 1.75 ± 0.092a 38.8 ± 0.67c 1.41 ± 0.065a
Units of measure: 1grams - 2weeks after weaning. a,b,cValues with different
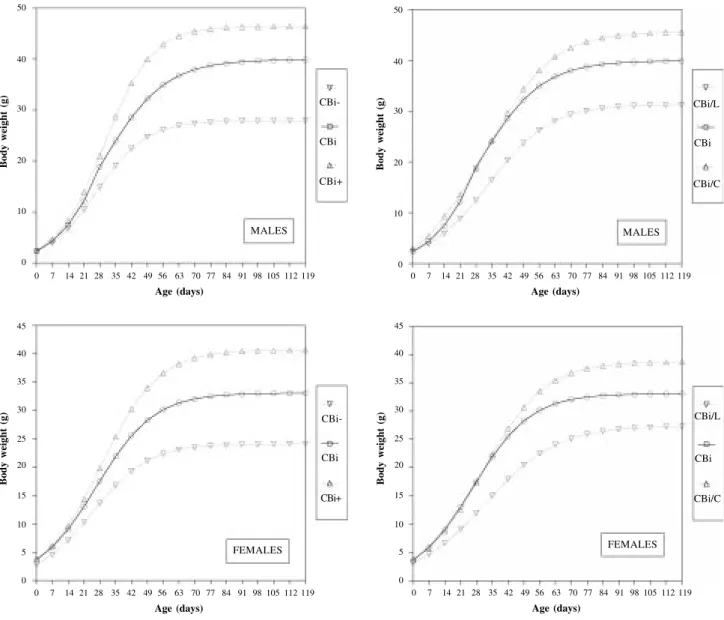
theoretical points of the fitted curves (R2 values ranged
from 0.963 to 0.982 for the different data set). There were obvious differences in growth patterns between agonistic and antagonistic selection groups, the former showing a more symmetrical response with respect to the control line (Figure 1).
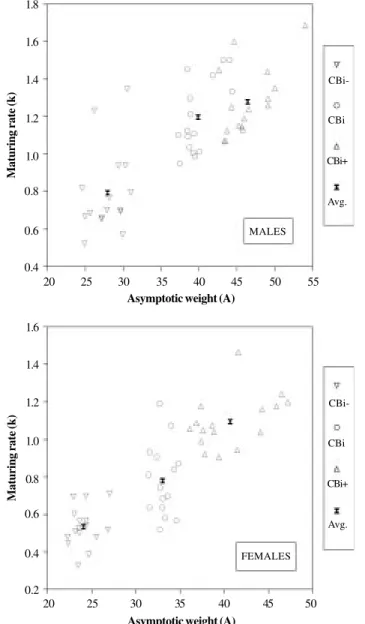
When selection was made favoring the phenotypic correlation between body weight and tail length (agonis-tic selection), maturing rate for body weight was nega-tively associated with mature body weight (since k repre-sents the abscissa of the inflexion point, a positive rela-tion between A and k indicates a negative relarela-tionship be-tween mature size and time taken to mature). Therefore, CBi+ mice were heavier and later maturing than CBi-, and control animals (CBi) had intermediate values (Figure 2). In contrast, this behavior was not evidenced when selec-tion was performed against the phenotypic correlaselec-tion
between body weight and tail length (antagonistic selec-tion). CBi/C mice were heavier and later maturing than controls; CBi/L males and females, although significantly lighter at maturity than the other two genotypes, had ma-turing rate values similar to CBi/C (Figure 3).
DISCUSSION
Changes in the shape of a growth curve are basically determined by the degree of genetic independence between its parameters (Fitzhugh, 1976). Several researchers have provided direct or indirect experimental evidence of the partially independent genetic control of mature weight and time taken to mature in different species. In mice, for ex-ample, Roberts (1965) observed that two lines positively selected for six-week body weight achieved the same as-ymptotic weight but at different ages, while Timon and
Figure 1 - Estimated mean body weights of mice selected for body conformation, as a function of age. (Left: Agonistic selection, Right: antagonistic selection). 50
40
30
20
10
0
0 7 14 21 28 35 42 49 56 63 70 77 84 91 98 105 112 119
MALES
CBi/L
CBi
CBi/C
Age (days)
Body weight (g)
45
40
35
10
5
0
0 7 14 21 28 35 42 49 56 63 70 77 84 91 98 105 112 119
FEMALES
CBi/L
CBi
CBi/C
Age (days)
Body weight (g)
15 30
25
20 50
40
30
20
10
0
0 7 14 21 28 35 42 49 56 63 70 77 84 91 98 105 112 119
MALES
CBi-CBi
CBi+
Age (days)
Body weight (g)
45
40
35
10
5
0
0 7 14 21 28 35 42 49 56 63 70 77 84 91 98 105 112 119
FEMALES
CBi-CBi
CBi+
Age (days)
Body weight (g)
15 30
25
Eisen (1969), as a general conclusion from a study of the heritabilities and genetic correlations among parameters of the Richards and logistic growth functions, argued that direct selection for a change in the shape of the growth curve would be at least moderately successful. In poultry, Ricard (1975) showed the feasibility of modifying the tra-jectory of the growth curve of chickens by selecting for antagonistic combinations of body weights at different ages. Brown et al. (1972) found different proportions of maturing rate to be independent of asymptotic weight in beef cattle.
The behavior of the logistic parameters observed in both sexes in CBi/C and CBi- mice, and in CBi+ females confirms the general positive relationship between asymp-totic weight and time taken to mature described for
com-parisons within (Taylor, 1968) and between (Taylor, 1965) species. This behavior could be ascribed to the expected response to selection for body weight, as animals geneti-cally heavier at maturity tend to take longer to mature and vice versa (Taylor and Fitzhugh, 1971). In contrast, this expected correlated response was not observed in CBi/L mice or CBi+ males. These animals showed an altered growth pattern resulting from a decrease in maturing rate in a genotype that had a lowered mature size (CBi/L) and a nonsignificant decrease of the same trait in a genotype (CBi+) that had increased asymptotic weight.
The results herein described show some similarities with those observed in mice selected for different com-binations of body weights at two ages (lines H10, L5 R10 and R5 H10; McCarthy and Doolittle, 1977), whose growth Figure 2 - Scatter diagram of maturing rate for body weight (k), plotted
against asymptotic body weight (A). Agonistic selection.
Figure 3 - Scatter diagram of maturing rate for body weight (k), plotted against asymptotic body weight (A). Antagonistic selection.
0.4
MALES
CBi-CBi
CBi+
Maturing rate (k)
Avg.
0.6 0.8 1.0 1.2 1.4 1.6 1.8
20 25 30 35 40 45 50 55
Asymptotic weight (A)
0.2
FEMALES
CBi-CBi
CBi+
Maturing rate (k)
Avg.
0.4 0.6 0.8 1.0 1.2 1.4 1.6
20 25 30 35 40 45 50
Asymptotic weight (A)
0.8
MALES
CBi/L
CBi
CBi/C
Maturing rate (k)
Avg.
1.0 1.2 1.4 1.6 1.8 2.4 2.6
25 30 35 40 45 50 55
Asymptotic weight (A) 2.2
2.0
0.4
FEMALES
CBi/L
CBi
CBi/C
Maturing rate (k)
Avg.
0.6 0.8 1.0 1.2 1.4 2.0 2.2
20 25 30 35 40 45
Asymptotic weight (A) 1.8
patterns were described by McCarthy and Bakker (1979). CBi+ males selected for high body weight at seven weeks had increased asymptotic weight without significantly al-tering the maturing rate as occurred in line H10, selected for high body weight at 10 weeks. Line L5 R10, selected for low body weight at five weeks, without altering body weight at 10 weeks, showed the same response as CBi/L: a lower asymptotic weight and also, a lower maturing rate than con-trols; in contrast, line R5 H10, selected for high body weight at 10 weeks without altering body weight at five weeks, had increased its asymptotic weight and decreased matur-ing rate much like CBi/C mice did. From this evidence, an analogy between both selection experiments could be made. CBi/L mice selected for low body weight and long tail at 49 days of age showed diminished body weight at five weeks but maintained the length of the tail character-istic of a 10-week-old mouse. Conversely, CBi/C mice selected for high body weight and short tail at 49 days of age had increased body weight at 10 weeks but maintained a tail length appropriate for a five-week-old-mouse.
Fitzhugh (1976) proposed that artificial selection for the ratio between a late maturing trait like body weight and an early maturing trait, represented in this case by tail length, should decrease age of maturing and decrease ma-ture size for both characters. In our experiment, animals were not selected by a ratio but by a linear index. This is similar to McCarthy’s lines, but combines two traits with different earliness of maturing, and although the animals were not selected for the combination of traits at differ-ent ages, the use of two characters differing in maturing rate would parallel this situation. This criterion would per-mit exploitation of different sources of genetic variation for body weight, one inversely associated with earliness of maturing (agonistic selection), and the other indepen-dent of maturing rate (antagonistic selection). Recently, Archer et al. (1998) found a lack of significant responses in maturation rate, in spite of differences in mature size when correlated responses of rate of maturation in Angus cattle divergently selected for yearling growth rate were analyzed. They argued that their results contradicted the observation that higher mature weights were related to lower maturation rates within a breed, and concluded that such experimental evidence does not support the dogma that selection for high growth rate leads to later maturing indi-viduals. Evidently both aforementioned sources of genetic variation for growth would also be evident in beef cattle.
Although the genetic correlation between mature weight and maturing rate was not estimated in the present study, its value would be low enough not to restrain a re-sponse that permits a modification of the growth trajec-tory. This response could, for example, be one of the de-sirable patterns associated with a more profitable produc-tive strategy. In this sense, it appears that genetic variation in A is partially independent of k.
In general terms, growth defined by mathematical models has definite advantages over point evaluations
con-fined to constant ages, constant time periods or constant weight periods, since this approach provides parameters that can describe lifetime growth biologically. Optimum mature size and strategies for improving the bioenergetic efficiency of body-weight growth in beef animals depend on an understanding of how to manipulate genetic and en-vironmental factors to control average lifetime rates of growth and maturing independently of mature weight. The selected lines of mice used in this experiment could be a useful model for the study of the relationship between ma-ture weight, maturing rate and different associated growth traits like feeding efficiency and body composition, since comparisons between genotypes with different mature weights and with similar (CBi/C, CBi/L) or different (CBi+, CBi-) maturing rates could be performed.
ACKNOWLEDGMENTS
The authors thank Mrs. Fabiana Severino for expert care and breeding of the mice.
RESUMO
Padrões de crescimento de 4 linhagens de camundongos selecionados para a conformação do corpo foram analisadas com a função logística, de modo a se obterem informações basais a respeito da relação entre o peso assintótico e a taxa de maturação do peso corporal. Duas linhagens foram selecionadas divergen-temente, favorecendo a correlação fenotípica entre o peso cor-poral e o comprimento da cauda (seleção agonística: CBi+, peso corporal elevado e cauda longa; CBi-, peso corporal reduzido e cauda curta), enquanto que as outras duas linhagens foram geradas por uma seleção disruptiva feita contra a correlação entre os caracteres acima citados (seleção antagonística: CBi/C, peso cor-poral elevado e cauda curta; CBi/L, peso corcor-poral reduzido e cauda longa). Os parâmetros logísticos A (peso assintótico) e k (taxa de maturação) comportaram-se em camundongos CBi/C e CBi- e em fêmeas CBi+ conforme esperado, em termos da relação genética negativa entre o tamanho maduro e a precocidade de maturação. Um padrão alterado de crescimento foi encontrado em camundongos CBi/L e em machos CBi+, porque no primeiro genótipo, selecionado para reduzido peso corporal, o tempo decorrido para a maturação aumentou, enquanto que no último, selecionado para elevado peso corporal, houve um aumento não significante no mesmo caráter. De acordo com o critério de se-leção, fontes diferentes de variação genética para o peso corpo-ral puderam ser exploradas: uma inversamente associada com precocidade de maturação (seleção agonística) e a outra inde-pendente da taxa de maturação (seleção antagonística), mostrando que a variação genética de A é parcialmente independente de k.
REFERENCES
Archer, J.A., Herd, R.M., Arthur, P.F. and Parnell, P.F. (1998). Correlated responses in rate of maturation and mature size of cows and steers to divergent selection for yearling growth rate in Angus cattle. Livest. Prod. Sci. 54: 183-192.
Baker, R.L. and Cockrem, F.R.M. (1970). Selection for body weight in the mouse at three temperatures and the correlated response in tail length.
Brown, J.E., Brown, C.J. and Butts, W.T. (1972). A discussion of the as-pects of weight, mature weight and rate of maturing in Hereford and Angus cattle. J. Anim. Sci. 34: 525-534.
Dickerson, G.E. (1976). The choice of selection objectives in meat produc-ing animals. In: Meat Animals. Growth and Productivity (Lister, D., Rhodes, D.N., Fowler, V.R. and Fuller, M.F., eds.). Plenum Press, New York, pp. 449-462.
Dieulefait, C.E. (1932). La teoría de la población en relación con sus grupos sociales componentes. Congresso Internazionale per gli Studi sulla Popolazione. Istituto Poligrafico dell Stato, Roma, pp. 3-23. Di Masso, R.J., Abdala, S., Sánchez, S.M. and Font, M.T. (1991a). Disruptive
selection for body conformation in mice. Mendeliana 9: 79-92. Di Masso, R.J., Celoria, G.C. and Font, M.T. (1991b). Morphometric traits
and femoral histomorphometry in mice selected for body conformation.
Bone and Miner. 15: 209-218.
Di Masso, R.J., Silva, P.S. and Font, M.T. (1992). The effect of sex on the pattern of fat deposition in mice selected for body conformation: Ago-nistic selection. Rev. Bras. Genet. 15: 65-72.
Di Masso, R.J., Font, M.T., Capozza, R., Detarsio, G., Sosa, F. and Ferretti, J.L. (1997). Long-bone biomechanics in mice selected for body confor-mation. Bone 20: 539-545.
Di Masso, R.J., Celoria, G.C. and Font, M.T. (1998). Morphometric skeletal traits, femoral measurements, and bone mineral deposition in mice with agonistic selection for body conformation. Bone 22: 539-543. Eisen, E.J. (1976). Results of growth curve analyses in mice and rats. J.
Anim. Sci. 42: 1008-1023.
Fitzhugh, H.A. (1976). Analysis of growth curves and strategies for altering their shape. J. Anim. Sci. 42: 1036-1051.
Gall, G.A.E. and Kyle, W.H. (1968). Growth of the laboratory mouse. Theor. Appl. Genet.38: 304-308.
Grossman, M. and Bohren, B.B. (1985). Logistic growth curve of chickens: heritability of parameters. J. Hered. 76: 459-462.
Hetzel, D.J.S. and Nicholas, F.W. (1986). Growth, efficiency and body com-position of mice selected for post-weaning weight gain on ad libitum or restricted feeding. Genet. Res. 48: 101-109.
Kastelic, M., Salehar, A., Drobnic, M. and Kovac, M. (1996). Mature size and maturing rate in RoC57BL/6 and RoNMRI lines of mice. J. Anim. Breed. Genet. 113: 545-551.
Koops, W.J., Grossman, M. and Michalska, E. (1987). Multiphasic growth curve analysis in mice. Growth 51: 372-382.
Laird, A.K. and Howard, A. (1967). Growth curves in inbred mice. Nature 213: 786-788.
Malik, R.C. (1984). Genetic and physiological aspects of growth, body
com-position and feed efficiency in mice. A review. J. Anim. Sci. 58: 577-590. Marquardt, D.W. (1963). An algorithm for least-squares estimation of non
linear parameters. J. Soc. Industr. Appl. Math. 11: 431-441.
McCarthy, J.C. and Bakker, H. (1979). The effects of selection for different combinations of weights at two ages on the growth curve of mice.
Theor. Appl. Genet. 55: 57-64.
McCarthy, J.C. and Doolittle, D.P. (1977). Effects of selection for indepen-dent changes in two highly correlated body weight traits in mice. Genet. Res. 29: 133-145.
Monteiro, L.S. and Falconer, D.S. (1966). Compensatory growth and sexual maturity in mice. Anim. Prod. 8: 179-182.
Reeds, P.J. and Fiorotto, M.L. (1990). Growth in perspective. Proc. Nutr. Soc. 49: 411-420.
Ricard, F.H. (1975). A trial of selecting chickens on their growth curve pat-tern: Experimental design and first general results. Ann. Genet. Sel. Anim. 7: 427-443.
Richards, F.J. (1959). A flexible growth function for empirical use. J. Exp. Bot. 10: 290-300.
Roberts, R.C. (1965). Some contributions of the laboratory mouse to animal breeding research. Anim. Breed. Abstracts33: 3-30.
Scharovsky, O.G., Celoria, G.C., Racca, A.L. and Font, M.T. (1991). Associa-tion between immune response and body conformaAssocia-tion in the mouse (Mus musculus). Rev. Bras. Genet. 14: 373-380.
Sokal, R.R. and Rohlf, F.J. (1969). Biometry. W.H. Freeman, San Fran-cisco.
Tallis, G.M. (1968). Selection for an optimum growth curve. Biometrics 24: 169-177.
Taylor, St.C.S. (1965). A relation between mature weight and time taken to mature in animals. Anim. Prod. 7: 203-220.
Taylor, St.C.S. (1968). Time taken to mature in relation to mature weight for sexes, strains and species of domesticated mammals and birds. Anim. Prod. 10: 157-169.
Taylor, St.C.S. and Fitzhugh, H.A. (1971). Genetic relationships between mature weight and time taken to mature within a breed. J. Anim. Sci. 33: 726-731.
Timon, V.M. and Eisen, E.J. (1969). Comparison of growth curves of mice selected and unselected for postweaning gain. Theor. Appl. Genet. 39: 345-351.
Trumper, L., Di Masso, R.J., Abdala, S. and Font, M.T. (1989). The effect of sex on the pattern of fat deposition in mice selected for body conforma-tion. Rev. Bras. Genet. 12: 535-542.