Fluids in the postoperative period: efects of lack
of adjustment to body weight
Líquidos en el período postoperatorio: efectos de la falta de ajuste
al peso corporal
Fluidos no período pós-operatório: efeitos da falta de ajuste ao
peso corpóreo
INTRODUCTION
The perioperative fluid management is controversial because of the limited and contradictory data available from randomized trials. More than fifty years ago, opposite opinions arose about this topic. First, Moore recommended restrictive fluid therapy based on the fact that the surgical trauma produces endocrine and metabolic effects leading to renal
water and sodium conservation.(1) In contrast, Shires argued that the
frequent hypovolemia resulting from fluid redistribution to third spaces
should be replaced by additional solutions.(2) Moreover, Shoemaker
lately introduced the concept of supranormal resuscitation, which
was performed primarily by the use of fluid infusions and inotropes.(3)
Recently, more balanced approaches claimed for the individualization
Alejandro Risso Vazquez1, Fabio Daniel Masevicius1, Roberto Giannoni1, Arnaldo Dubin1
1. Intensive Care Service, Sanatorio Otamendi y Miroli, Buenos Aires, Argentina.
ABSTRACT
Objective: To compare the
diferences in luid and electrolyte balance in patients with low and high weight in the irst postoperative day.
Methods: Over a period of 18 months, we prospectively evaluated 150 patients in the irst 24 hours after surgery, in a university-ailiated hospital intensive care unit.Patients with low weight (≤ 60 kg) and high body weight (≥ 90 Kg) were compared in terms of luid intake and output.
Results: No signiicant diferences were observed in the volume (4334 ± 1097 vs. 4644 ± 1957 ml/24 h) and composition of the luids administered (481 ± 187 vs. 586 ± 288 mEq [Na+]
administered/24 h). he 24 h urine output was similar (2474
± 1597 vs.2208 ± 678 ml/24 h) but low weight group showed higher electrolyte elimination (296 ± 195 vs.192 ± 117 mEq [Na+]
urine/24 h, p = 0.0246). When
the administered luids were adjusted for body weight, the volume and amount of electrolytes of luids administered were higher in the low weight group (79 ± 21 vs. 47 ± 22 ml/kg/24 h, p<0.0001 and 8.8 ± 3.4 vs. 5.8 ± 3.3 mEq [Na+]
administered/ kg/24 h, p=0.017, respectively). his group also showed higher urine output and electrolyte elimination (45 ± 28 vs. 22 ± 7 ml/kg/24 h, p = 0.0002 and 5.3
± 3.5 vs. 1.8 ± 1.2 mEq [Na+]
urine/kg/24 h, p<0.0001, respectively).
Conclusions: The lack of
adjustment of the fluid therapy to body weight determined that low weight patients received more fluid than high weight patients according to their body weight. This fluid overload could be compensated by increased urine output and electrolyte elimination.
Keywords: Fluid therapy; Electrolytes; Postoperative period; Body weigth his study was conducted at the
Intensive Care Service, Sanatorio Otamendi y Miroli, Buenos Aires, Argentina.
Supported by institutional departmental funds.
Conlicts of interest: None.
Submitted on May 8, 2011 Accepted on June 16, 2011
Corresponding author:
Arnaldo Dubin
Servicio de Terapia Intensiva Sanatorio Otamendi y Miroli Buenos Aires, Argentina.
of fluid therapy in elective surgery.(4) Therefore, the
administration of fluids should consider the extent of the surgical procedure as well as the patient’s characteristics in order to maintain tissue perfusion. Excessive fluid administration could produce tissue edema but insufficient hydration could induce tissue hypoperfusion. Both situations are associated to the development of organ failures and worsened outcome. In addition, these concerns remain in the postoperative period. Besides, the knowledge about the fluid management in this period is still poorer.
Despite the debate about the beneficial and detrimental effects of the so-called “liberal” and “restrictive” strategies, neither the criteria nor the type of body weight (actual or predicted) used for adjusting these therapeutic behaviors has been clearly established. For example, in intraoperative studies, the range of liberal regimens was 2750-5388 ml. On the contrary, restrictive protocols
used 998-2740 ml.(5,6) As a matter of fact, there was
an overlapping between the criteria used in some
studies.(7,8) In postoperative studies, the reported
ranges were 1500-2900 and 500-2100 ml for liberal
and restrictive behaviors, respectively.(5,6,9)
Nevertheless, the amount of fluids administered was not adjusted to body weight in most of those studies. Therefore, our goal was to compare the administration of fluid and electrolytes, in the first postoperative day, between low and high weight patients. Our hypothesis was that our therapeutic behaviors unintentionally result in the administration of larger amounts of fluids in low weight patients compared to high weight patients because of the lack of consideration of patients’ weight.
METhODS
Design: Prospective observational study.
Setting: Medical-surgical intensive care unit
(ICU) at teaching hospital. The ICU has 16 beds.
Patients: Over a period of 18 months (01/03/08 to 01/09/09), 150 patients were evaluated postoperatively in the first 24 hours after surgery. We selected patients with an actual weight ≤ 60 and ≥ 90 kg who were assigned to low weight and high weight groups, respectively.
This study was approved by the Institutional Ethics Committee. Since applied procedures were part of the usual diagnostic management, informed consent was waived.
Measurements: On admission and at 24 h,
demographic data (age, gender) were recorded. Acute Physiologic Chronic Health Evaluation (APACHE)
II score,(10) predicted risk of mortality, and
Sepsis-related Organ Failure Assessment (SOFA) score(11)
were calculated. Shock was defined as the need of vasopressor drugs to maintain a mean arterial blood pressure ≥ 65 mm Hg. We considered that patient were on mechanical ventilation if it was required in the ICU, at any time during the first 24 h after surgery.
Arterial blood samples were analyzed for gases and electrolytes ([Na+], [K+], and [Cl–]), and blood
chemistry on admission and after 24 h. Urine
electrolytes were also measured. The volume and composition of the fluids administered as well as the urine output during the first 24 h was registered. Fluids and electrolytes balances were calculated and adjusted to actual weight. The body weight was measured in the pre-operatory evaluation.
We excluded patients with renal failure (serum
creatinine > 1.7 mg%), bladder surgery, younger
than 18-year old, and those with incomplete records of balances.
Data analysis: Patients were grouped according their body weight in low (≤ 60 kg) and high
(≥ 90 Kg) weight groups. Data, expressed as media ±
standard deviation, median [25th-75th percentiles],
or percent, were compared with test t or Mann
Whitney U test for unpaired samples, and chi square
test for categorical variables. A p value < 0.05 was considered statistically significant.
RESULTS
Table 1 shows the clinical and epidemiologic characteristics of the patients. There was a lower proportion of men in the low weight group. Although SOFA and APACHE II scores were similar, there were more patients on mechanical ventilation in the low weight group (Table 1).
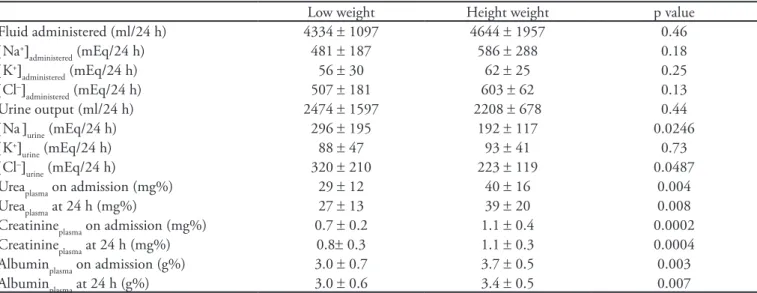
No significant differences were observed in the volume and composition of the fluids administered. The 24 h urine output was similar but low weight group showed higher electrolyte elimination and lower plasma urea, creatinine, and albumin levels (Table 2).
Table 1 - Clinical and epidemiologic characteristics of the patients
Low weight Height weight p value
Number of patients 29 26
Actual weight (kg) 55 ± 5 101 ± 16 0.0001
Gender, male 1 (3) 18 (75) 0.0001
Age (years) 59 ± 23 64 ± 12 0.38
Type of surgery
Emergency 9 (31) 4 (15) 0.17
Abdominal 13 (45) 15 (58) 0.34
Orthopedic 9 (31) 3 (12) 0.0805
Pulmonary 2 (7) 5 (19) 0.17
Urologic 0 (0) 3 (12) 0.0599
Neurologic 2 (7) 0 (0) 0.17
Gynecologic 2 (7) 0 (0) 0.17
Vascular 1 (3) 0 (0) 0.34
APACHE II score 9.2 ± 5.4 8.5 ± 3.6 0.59
SOFA score 2.4 ± 2.5 1.5 ± 2.2 0.15
Mechanical ventilation 9 (31) 1 (4) 0.0128
Shock 7 (24) 2 (8) 0.10
ICU length of stay (days) 3 [2-7] 2 [2-4] 0.18
Hospital length of stay (days) 8 [6-17] 7 [5-10] 0.20
ICU and hospital mortality (%) 2 (7) 0 (0) 0.17
APACHE II predicted mortality 12 ± 9 10 ± 5 0.27
ICU – intensive care unit; APACHE - Acute Physiologic Chronic Health Evaluation; SOFA - Sequential Organ Failure Assessment. Results are expressed in mean ± standard deviation or number (%).
Table 2 - Fluid and electrolyte balance in the irst postoperative 24 h
Low weight Height weight p value
Fluid administered (ml/24 h) 4334 ± 1097 4644 ± 1957 0.46
[Na+]
administered (mEq/24 h) 481 ± 187 586 ± 288 0.18
[K+]
administered (mEq/24 h) 56 ± 30 62 ± 25 0.25
[Cl–]
administered (mEq/24 h) 507 ± 181 603 ± 62 0.13
Urine output (ml/24 h) 2474 ± 1597 2208 ± 678 0.44
[Na]urine (mEq/24 h) 296 ± 195 192 ± 117 0.0246
[K+]
urine (mEq/24 h) 88 ± 47 93 ± 41 0.73
[Cl–]
urine (mEq/24 h) 320 ± 210 223 ± 119 0.0487 Ureaplasma on admission (mg%) 29 ± 12 40 ± 16 0.004 Ureaplasma at 24 h (mg%) 27 ± 13 39 ± 20 0.008 Creatinineplasma on admission (mg%) 0.7 ± 0.2 1.1 ± 0.4 0.0002 Creatinineplasma at 24 h (mg%) 0.8± 0.3 1.1 ± 0.3 0.0004 Albuminplasma on admission (g%) 3.0 ± 0.7 3.7 ± 0.5 0.003
Albuminplasma at 24 h (g%) 3.0 ± 0.6 3.4 ± 0.5 0.007
Results are expressed in mean ± standard deviation.
This group also showed higher urine output and electrolyte elimination (Table 3).
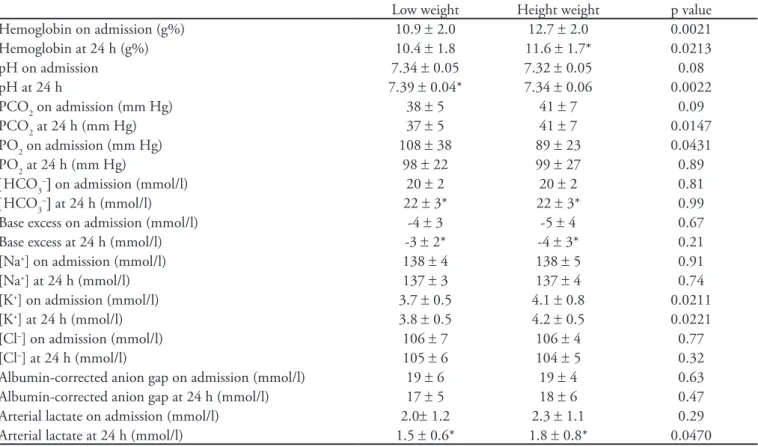
After 24 h, there were trends in both groups to decreased hemoglobin levels (only significant in the
high weight group) and improved pH, [HCO3–],
Table 3 - Weight-adjusted luid therapy and urine output and composition
Low weight Height weight p value
Fluid administered (ml/kg/24 h) 79 ± 21 47 ± 22 0.000001
[Na+]
administered (mEq/kg/24 h) 8.8 ± 3.4 5.8 ± 3.3 0.017
[K+]
administered (mEq/kg/24 h) 1.0 ± 0.6 0.6 ± 0.3 0.003
[Cl–]
administered (mEq/kg/24 h) 9.2 ± 3.4 6.2 ± 3.4 0.0014
Urine output (ml/kg/24 h) 45 ± 28 22 ± 7 0.0002
[Na+]
urine (mEq/kg/24 h) 5.3 ± 3.5 1.8 ± 1.2 0.000001
[K+]
urine (mEq/kg/24 h) 1.6 ± 0.8 0.9 ± 0.4 0.001
[Cl–]
urine (mEq/kg/24 h) 5.8 ± 3.8 2.1 ± 1.2 0.000001 Results are expressed in mean ± standard deviation.
Table 4 - hemoglobin and acid-base variables in the irst postoperative 24 h
Low weight Height weight p value
Hemoglobin on admission (g%) 10.9 ± 2.0 12.7 ± 2.0 0.0021
Hemoglobin at 24 h (g%) 10.4 ± 1.8 11.6 ± 1.7* 0.0213
pH on admission 7.34 ± 0.05 7.32 ± 0.05 0.08
pH at 24 h 7.39 ± 0.04* 7.34 ± 0.06 0.0022
PCO2 on admission (mm Hg) 38 ± 5 41 ± 7 0.09
PCO2 at 24 h (mm Hg) 37 ± 5 41 ± 7 0.0147
PO2 on admission (mm Hg) 108 ± 38 89 ± 23 0.0431
PO2 at 24 h (mm Hg) 98 ± 22 99 ± 27 0.89
[HCO3–] on admission (mmol/l) 20 ± 2 20 ± 2 0.81
[HCO3–] at 24 h (mmol/l) 22 ± 3* 22 ± 3* 0.99
Base excess on admission (mmol/l) -4 ± 3 -5 ± 4 0.67
Base excess at 24 h (mmol/l) -3 ± 2* -4 ± 3* 0.21
[Na+] on admission (mmol/l) 138 ± 4 138 ± 5 0.91
[Na+] at 24 h (mmol/l) 137 ± 3 137 ± 4 0.74
[K+] on admission (mmol/l) 3.7 ± 0.5 4.1 ± 0.8 0.0211
[K+] at 24 h (mmol/l) 3.8 ± 0.5 4.2 ± 0.5 0.0221
[Cl–] on admission (mmol/l) 106 ± 7 106 ± 4 0.77
[Cl–] at 24 h (mmol/l) 105 ± 6 104 ± 5 0.32
Albumin-corrected anion gap on admission (mmol/l) 19 ± 6 19 ± 4 0.63 Albumin-corrected anion gap at 24 h (mmol/l) 17 ± 5 18 ± 6 0.47 Arterial lactate on admission (mmol/l) 2.0± 1.2 2.3 ± 1.1 0.29 Arterial lactate at 24 h (mmol/l) 1.5 ± 0.6* 1.8 ± 0.8* 0.0470 p < 0.05 vs. on admission. Results are expressed in mean ± standard deviation.
DISCUSSION
he main inding in this study was that despite exhibiting very diferent body weight, postoperative patients received similar hydration plans. herefore, the lack of consideration of the body weight for that prescription generated a risk of luid overload in the patients with low body weight.
he morbidity associated with the postoperative luid administration has been studied by diferent authors. Walsh et al. prospectively evaluated 71 patients
in the irst 24 h after colorectal surgery. here was no correlation between luid and electrolytes prescription and preoperative weight, serum electrolyte levels or ongoing luid losses. Consequently, a high number of complications, including the luid overload associated with excessive luid volume and sodium administration, arose because the available information was not used.
(12) Moreover, Arief reported a series of patients with
fatal postoperative pulmonary edema and reviewed its
epidemiology in 8,195 major operations.(13) he author
edema with a mortality of 11.9%. Extrapolation to the 8.2 million annual major surgeries in the United States yields a projection of 8,000 to 74,000 deaths.
Characteristically, the patients’ weight was 58 ± 18
kg, a igure comparable to 55 ± 5 Kg found in our low
body weight group. his inding probably expresses the fact that body weight is not usually considered for the prescription of luid therapy and that these patients are at high risk of iatrogenic hypervolemia.
Our study was not designed to investigate the morbidity associated with luid therapy. Nevertheless, the low weight group was challenged by a large luid hydration and load of electrolytes as shown by the administration of higher body weight-adjusted volume and amount of electrolytes. Furthermore, the luid redistribution among body compartments could generate hypervolemia. he luids administered during the surgery could initially be shifted to interstitial and intracellular compartments but eventually transferred to the intravascular compartment in
the postoperative period.(14) Since the renal failure was an
exclusion criterion in this study, low weight patients were able to eliminate the intake excess through higher urine output and electrolyte elimination. he higher excretion of salt in these patients could result from expansion of the extracellular compartment, which is a powerful stimulus
for the renal excretion of sodium.(15,16)
he use of restrictive or liberal luid therapy in the intraoperative period remains as a controversial issue. In contrast, after the surgery, ongoing evidence favors luid restriction. Weight gain and edema were related
to worsened outcome after colorectal surgery.(7,17)
Tissue edema has correlated with poor wound healing, respiratory alterations, and delayed recovery of intestinal
function.(7,18) Compared to the standard luid therapy
(> 3 l), the restrictive management (< 2 l) has resulted in a faster improvement in gastrointestinal activity, fewer
complications, and shorter hospital length of stay.(5)
In the low weight group, the lower plasma values of urea, creatinine and albumin on admission and at 24 h. could be explained by diferences in the body composition related to malnutrition and female prevalence but also by a dilutional efect produced by luid overload.
An additional explanation for our results is that low weigh group was more critically ill and the actual needs of luid resuscitation were higher. his group showed a trend to have more shock and required mechanical ventilation more frequently than the high weight group. APACHE II and SOFA score, however, were similar in both groups. Beyond that the groups might be misbalanced at baseline, another limitation of this study is the small number of
patients. Consequently, the study is underpowered to show the efects of the diferent luid therapies on the patients’ outcome.
CONCLUSIONS
he lack of adjustment of the luid therapy to body weight determined that low weight patients received more luid than high weight patients according to their body weight. his overload could be compensated by increased urine output and electrolyte elimination.
RESUMEN
Objetivo: Comparar las diferencias en el equilibrio de lí-quidos y electrolitos en los pacientes con bajo y alto peso en el primer día postoperatorio.
Métodos: Durante un período de 18 meses, evaluamos pros-pectivamente 150 pacientes, en las primeras 24 horas después de la cirugía, en una unidad de cuidados intensivos de un hospital escuela ailiado a una universidad. Se compararon pacientes con bajo (≤ 60 kg) y alto peso corporal (≥ 90 Kg) en términos de ingesta y excreción urinariade agua y electrolitos.
Resultados: No se observaron diferencias signiicativas en el volumen (4,334 ± 1,097 vs. 4,644 ± 1,957 ml/24 hs.) y la composición de los líquidos administrados (481 ± 187 vs. 586
± 288 mEq [Na +]administrado/24 hs). El volumen de diuresis en24 horas fue similar (2,474 ± 1,597 vs 2208 ± 678 ml/24 hs.), pero el grupo de bajo peso mostró una mayor eliminación de electrolitos (296 ± 195 vs. 192 ± 117 mEq [Na +]orina/ 24 hs., p=0,0246). Cuando los líquidos administrados fueron ajustados al peso corporal, el volumen y cantidad de electrolitos fueron mayores en el grupo de bajo peso (79 ± 21 vs. 47 ± 22 ml/kg/24 h, p <0,0001 y 8,8 ± 3,4 vs. 5,8 ± 3,3 mEq [Na +]administrado/kg/24 hs., p = 0,017, respectivamente). Este grupo también mostró mayores producción de orina y eliminación de electrolitos (45 ± 28 vs. 22 ± 7 ml/kg/24 hs., p = 0,0002 y 5,3 ± 3,5 vs. a 1,8 ± 1,2 mEq [Na+]
orina/kg/24 hs., p <0,0001, respectivamente).
Conclusiones: La falta de ajuste de la terapia con luidos al peso corporal determinó que los pacientes de bajo peso recibie-ran más líquidos que los pacientes de alto peso, de acuerdo a su peso corporal. Esta sobrecarga de líquidos pudo ser compensada por el aumento de la diuresis y la eliminación de electrolitos.
Descriptores: Tratamiento con líquidos; Electrolitos; El período postoperatorio; Peso corporal
RESUMO
Métodos: Em um período de 18 meses avaliamos prospec-tivamente 150 pacientes durante as primeiras 24 horas após cirurgia, na unidade de terapia intensiva de um hospital univer-sitário. Pacientes com baixo (≤60 kg) e alto peso corpóreo (≥90 kg) foram comparados em termos de fornecimento e eliminação de luidos.
Resultados: Não foram observadas diferenças signiicantes em termos de volume (4,334 ± 1,097 em versus 4,644 ± 1,957 mL/24 horas) e composição dos luidos administrados (481 ± 187 versus 586 ± 288 mEq [Na+]
administrados em 24 horas). O débito urinário em 24 horas foi similar (2,474 ± 1,597 versus 2,208 ± 678 mL/24 horas), porém o grupo com baixo peso teve uma maior eliminação de eletrólitos (296 ± 195 versus 192 ± 117 mEq [Na+]
urina/24 horas, p=0.0246). Quando os luidos administrados foram ajustados ao peso corpóreo, o volume e quantidade de eletrólitos dos luidos administrados
foram maiores no grupo com baixo peso (79 ± 21 versus 47 ± 22 mL/kg/24 horas, p<0.0001 e 8,8 ± 3,4 versus 5,8 ± 3,3 mEq [Na+]
administrado/kg/24 horas, p=0,017, respectivamente). Este grupo também demonstrou maior débito urinário e eli-minação de eletrólitos (45 ± 28 versus 22 ± 7 mL/kg/24 horas; p=0,0002 e 5.3 ± 3.5 vs. 1.8 ± 1.2 mEq [Na+]
urina/kg/24 horas; p<0,0001, respectivamente).
Conclusões: A falta de ajuste da terapia hídrica ao peso corpóreo determinou que os pacientes com peso baixo recebes-sem mais líquidos do que os pacientes com peso elevado, de acordo com o peso corpóreo. A sobrecarga hídrica poderia ser compensada pelo aumento do débito urinário e eliminação de eletrólitos.
Descritores: Hidratação; Eletrólitos; Período pós-operatório; Peso corporal
REFERENCES
1. Moore FD. Metabolic care of the surgical patient. Philadelphia: Saunders; 1959.
2. Shires T, Williams J, Brown F. Acute change in extracellular luids associated with major surgical procedures. Ann Surg. 1961;154:803-10.
3. Shoemaker WC, Appel P, Bland R. Use of physiologic monitoring to predict outcome and to assist in clinical decisions in critically ill postoperative patients. Am J Surg. 1983;146(1):43-50.
4. Holte K, Kehlet H. Fluid therapy and surgical outcome in elective surgery: a need for reassessment in fast-track surgery. A systematic review. J Am Coll Surg. 2006;202(6):971-89. 5. Lobo DN, Bostock KA, Neal KR, Perkins AC, Rowlands
BJ, Allison SP. Efect of salt and water balance on recovery of gastrointestinal function after elective colonic resection: a randomised controlled trial. Lancet. 2002;359(9320):1812-8. 6. Holte K, Kristensen BB, Valentiner L, Foss NB, Husted
H, Kehlet H. Liberal versus restrictive luid management in knee arthroplasty: a randomized, double-blind study. Anesth Analg. 2007;105(2):465-74.
7. Brandstrup B, Tonnesen H, Beier-Holgersen R, Hjortsø E, Ørding H, Lindorf-Larsen K, Rasmussen MS, Lanng C, Wallin L, Iversen LH, Gramkow CS, Okholm M, Blemmer T, Svendsen PE, Rottensten HH, hage B, Riis J, Jeppesen IS, Teilum D, Christensen AM, Graungaard B, Pott F; Danish Study Group on Perioperative Fluid herapy. Efects of intravenous luid restriction on postoperative complications: comparison of two perioperative luid regimens: a randomized assessor-blinded multicenter trial. Ann Surg. 2003;238(5):641-8.
8. MacKay G, Fearon K, McConnachie A, Serpell MG, Molloy RG, O’Dwyer PJ. Randomized clinical trial of the efect of postoperative intravenous luid restriction on recovery after elective colorectal surgery. Br J Surg. 2006;93(12):1469-74.
9. Holte K, Foss NB, Andersen J, Valentiner L, Lund C, Bie P, Kehlet H. Liberal or restrictive luid administration in fast-track colonic surgery: a randomized, double-blind study. Br J Anaesth. 2007;99(4):500-8. Erratum in Br J Anaesth. 2008;100(2):284.
10. Knaus WA, Draper EA, Wagner DP, Zimmerman JE. APACHE II: a severity of disease classiication system. Crit Care Med. 1985;13(10):818-29.
11. Vincent JL, Moreno R, Takala J, Willatts S, De Mendonça A, Bruining H, et al. he SOFA (Sepsis-related Organ Failure Assessment) score to describe organ dysfunction/failure. On behalf of the Working Group on Sepsis-Related Problems of the European Society of Intensive Care Medicine. Intensive Care Med. 1996;22(7):707-10.
12. Walsh SR, Walsh CJ. Intravenous luid-associated morbidity in postoperative patients. Ann R Coll Surg Engl.2005;87(2):126-30.
13. Arief AI. Fatal postoperative pulmonary edema: pathogenesis and literature review. Chest. 1999;115(5):1371-7.
14. Holte K, Sharrock NE, Kehlet H. Pathophysiology and clinical implications of perioperative luid excess. Brit J Anaesth. 2002;89(4):622-32.
15. Halperin ML, Skorecki KL. Interpretation of the urine electrolytes and osmolality in the regulation of body luid tonicity. Am J Nephrol. 1986;6(4):241-5.
16. Steele A, Gowrishankar M, Abrahmson S, Mazer CD, Feldman RD, Halperin ML. Postoperative hyponatremia despite near-isotonic saline infusion: a phenomenon of desalination. Ann Intern Med. 1997;126(1):20-5.
17. Nisanevich V, Felsenstein I, Almogy G, Weissman C, Einav S, Matot I. Efect of intraoperative luid management on outcome after intraabdominal surgery. Anesthesiology. 2005;103(1):25-32.