Introduction
There has been rapid and progressive growth in research examining screen time as an indicator of sedentary behavior in children and adolescents, especially concerning excessive exposure to screen-based devices (television, TV; videogames, VG; and computers, PC). Systematic reviews indicate that sedentary behavior is associated with negative health outcomes (i.e., physical function, obesity, academic achievement, and psychosocial parameters) in this subgroup 1-2.Therefore, changes in lifestyle have been encouraged in childhood and adolescence3,4.
Studies on trends of exposure to screen time in adolescents have been conducted, mainly in high-income countries5-7. Data from the Youth Risk Behavior Surveillance showed that exposure to TV of least 2 hours/day reduced from 1999 to 20075. Conversely, Nelson et al.6 demonstrated an increase in exposure to PCs between 1999 and 2004. Moreover, a previous study conducted in seven European countries7 showed that the proportion of exposure to TV for at least 4 hours/day decreased from 1985/86 and 1997/98 in Norway, Scotland, and Wales, while it increased in Hungary, Austria, and Finland. These
results indicate that trends of exposure to screen-based devices vary across countries.
In Brazil, changes in the patterns of exposure to screen time in adolescents have been addressed in few studies 8-9. Silva et al.8 found that exposure to TV reduced, while exposure to PC/ VG increased from 2001 to 2011 in the state of Santa Catarina, in southern Brazil. Lopes et al. 9 reported in literature that these changes were similar between boys and girls, but were stronger on weekend days. However, since sociodemographic factors are associated with different changes in patterns of TV or PC/VG use8 , and access to electronic devices varies between states and cities (i.e., due to socioeconomic inequalities10), such results cannot be extrapolated to other regions of Brazil (e.g., northern). In fact, the PNAD report on access to internet, television, and cell phone use revealed marked changes in access to technology, consumption habits, and interactivity of Brazilians with screen devices, indicating differences between these regions and states11.
Thus, the aim of this study was to analyze the pattern and trends of use of screen devices and associated factors from two surveys (2007 and 2012) conducted on public high school students of Caruaru-PE.
Original Article (short paper)
Trends in television and computer/videogame use
and total screen time in high school students from
Caruaru city, Pernambuco, Brazil: A repeated
panel study between 2007 and 2012
Luis José Lagos Aros1 , Antonio Henrique Germano-Soares1, Caroline Ramos de Moura Silva1, Alison Oliveira da
Silva1, Rafael Miranda Tassitano2*
1Universidade de Pernambuco, UPE, Recife, PE, Brazil; 2Universidade Federal
Rural de Pernambuco, UFRPE, Recife, PE, Brazil.
Abstract — Aim: to analyze the pattern and trends of use of screen-based devices and associated factors from two
surveys conducted on public high school students in Caruaru-PE. Methods: two representative school-based cross-sectional surveys conducted in 2007 (n=600) and 2012 (n=715) on high school students (15-20 years old). The time of
exposure to television (TV) and computer/videogames PC/VG was obtained through a validated questionnaire, and ≥3
hours/day was considered as being excessive exposure. The independent variables were socioeconomic status, school related, and physical activity. Crude and adjusted binary logistic regression were employed to examine the factors
associated with screen time. The statistical signiicance was set at p<0.05. Results: There was a signiicant reduction
in TV time on weekdays and total weekly, but no change in the prevalence of excessive exposure. The proportion of
exposure to PC/VG of ≥3 hours/day increased 182.5% on weekdays and 69.5% on weekends (p <0.05). In 2007, being
physically active was the only protection factor for excessive exposure to total screen time. In 2012, girls presented less chance of excessive exposure to all screen-based devices and total screen time. Other protective factors were studying at night and being physically active (PC/VG time), while residing in an urban area [OR 5.03(2.77-7.41)] and having higher family income [OR 1.55(1.04-2.30)] were risk factors. Conclusion: Signiicant and important changes
in the time trends and pattern of use PC/VG were observed during the interval of 5 years. This rapid increase could be associated with increased family income and improved access to these devices, driven by technological developments.
Methods
Design
This study compared data from two epidemiological, cross-sectional, school-based surveys entitled “Lifestyle and health risk behaviors in adolescents: a temporal trend from 2007 to 2012”. The irst data collection was carried out in October 2007 and the second in October 2012. The Ethics Committee on Research with Human Beings of the Associação Caruaruense de Educação Superior approved the study procedures for both surveys (CAAE: 07296612.3.0000.5203).
The population comprised students of both genders (15 – 20 years) from public high schools of Caruaru-PE. The municipality is geographically divided into three regions (North, Center, and South). According to data from the Department of Education and Culture of the State of Pernambuco, during the two surveys, there were 15 public high schools. The population of students in 2007 was 8,833 and in 2012 the total number of students enrolled was 9,405. In both surveys, the same parameters were used for the sample calculation, sampling process, instruments, and data collection.
Planning and sample selection
In both surveys, the sample size was calculated based on information from the school census, and the following parameters
were also considered: 95% conidence interval; maximum tolerable error of 5%; and sampling effect of 1.5. The prevalence was estimated at 50% since multiple outcomes were considered.
Thus, in the 2007 survey, the estimated sample was 541 students. Due to possible losses and refusals, the calculated sample was multiplied by 1.2, totaling 649 students. In the 2012 survey, the estimated sample was 543 adolescents. The same procedure of multiplying the sample by 1.2 was adopted, totaling 652 students.
The sample selection was by conglomerate in two stages. In
the irst stage, the schools were considered as the sample unit. The selection of schools was random and the following stratiication
criteria were considered: (a) school and student density in each micro region of the municipality; and (b) school size (small: less than 200 students, average: 200 to 499 students, and large: 500 students or more). In the second stage, the proportion of students enrolled per class was considered, respecting the proportion of students enrolled in schools and regions. For the only school
classiied as small, it was guaranteed that at least one class would
be selected as part of the sample. Considering the average number of students enrolled per class, 16 classrooms from eight schools were randomly selected in 2007 and 19 classrooms from eight schools in 2012. Data collections always took place in October and the following procedures were adopted: a) prior contact with the principal of each school to send the terms of consent and to
schedule visits; B) training of researchers for ield procedures.
The questionnaire was applied in the classroom with all the students of the groups selected on the day of the visit. At the beginning of the study, the researcher communicated the objectives of the study, informing students that all information
would be kept conidential, would not affect their academic
performance, and would only be used for research purposes. In addition, students were instructed not to identify themselves in the questionnaire. In the case of students over 18 years of age, the free and informed consent form was signed, while for students under 18 years of age, parental consent was requested.
In addition, prior to carrying out the ieldwork, the directors
of all the schools were consulted and only with their consent were data collected.
Instrument
Data were collected through the questionnaire entitled “Risk Behaviors in adolescents from Santa Catarina (COMCAP)”, which has been previously validated and used on students from the Brazilian public school system8,9,12. The questionnaire was also applied in a pilot study with adolescents from Caruaru and achieved moderate to high reproducibility measures (0.62 – 1.00). For the present study, we used information from the socio-demographic (gender, age, place of residence with family, marital status, children, and monthly family income); school related (study shift and high school grade) and behavioral sections (physical activity and sedentary behavior). The time of moderate to vigorous physical activity was measured in minutes during a typical week and all dimensions of physical activity were taken
into account. Adolescents who reported ≥300 minutes / week
were considered as being physically active.
Information related to the different types of screen time, considered as outcomes, was collected (TV, PC, and VG) and time spent on weekdays, weekends, and weekly total. To obtain this information the following questions were asked: “During the days of the week how many hours a day do you watch television?”; “During the weekend, how many hours a day do you watch television?”; “During the days of the week, how many hours a day do you use a computer or videogame?”; “During the weekend, how many hours a day do you use a computer or videogame?” The answers were given considering the total time, in hours per day, for each of the questions. For estimation of total screen time during the week, a time weighting was performed on weekdays (5 days) and on weekend days (2 days).
Data analysis
The data were tabulated in the EpiData program (version 3.1) and analyzed in SPSS software (version 15.0). The mean and standard deviation values (numerical data) and relative frequencies (categorical data) were used for the descriptive statistics. The average time of screen exposure to the different electronic devices (mean time during the week, weekend, and total weekly time) between the 2007 and 2012 surveys was compared using the Mann-Whitney test, while the Chi-square
test was used to compare the proportions. The cut-off point of ≥
PC/VG, and total screen time in both periods. The proportion of adolescents with excessive exposure to the different screen devices was adopted as the dependent variable, whereas the independent variables were sex (male, female), age (15-17 years, 18-20 years), marital status (single, other), place of residence (urban, rural), monthly family income (up to R$ 1,000.00 and R$ 1,001.00 or more), high school grade (1st, 2nd, and 3rd year), study shift (morning and at night), and physical activity
(inactive, active). For all analyses, p <0.05 was considered as statistically signiicant.
Results
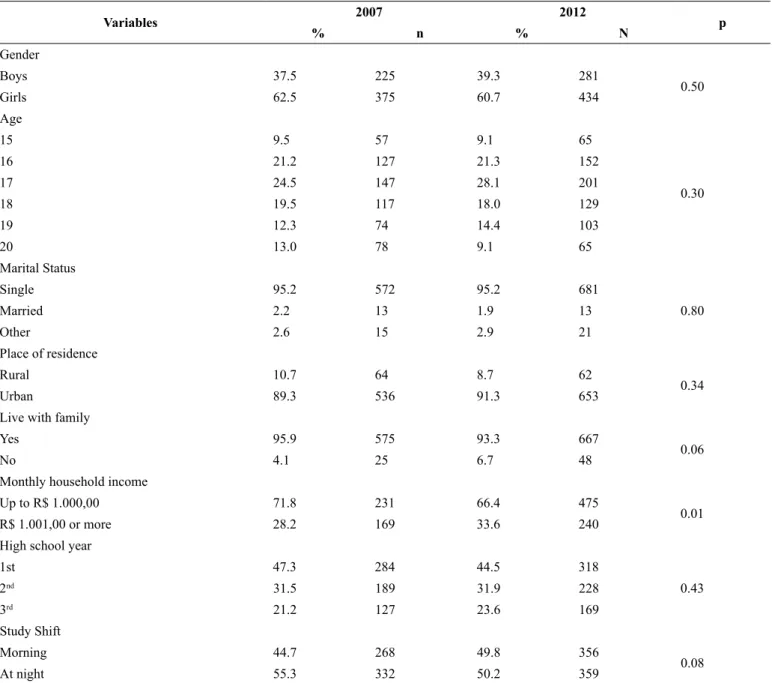
Table 1 summarizes the general characteristics of the samples between surveys. No differences were observed in relation to the sociodemographic and school-related characteristics. In both surveys, the majority of students was female, aged between 16 and 18 years old, single, urban residents, living with family, and studied during the evening period. The proportion of students
with monthly family income ≥ R$1,001. 00 increased from 2007 to 2012 (p<0.01).
Table 1. Sociodemographic, economic, and school-related distribution of high school students in the public school network of Caruaru, PE, Brazil - 2007 (n = 600) and 2012 (n = 715).
Variables 2007 2012 p
% n % N
Gender
Boys 37.5 225 39.3 281
0.50
Girls 62.5 375 60.7 434
Age
15 9.5 57 9.1 65
0.30
16 21.2 127 21.3 152
17 24.5 147 28.1 201
18 19.5 117 18.0 129
19 12.3 74 14.4 103
20 13.0 78 9.1 65
Marital Status
Single 95.2 572 95.2 681
0.80
Married 2.2 13 1.9 13
Other 2.6 15 2.9 21
Place of residence
Rural 10.7 64 8.7 62
0.34
Urban 89.3 536 91.3 653
Live with family
Yes 95.9 575 93.3 667
0.06
No 4.1 25 6.7 48
Monthly household income
Up to R$ 1.000,00 71.8 231 66.4 475
0.01
R$ 1.001,00 or more 28.2 169 33.6 240
High school year
1st 47.3 284 44.5 318
0.43
2nd 31.5 189 31.9 228
3rd 21.2 127 23.6 169
Study Shift
Morning 44.7 268 49.8 356
0.08
At night 55.3 332 50.2 359
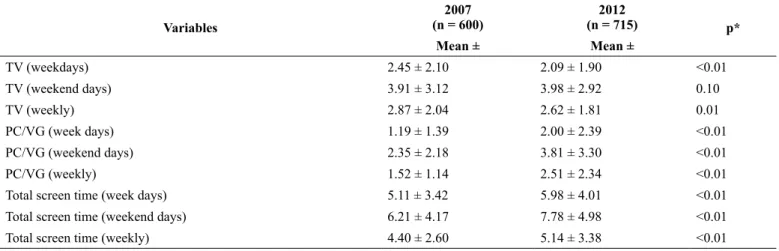
Table 2 shows the comparisons of the average time of exposure to TV, VG/PC, and total screen time on weekdays, weekend days, and total weekly time from the 2007 and 2012 surveys. The time of exposure to TV did not change on weekend
days (p=0.10), but reduced on weekdays and weekly from 2007
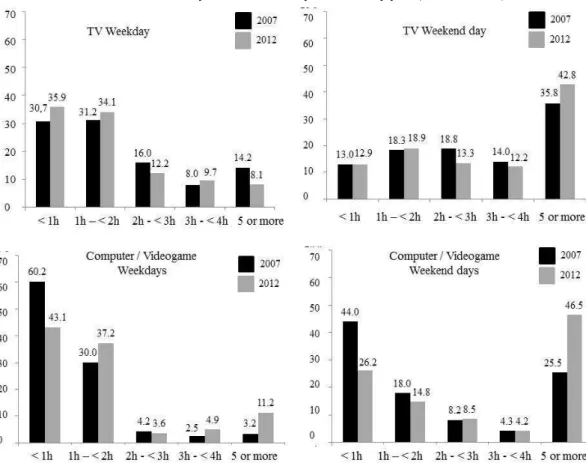
Figure 1 presents the comparisons of the proportion of students who presented excessive exposure to the different screen-based devices from 2007 to 2012. The proportion of
adolescents exposed to ≥3 hours/day of PC/VG increased 182.5%
on weekdays and 69.5% on weekend days from 2007 to 2012 (p <0.05). On the other hand, no changes were observed for
exposure to TV and total screen time between surveys (Figure 1). Table 2. Mean and standard deviation of the time spent on screen electronic devices (in hours) during the weekdays, weekends, and weekly total of high school students of the public school network of Caruaru, PE, Brazil - 2007 and 2012.
Variables
2007 (n = 600)
2012
(n = 715) p*
Mean ± Mean ±
TV (weekdays) 2.45 ± 2.10 2.09 ± 1.90 <0.01
TV (weekend days) 3.91 ± 3.12 3.98 ± 2.92 0.10
TV (weekly) 2.87 ± 2.04 2.62 ± 1.81 0.01
PC/VG (week days) 1.19 ± 1.39 2.00 ± 2.39 <0.01
PC/VG (weekend days) 2.35 ± 2.18 3.81 ± 3.30 <0.01
PC/VG (weekly) 1.52 ± 1.14 2.51 ± 2.34 <0.01
Total screen time (week days) 5.11 ± 3.42 5.98 ± 4.01 <0.01
Total screen time (weekend days) 6.21 ± 4.17 7.78 ± 4.98 <0.01
Total screen time (weekly) 4.40 ± 2.60 5.14 ± 3.38 <0.01
Note: TV = Television; PC = Computer; VG = Videogame; SD – standard deviation. * Mann-Whitney U test.
Figure 1. Prevalence of exposure (≥3 hours / day) to the different screen-based devices and total screen time, considering weekdays and weekend
days in high school students of the public school network of Caruaru, PE, 2007 and 2012.
A difference was observed between TV exposure time on weekdays and weekend days. During the week, the majority of
adolescents reported ≤ 2 hours/day of TV exposure, whereas on
weekends a large proportion reported exposure to TV, independent
of the survey (igure 2). A large proportion of students reported PC ≥5 hours/day and VG ≤ 2 hours/day on weekdays, whereas
on the weekend a considerable proportion of students reported
Table 3 shows the adjusted regression models to identify the factors associated with excessive exposure to the different screen-based devices. For TV, being a girl was associated with a
lower chance of having ≥3 hours/day of exposure, only in 2012.
For PC/VG, being a girl, physically active, and studying at night
were associated with a lower chance of presenting ≥3 hours/
day of exposure, whereas living in an urban area and having
a monthly household income ≥ R$1,001.00 were associated with a higher chance of presenting ≥3 hours/day of exposure,
only in 2012. For total screen time, being physically active
was associated with a lower chance of having ≥3 hours/day of
exposure in 2007, whereas being a girl was associated with a
lower chance of presenting ≥3 hours/day of exposure in 2012. Figure 2. Time of use of TV, PC and VG, on weekdays, and weekend days, stratiied by year (2007 and 2012).
Table 3. Adjusted regression of factors associated with TV time, computer and videogame time, and weekly screen time considering the years of 2007 and 2012 of high school students of the public school network of Caruaru, PE, Brazil.
TV time PC/VGTime Total Screen Time
2007 2012 2007 2012 2007 2012
Gender Boys Girls
1
0.87 (0.61 – 1.45) 1
0.40 (0.27 – 0.60) 1
0.75 (0.42 – 1.35) 1
0.63 (0.42 – 0.93) 1
0.92 (0.65 – 1.33) 1
0.63 (0.43 – 0.92)
Age
15 – 17 years old 18 – 20 years old
1
1.06 (0.70 – 1.58) 1
0.84 (0.58 – 1.22) 1
0.93 (0.48 – 1.88) 1
0.78 (0.41 – 1.18) 1
1.07 (0.71 – 1.59) 1
0.82 (0.57 – 1.19) Marital status
Single Other
1
1.26 (0.78 – 2.02) 1
0.72 (0.41 – 1.26) 1
1.64 (0.89 – 2.80) 1
1.13 (0.70 – 1.83) 1
0.98 (0.60 – 1.62) 1
0.91 (0.58 – 1.43) Place of residence
Rural Urban
1
1.25 (0.69 – 2.25) 1
1.61 (0.85 – 3.06) 1
1.52 (0.80 – 2.88) 1
5.03 (2.77 – 7.41) 1
0.66 (0.36 – 1.22) 1
1.40 (0.80 – 2.52) Monthly household
income
Up to R$ 1.000,00 R$ 1.001,00 or more
1
1.24 (0.85 – 1.82) 1
1.42 (0.91 – 2.22) 1
1.40 (0.87 – 1.90) 1
1.55 (1.04 – 2.30) 1
0.85 (0.58 – 1.25) 1
Discussion
The main indings of the current study were fourfold: i) the
average time of exposure to TV decreased on weekdays and weekly, but no change was observed in the proportion of exposure
to ≥3 hours/day of TV from 2007 to 2012; ii) the average time
and proportion of excessive exposure to PC/VG increased from 2007 to 2012 on both week and weekend days; iii) despite an increase in average total screen time, the prevalence of excessive
exposure to total screen time did not change signiicantly from
2007 to 2012; and iv) being physically active was a protection factor for excessive exposure to total screen time (2007). In 2012, girls presented less risk for all screen-based devices and total screen time. Studying at night and being physically active were protective factors, while residing in the urban area and having higher family income were risk factors to excessive exposure to PC/VG time.
The lack of changes in the proportion of students with
excessive exposure to TV (≥3 hours/day) contrasts with the results
from previous studies conducted between 2001-2011 in the state of Santa Catarina, Brazil8-9 . Said study showed a reduction in prevalence of this behavior. The period of data collection and the region could explain, at least in part, these differences.
Speciically in Brazil, the early years after 2000 were marked
by changes in social and economic conditions; a combination of unemployment reduction, progressive increases in the minimum wage, and expansion of cash transfer programs10, which directly
inluenced the access to and use of electronic devices11. On the one hand, there was an increase in access to new technologies such as computers, tablets, cell phones, smartphones, and the internet, while on the other hand, the timing of access in regions, capitals, and cities with greater economic development was earlier when compared to regions, rural cities, and areas with less economic development11.
The reduction in TV use could be linked to the lack of interactivity related to this device (e.g., TV does not have social networks, which is of interest to young individuals). In fact, adolescents are the largest users of other electronic devices such as PCs and VGs (PNAD), which provide greater freedom to seek information and entertainment, especially with access to the internet.
Similar to the results from previous national and international studies8,9,13-15, we demonstrated that there was an increase in
the proportion of students with excessive exposure to PC/VG. Interestingly, these trends have been observed even with different cut-off points, which reinforce the growing use of these devices. This phenomenon could be explained by the recent access to different electronic media and technological evolution, which enables different patterns of interactivity.
The magnitude of change in the proportion of exposure to
PC/VG was higher than that observed in a previous study (135%
vs. 60%)8, which again might be explained by the different
collection data periods. Accordingly, a previous study published by the National Household Survey indicated an increase in the number of TVs, PCs, and internet access in Brazilian households10, however this increase was more accelerated in developed regions (e.g., southern) compared to less developed regions (e.g., northeastern) in Brazil. Therefore, it is reasonable to speculate that access to PCs and VGs was still increasing during the data collection period of the current study, while already stable in other regions.
It should be mentioned that other studies published in developing countries present different results. A secular trend study13, conducted in the United States, considering 2001 - 2012,
observed a decrease in TV time in preschoolers (19%) and schoolchildren (6%, not signiicant). This decrease could be
explained by the early use of devices such as PCs, smartphones, and tablets13. Two surveys (2001-2009), with American teenagers between 2001 and 2009, considering TV, PC, and VG time, noted that overall TV time declined both on weekdays and weekends14. The use of PCs and VGs was analyzed only in the period from 2005 to 2009, during which period an average of 2 hours/day for these devices was observed, but which did
not present signiicant changes in the time of use14. A Spanish study concluded that adolescents spend an average of 3 hours/ day watching TV, increasing their use during the weekend15. In the same way, the time of exposure to PCs and VGs increased due to connection to the internet, obtaining a mean use of 4.5 h/day, indicating a discreet increase on the weekend15.
On the other hand, national studies presented similar results to the present study. Some studies in Brazil that evaluated only the
habit of watching TV conirmed a decrease16-18, and Silva et al.8 and Lopes et al.9 add information that agrees with our indings, also showing a decrease in the use of TV and an increase in the
use of PCs and VGs. Although these indings are opposite in some points, they approximate the indings of the present study,
TV time PC/VGTime Total Screen Time
2007 2012 2007 2012 2007 2012
High school year 1st
2nd
3rd
1
1.16 (0.77 – 2.22) 1.08 (0.68 – 2.12)
1
1.21 (0.88 – 2.32) 1.18 (0.84 – 2.18)
1
0.91 (0.68 – 2.08) 0.94 (0.71 – 2.14)
1
1.08 (0.84 – 1.38) 1.11 (0.91-1.41)
1
0.92 (0.72 – 1.18) 0.81 (0.53 – 1.15)
1
1.05 (0.84 – 1.32) 1.09 (0.89 – 1.41) Study Shift
Morning At night
1
0.93 (0.63 – 1.37) 1
0.90 (0.59 – 1.17) 1
0.91 (0.49 – 1.73) 1
1.64 (0.89 – 2.80) 1
0.78 (0.41 – 1.18) 1
0.61 (0.32 – 1.04) Physical activity
Inactive Active
1
0.98 (0.71 – 1.42) 1
0.71 (0.48 – 1.08) 1
0.81 (0.40 – 1.09) 1
0.47 (0.30 – 0.74) 1
0.67 (0.46 – 0.96) 1
0.88 (0.61 – 1.24)
noting that there are clear cultural differences, as is the case with states in Brazil and developed countries; thus highlighting that these patterns may have some similarity, but are not equal. In addition to cultural differences, it is also necessary to take into account the differences in methods used to assess exposure to these devices in each study, as demonstrated by Oliveira et al.19, in which methodological differences between the indings
were identiied and were shown to have inluenced the results.
However, no mention was made of the function and modes of use of the devices in relation to the possibilities of use of PCs, TVs, smartphones, and VGs. For example, TV does not have social networks, which is what interests young people. Smartphones have all the functions and facilities to allow users to browse the internet, so they can be used both as a VG and to watch videos, among other uses. The decrease in TV viewing time and increase
in PC and VG use are conirmed in the majority of studies cited
above, which may indicate a substitution in entertainment patterns and electronic devices among adolescents, pointing out that this has been happening since Brazil began to have a more stable economy and, consequently, an improvement in the purchasing power of the population. As previously reported in other studies, the present study found changes in relation to the amount of total screen time, TV time, and PC and VG time, both on week and weekend days.
Another issue related to the different patterns of use of screen devices are the socioeconomic differences in Brazil, which caused a technological advance, facilitating the use of the internet, tablets, PCs, and smartphones11. In the present study, the economic factor was observed to be associated with exposure to PC/VG only in 2012, not in 2007. The PNAD report
indicated that between 2004 and 2014 there was a signiicant
increase in internet access from a computer (6.3 million to 25.7 million households), mainly in urban areas, which increased as household incomes increased11. The authors agree with Silva and colleagues8 who argued that regarding the use of PC/VG, patterns of income were determinants, and this might be due to the cost of purchasing these devices. In addition, the quality and type of internet connection when comparing regions and urban areas is a factor associated with this difference.
Previous studies in Brazil have reported differences in sedentary behavior between genders20-22, while others have not
identiied signiicant differences23-24. Moreover, the few studies in Brazil that examined the use of other types of media have yielded mixed results. Since the use of media is becoming more central to the daily lives of adolescents, understanding the pattern of use and interactivity tend to become more complex. Ohannessian (2009)25 argued that this is the result of the interaction between characteristics of the individual and context.
It is well recognized that physical activity and sedentary behavior may coexist, and most importantly, they might interact11. The results of the current study corroborate this assumption by showing that being physically active was considered a protection factor for exposure to TV. Accordingly, a recent meta-analysis of prospective studies, with more than one million individuals, demonstrated that achieving an amount of moderate physical activity (i.e., about 60-75 min per day) appears to eliminate the increased mortality risk related to increased sitting time and
attenuated the risk associated to exposure to TV26.
A strong point of the present study is that it is one of the
few studies to evaluate the speciic domains of screen time
separately. Therefore, changes were observed when comparing the two periods, both with weighted estimates of screen time and evaluations performed for each screen device. Moreover, the sample calculation was performed using parameters to obtain greater precision in the estimates of the studied variables, obtaining results with certain accuracy. Conversely, some limitations must be considered. Several studies have used self-reported measures for the amount of time of use for all devices, which would be a limiting point of our study, as this measure has an estimated value. Another limitation of the study was to consider only the TV, PC, and VG as screen use, since exploratory studies have been evaluating the time of use of tablets and smartphones. These screen devices are also important in the current context, yet access to these new technologies at the time was not common. Another limitation of our study was it joined the two types of screen time (PC and VG), since, undoubtedly, there is information that is lost due to this weighting, making
it dificult to establish which of the two apparatuses has greater
predominance among adolescents.
Conclusion
The results indicate that there were signiicant changes in the
use of screen devices, after half a decade, considering that the
use of TV among adolescents presented a signiicant decrease and the time using a PC and VG presented a signiicant increase,
compensating for the decrease in TV use. However, the time that adolescents are exposed to this type of device is still very high. This is due to the technological changes during that period of time
and the economic stability that directly inluences these types
of human behaviors. Further research that considers all screen devices that are currently being used by different populations due to the accelerated technological evolution is suggested, in
addition to research with approaches that allow for clariication
of the cause-effect between variables related to screen time, as is the case of longitudinal studies.
References
1. Flynn MA, McNeil DA, Maloff B, Mutasingwa D, Wu M, Ford C, et al. Reducing obesity and related chronic disease risk in children and youth: a synthesis of evidence with ‘best practice’
recommendations. Obesity reviews : an oficial journal of the
International Association for the Study of Obesity. 2006;7 (Suppl 1):7-66.
2. Tremblay MS, LeBlanc AG, Kho ME, Saunders TJ, Larouche R, Colley RC, et al. Systematic review of sedentary behaviour and health indicators in school-aged children and youth. Int J Behav Nutr Phys Act. 2011;8(98):1-22.
Global Library. Geneve.: Available from: <http://www.who.int/ dietphysicalactivity/publications/9789241599979/en/>. 2010. 4. Centers for Disease Control and Prevention. Improving the
Health of Adolescents & Young Adults: A Guide for States and Communities. Atlanta, GA. 2004: Available from: http://nahic. ucsf.edu/wp-content/uploads/2011/11/Complete-2010Guide.pdf. 5. Lowry R, Lee SM, Fulton JE, Kann L. Healthy people 2010
objectives for physical activity, physical education, and television viewing among adolescents: national trends from the Youth Risk Behavior Surveillance System, 1999-2007. J Phys Act Health. 2009;6(Suppl 1):S36-45.
6. Nelson MC, Neumark-Stzainer D, Hannan PJ, Sirard JR, Story M. Longitudinal and secular trends in physical activity and sedentary behavior during adolescence. Pediatrics. 2006;118(6):e1627-34. 7. Samdal O, Tynjala J, Roberts C, Sallis JF, Villberg J, Wold
B. Trends in vigorous physical activity and TV watching of adolescents from 1986 to 2002 in seven European Countries. Eur J Public Health. 2007;17(3):242-8.
8. Instituto Brasileiro de Geografia e Estatística. Síntese de indicadores sociais: uma análise das condições de vida da população Brasileira. Brasil: IBGE; 2016. Available from: http:/ http://biblioteca.ibge.gov.br/visualizacao/livros/liv98965.pdf [Accessed 18th June 2017]
9. Silva KS, da Silva Lopes A, Dumith SC, Garcia LM, Bezerra J, Nahas MV. Changes in television viewing and computers/ videogames use among high school students in Southern Brazil between 2001 and 2011. Int J Public Health. 2014;59(1):77-86. 10. Lopes AS, Silva KS, Barbosa Filho VC, Bezerra J, de Oliveira
ES, Nahas MV. Trends in screen time on week and weekend days in a representative sample of Southern Brazil students. J Public Health (Oxf). 2014;36(4):608-14.
11. Tassitano RM, Dumith SC, Chica DAG, Tenório MCM. Aggregation of the four main risk factors to non-communicable diseases among adolescents. RevBrasEpidemiol. 2014;17(2):465-78.
12. Loprinzi PD; Davis RE. Secular trends in parentreported
television viewing among children in the United States, 2001– 2012. Child: care, health anddevelopment. 2016;42(2): 288-291. 13. Iannotti RJ & Wang J. (2013). Trends in physical activity,
sedentary behavior, diet, and BMI among US adolescents, 2001–2009. Pediatrics. 2013;132(4): 606-614.
14. Bercedo SA, Redondo FC, Pelayo AR. Consumo de los medios de comunicación en la adolescencia. An Pediatr (Barc). 2005; 63(6): 516-525.
15. Mielke GI, Hallal PC, Malta DC, Lee IM. Time trends of physical activity and television viewing time in Brazil: 2006-2012. Int J Behav Nutr Phys Act. 2014;11(101).
16. Tassitano R, Mielke G, Carvalho W, Oliveira M, Malta D. Tendência temporal de indicadores da prática de atividade física e comportamento sedentário nas capitais da Região Nordeste do Brasil: 2006-2013. Rev Bras Ativ Fís Saúde. 2015: 20(2);152-64. 17. Rech C, Reis R, Hino A, De Sá G, Stopa S, & Malta D. Tendências temporais de atividade física e comportamento sedentário nas capitais da Região Sul do Brasil: 2006-2013. Rev Bras Ativ Fís Saúde. 2015;20(1):47-56.
18. Silva OS, Soares AHG, Silva BRVS, Tassitano RM. Prevalência do tempo de tela como indicador do comportamento sedentário em adolescentes brasileiros: uma revisão sistemática. Motricidade. 2016;12(s2):155-64.
19. Farias Júnior JC, Lopes ADS, Mota J, Hallal PC. Physical activity practice and associated factors in adolescents in Northeastern Brazil. Rev Saúde Públ. 2012;46(3):505-515.
20 Dias PJ, Domingos, IP, Ferreira MG, Muraro AP, Sichieri R, Gonçalves-Silva RMV. (2014). Prevalência e fatores associados aos comportamentos sedentários em adolescentes. Rev Saúde Públ. 2014; 48(2):266-274.
21 Tenório MCM, Barros MVG, Tassitano RM, Bezerra J, Tenório J M, Hallal PC. Atividade física e comportamento sedentário em adolescentes estudantes do ensino médio. Rev bras epidemiol. 2010;13(1):105-17.
22 Martins MO, Cavalcante VLF, Holanda GS, Oliveira CG, Maia FES, Meneses Júnior J R, et al. Associação entre comportamento sedentário e fatores psicossociais e ambientais em adolescentes da região nordeste do Brasil. Rev Bras Ativ Fís Saúde. 2012;17(2):143-150.
23. Silva KS, Barbosa Filho VC, Del Duca GF, Peres MA, Mota J, Lopes, AS et al. Gender differences in the clustering patterns of risk behaviours associated with non-communicable diseases in Brazilian adolescents. Prev Med. 2014;65:77-81.
24. Silva KS, Lopes AS, Dumith SC, Garcia LMT, Bezerra J, Nahas MV. Changes in television viewing and computers/videogames use among high school students in Southern Brazil between 2001 and 2011. IntJ Public Health. 2014;59(1):77-86.
25. Ohannessian CM. Media use and adolescent psychological adjustment: An examination of gender differences. J Child Fam Stud. 2008;18(5):582-593.
26. Ekelund U, Steene-Johannessen J, Brown WJ, Fagerland MW, Owen N, Powell KE, et al.. Does physical activity attenuate, or even eliminate, the detrimental association of sitting time with mortality? A harmonised meta-analysis of data from more than 1 million men and women. The Lancet. 2016;388(10051):1302-1310.
Corresponding author
*Rafael Miranda Tassitano
Universidade Federal Rural de Pernambuco, Physical Education, Rua Dom Manoel de Medeiros S/N Dois Irmãos. Recife, Brazil.
Email: [email protected]
Manuscript received on July 30, 2017 Manuscript accepted on October 10, 2017