RESUMO
As licenças médicas da equipe de enfer-magem exigem ações gerenciais imediatas quando a meta é a assistência de qualida-de. Este estudo, descrii vo-exploratório e quani tai vo, busca caracterizar esse fenômeno em um hospital universitário entre 2003 e 2007. As licenças médicas so-maram 3.207 afastamentos e 32.022 dias perdidos. Afastamentos de até dois dias representaram 54% do total e 7% dos dias perdidos; afastamentos acima de 15 dias, 5% do total e 66% dias perdidos. Assim, as licenças médicas consi tuem importante ferramenta no gerenciamento de pessoal de enfermagem.
DESCRITORES Equipe de enfermagem Licença médica Absenteísmo
Indicadores de qualidade em assistência à saúde
Administração de recursos humanos em hospitais
Sick leave and nursing
personnel management
*O
RIGINAL
A
R
TICLE
ABSTRACT
Sick leaves in the nursing team demand im-mediate managerial aci ons when health care has quality as a goal. This descripi ve-exploratory, quani tai ve study was per-formed with the purpose of characterizing that phenomenon in a university hospi-tal between 2003 and 2007. The medi-cal leaves added up to 3,207 leaves and 32,022 days lost. Leaves lasi ng up to two days accounted for 54% of the total leaves and to 7% of the days lost; leaves of more than 15 days, 5% of the total, and 66% of the lost days. Hence, sick leaves consist of an important tool in nursing personnel management.
DESCRIPTORS Nursing, team Sick leave Absenteeism
Quality indicators, health care Personnel administrai on, hospital
RESUMEN
Las licencias médicas del equipo de enfer-mería exigen acciones gerenciales inmedia-tas cuando la meta es la calidad de la aten-ción. Este estudio descripi vo exploratorio y cuani tai vo busca caracterizar dicho fenó-meno en un Hospital Universitario en perío-do entre 2003 y 2007. Las licencias médicas totalizaron 3207 solicitudes y 32.022 días perdidos. Las licencias de hasta dos días re-presentan el 54% del total y 7% de los días perdidos; las licencias por encima de quince días, 5% del total y 66% de los días perdidos. De tal modo, las licencias médicas consi tu-yen una importante herramienta en el ge-renciamiento del personal de Enfermería.
DESCRIPTORES Grupo de enfermería Ausencia por enfermedad Abseni smo
Indicadores de calidad de la atención de salud
Administración de personal en hospitales
Thiago Puliesi Estorce1, Paulina Kurcgant2
LICENÇA MÉDICA E GERENCIAMENTO DE PESSOAL DE ENFERMAGEM
LICENCIA MÉDICA Y GERENCIAMIENTO DE PERSONAL DE ENFERMERÍA
The characterization and monitoring of unscheduled absences
are part of Quality Programs in some hospitals in the state of São Paulo, Brazil, which serve as a management
indicator...
INTRODUCTION
Current praci ce has shown that unscheduled absenc-es within the nursing team require nursabsenc-es to take immedi-ate aci ons in the at empt to ensure the minimum condi-i ons necessary to provide quality care with the minimum risk to pai ents(1).
The theme leave has been addressed within the lit-erature under many designai ons and defi nii ons, which hinders the recovery of support references required for analysis, such as absenteeism, leave and absences. There are studies addressing aspects such as illnesses in profes-sionals on-leave(2-5). Others address the theme in the
con-text of personnel allotment and the determinai on of the Technical Security Index (TSI) to cover such personnel(6-11).
Aiming to acquire a greater clarity concerning the theme, this study adopts a classifi cai on that discrimi-nates absences into two large groups: scheduled absences and unscheduled absences. Scheduled absences are those in which workers are eni tled to leave, such as vacai ons, weekly paid days-off and holidays.
Unsched-uled absences include excused (administra-i ve leave), unexcused leave, annual leave, suspensions, maternity leave, paternity leave, compassionate leave, marriage leave, and sick leave(12).
It is important to highlight that such rights are provided in the Consi tui on of the Federai ve Republic of Brazil from 1988 and depend on the work contract—whether it is public or private—and require a diff erent set of laws for them to be eff eci ve. The decree, law No. 5,452 from May 1st 1942,
Consolida-i on of Labor Laws, is valid for those working in private companies, and public employees
are submit ed to law No. 8,112 from December 11th 1990
from the Federal Single Legal Framework of Civil Public Servants.
Among the nurses’ several daily responsibilii es, per-sonnel distribui on and scheduling are undoubtedly the aci vii es that most evidence their praci ce within the managerial process. These aci vii es directly and indirectly make explicit the professional posture of nurses toward those who collaborate with them in relai on to problem solving capacity and decision-making.
The most recent theories concerning the administra-i on of human resources in health consider that
the human dimension in the quality sphere should be the focus of the discussion since the desires, expectations, and satisfaction of people responsible for achieving such pur-poses are vital to the achievement of institutional goals (13). The concept quality in healthcare is classically defi ned as a set of at ributes such as
level of professional excellence, effi cient use of resources, minimum risk and a high level of satisfaction among users, essentially considering existing social values(14-15).
On the other hand, indicators are units of quani tai ve measure that can be used as a guide to monitor and eval-uate quality in health facilii es(16).
They are generally constructed based on a mathemati-cal expression where the numerator represents the total of predefi ned events and the denominator the selected risk population, through which reliability, validity, objectiv-ity, sensitivobjectiv-ity, specifi city and predictive value of data are observed (17).
The characterizai on and monitoring of unscheduled absences are part of Quality Programs in some hospitals in the state of São Paulo, Brazil, which serve as a manage-ment indicator and is called absenteeism rate. Data are
collected monthly and internally and externally compared to data from other facilii es. Due to the muli factor nature of causes that generate absenteeism, an invesi gai on of absenteeism should be taken into account in the insi
tu-i on’s human resources policy(18).
Considering the importance of human resources in the implementai on of a care proposal, the need to have both quani ty and quality in regard to health personnel to implement such a proposal, and also consid-ering quality as a factor that guides mana-gerial decisions, this study characterizes the absences of nursing personnel due to sick leave in a university hospital and evaluates the relevance of sick leave to construct an indicator of quality in the managerial pro-cess of nursing.
METHOD
This descripi ve-exploratory study was carried out at the University Hospital of the University of São Paulo (HU-USP), SP, Brazil. The project was approved by the Research Ethics Commit ee at USP under number SISNEP CAAE: 0042.0.198.000-08, in July 2008 as an extension of the research project Construci ng quality indicators to
evalu-ate nursing services in university hospitals (CEP-HU/USP:
601/05).
Sei ng
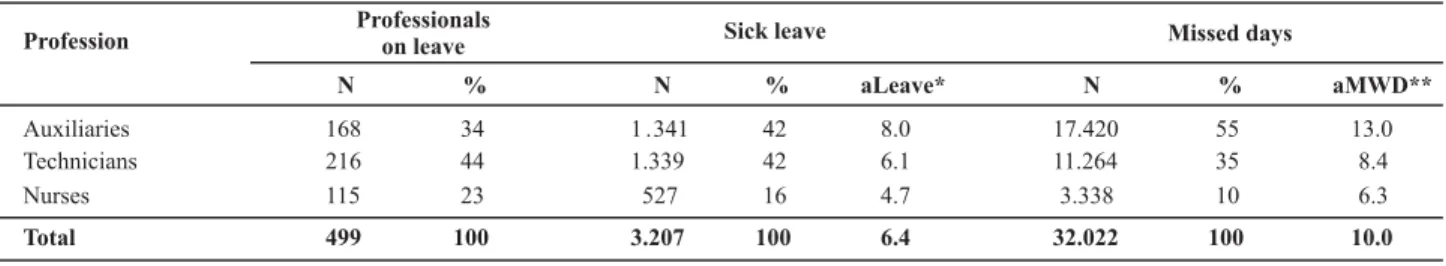
Table 1 – Distribution of professionals on leave, sick leave and missed workdays according to profession from 2003 to 2007 – HU-USP – São Paulo, SP, Brazil – 2008
Execui ve management is performed by the direc-tor, which the Medical and Nursing Departments are di-rectly linked to. The administrai on includes a Delibera-i ve Board (senior management body) and other specifi c commit ees: Commit ee on Hospital-Acquired Infeci ons; Pharmacy and Therapeui cs Commit ee; Commit ee for Culture and University Extension Services; Commit ee of Medical Ethics; and Medical Residence Commit ee.
The Nursing Department is composed of four divisions: Division of Clinical Medicine; Division of Clinical Surgery; Maternal and Pediatrics Division; Outpai ent Division; and Division for Educai onal Support Offi ce.
According to data from Personnel Service at the insi -tui on, the nursing team was composed of approximately 635 (100%) members at the i me of data colleci on. Of these, 183 (28.8%) were auxiliaries, 277 (43.6%) were nursing technicians and 175 (27.6%) were nurses.
Populai on
The amount of sick leave between 2003 and 2007 among the nursing team members (nurses, nursing tech-nicians and auxiliaries) working in the 12 departments that compose the four nursing divisions at the hospital.
The 12 studied departments will be idenifi ed accord-ing to the followaccord-ing: Nursery Department: Nursery; Cen-tral of Material Department: Material; Surgical Center Department: Surgical; Obstetrical Center Department: Ob-stetrics; Surgery, Outpai ent and Endoscopy Department: Surgery Outpai ent Endoscopy; Emergency Department: Emergency; Inpai ent Department: Inpai ent Surgical (Sur-gical Nursing Division); Inpai ent Department: Inpai ent Clinical (Clinical Nursing Division); Inpai ent Department: Inpai ent maternal-pediatric (Maternal-Pediatric Clinical Division); Inpai ent Department: Outpai ents (Outpai ent
Nursing Division); ICU and Semi-ICU Department: ICU and Semi-ICU (Maternal-Pediatric Nursing Division) and ICU and Clinical Semi Intensive Department: ICU and Clinical.
Data colleci on
The invesi gai on of sick leave was conducted through the colleci on and analysis of data obtained at the Person-nel Service in July 2008 at er the project was approved.
Data treatment and analysis
The collected data were stored in a Microsot Excel spreadsheet. The quani tai ve variables sick leave and
missed workdays are presented in absolute numbers,
percentages and averages according to the year of occur-rence, profession, department where workers were allo-cated and durai on of sick leave (missed workdays).
The durai on of sick leave was divided and analyzed according to periods from 1 to 2 days, 3 to 15 days and
over 15 days. This classifi cai on is jusifi ed given the way the durai on of sick leave aff ects the managerial and deci-sion-making process toward a solui on.
The data obtained revealed the number of profession-als on leave during the studied period, however, since we could not access the total number of professionals per de-partment, a propori onal analysis by profession was not possible.
RESULTS
The amount of sick leave taken by the nursing team from January 2003 to December 2007 involved 499 em-ployees totaling 3,207 incidences of leave, corresponding to 32,002 missed workdays, as presented in Table 1.
*aLeave = average of sick leave per profession on leave
**aMWD = average of missed workdays by sick leave
Profession Professionalson leave Sick leave Missed days
N % N % aLeave* N % aMWD**
Auxiliaries 168 34 1 .341 42 8.0 17.420 55 13.0 Technicians 216 44 1.339 42 6.1 11.264 35 8.4
Nurses 115 23 527 16 4.7 3.338 10 6.3
Total 499 100 3.207 100 6.4 32.022 100 10.0
Nursing technicians presented the largest number of professionals involved in sick leave (216), nursing auxilia-ries presented the largest percentage of missed workdays (55%) and both professions together registered 84% of the total of sick leave in the period.
Nursing auxiliaries presented the highest average of sick leave (aLeave=8.0) and missed workdays in
rela-tion to the others (aMWD=13). Nursing technicians pre-sented intermediate levels (aLeave=6.1; aMWD=8.4) and nurses presented the lowest figures in the analyzed variables.
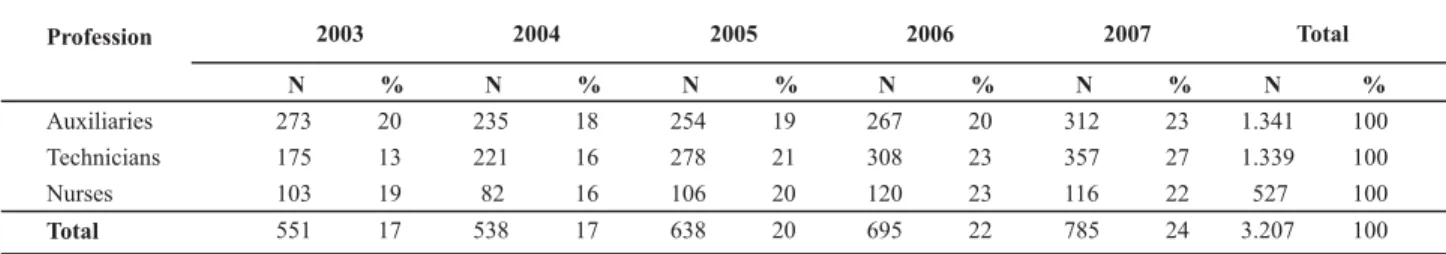
The amount of sick leave increased over the studied period, totaling 785 occurrences of leave in 2007. 2006 and 2007 presented the largest percentages of leave in the period in all the professions: nursing auxiliaries: 20% and 23%; nursing technicians: 23% and 27%; nurses: 23%
and 22%. Nursing technicians presented an expressive in-crease in the amount of sick leave, from 13% in 2003 to 27% in 2007.
Table 3 shows the number of missed workdays due to sick leave according to profession and year of occurrence. Table 2 – Distribution of the number of sick leave according to profession by year of occurrence – HU-USP – São Paulo, SP, Brazil – 2008
Profession
Auxiliaries Technicians Nurses
Total
2003 2004 2005 2006 2007
N % N % N % N % N %
273 20 235 18 254 19 267 20 312 23 175 13 221 16 278 21 308 23 357 27 103 19 82 16 106 20 120 23 116 22 551 17 538 17 638 20 695 22 785 24
Total
N %
1.341 100 1.339 100 527 100 3.207 100
Table 3 – Distribution of number of missed workdays due to sick leave among the nursing team according to profession and year of
occurrence – HU-USP – São Paulo, SP, Brazil – 2008
Profession
Auxiliaries Technicians
Nurses
Total
Total
N %
17.420 100 11.264 100
3.338 100
32.022 100
2003 2004 2005 2006 2007
N % N % N % N % N %
1.794 10 1.720 10 2.751 16 4.681 27 6.474 37 986 9 2.284 20 2.763 25 2.413 21 2.818 25
537 16 288 9 669 20 792 24 1.052 32
3.317 10 4.292 13 6.183 19 7886 25 10.344 32
The number of missed workdays by the nursing team in 2007 tripled in 2007 in relai on to the beginning of the studied period (from 10% to 32%) though with a diff erent intensity depending on the profession: an increase of 3.7 i mes (from 10% to 37%) was observed for nursing auxil-iaries, 2.7 i mes for nursing technicians (from 9% to 25%), and 2.0 i mes (from 16% to 32%) for nurses.
The classifi cai on of sick leave according to durai on is jusifi ed given the diff erent infl uences these occur-rences have on the managerial process towards a solu-i on. Table 4 presents the distribui on of sick leave and missed workdays according to profession between 2003 and 2007.
Table 4 – Distribution of the amount of sick leave and missed workdays among the nursing team by duration from 2003 to 2007 –
HU-USP – São Paulo, SP, Brazil – 2008
Missed days Profession
Auxiliaries Technician Nurses
Total
N Total
1.341 1.339 527
3.207 1 to 2 days 3 to 15 days > 15 days
N (%) N (%) N (%)
672 (50) 568 (42) 101 (8) 765 (57) 527 (39) 47 (4) 284 (54) 224 (42) 19 (4)
1.721 (54) 1.319 (41) 167 (5)
N Total
17.420 11.264 3.338
32.022 1 to 2 days 3 to 15 days > 15 days
N (%) N (%) N (%)
885 (5) 3.797 (22) 12.738 (73) 1.000 (9) 3.391 (30) 6.873 (61) 394 (12) 1.519 (45) 1.425 (43)
2.279 (7) 8.707 (27) 21.036 (66) Sick leave
Sick leave from 1 to 2 days was the most frequent (54%), represeni ng only 2,279 missed workdays (7%); leave from 3 to 15 days totaled 1,319 (41%) correspond-ing to 8,707 (27%) missed workdays; and leave over 15 days, though less frequent (5%), represented 21,036 (66%) missed workdays.
Nursing auxiliaries presented the highest percentage (8%) of sick leave over 15 days at twice those of the
oth-er categories, which represented 12,738 missed work-days (73%).
In relai on to nursing auxiliaries, the departments that presented the lowest average of leave were: Obstetrics (aLeave=4.8), Outpai ent (aLeave=5.4) and Inpai ent ma-ternal-pediatrics (aLeave=5.8). The following departments stood out with the highest averages: ICU and Semi-ICU (aLeave=15.3); Emergency (aLeave=10.8); and Surgical Outpai ent Endoscopy (aLeave=10.2).
The averages of missed workdays (aMWD) by sick leave also varied according to department. Those with the lowest values were: Obstetrics (aMWD=5.0); Surgi-cal (aMWD=5.2); and Nursery (aMWD=6.1). The depart-ments that presented the highest aMWD were: ICU and Semi-ICU (aMWD=24.8); Outpai ent (aMWD=22.0); and Inpai ent Clinical (aMWD=20.5).
The departments that presented the lowest average sick leave among nursing technicians were: Material (aLe-ave=3.4); Inpai ent maternal-pediatrics (aLeave=4.4); and Outpai ent (aLeave=4.6). The departments with the high-est average leave were: Surgical Outpai ent Endoscopy (aLeave=12.2); Inpai ent Surgical (aLeave=9.6); and Nurs-ery (aLeave=7.7).
The highest average of missed workdays was observed in the Surgical Outpai ent Endoscopy (aMWD=24.2) and Inpai ent Clinical (aMWD=23.2) departments. The lowest averages were observed in the following departments: Obstetrics (aMWD=3.0); Surgical (aMWD=3.5); and Mate-rial (aMWD=4.2).
Nurses presented the lowest average leave and the low-est average durai on of sick leave in most of the depart-ments in comparison to the other mid-level professions. The departments with the lowest averages of sick leave were: Outpai ent (aLeave=2.3), Inpai ent Clinical (aLe-ave=2.8) and Nursery (aLeave=3.1). The highest average sick leave was found in: Inpai ent maternal-pediatrics; ICU and Semi-ICU (aLeave=6.3); and Emergency (aLeave=5.8).
The highest average of missed workdays was observed in Outpai ent (aMWD=26.4), followed by Inpai ent
Sur-gical (aMWD=8.7) and Emergency (aMWD=7.8) and the lowest averages were observed in the departments Inpa-i ent maternal-pediatrics (aMWD=3.0), Inpai ent clinical (aMWD=3.2) and Surgical (aMWD=3.6).
DISCUSSION
This study’s fi ndings revealed that nursing auxiliaries took sick leave more frequently and for longer periods in comparison to nursing technicians, though there is no diff erence in the aci vii es performed by the two profes-sionals in this facility. Nurses represented 23% of the total of professionals on leave, 16% of sick leave and 10% of missed workdays.
A study conducted in a university hospital in the inte-rior of São Paulo(4) revealed that mid-level professionals
(nursing auxiliaries and technicians) were those who more frequently took sick leave of longer durai on in relai on to high-level professions (nurses). The authors assert that the lower number of sick leave among nurses is due to their increased responsibility, prompi ng them to remain at work, due to the greater probability of arrangements in their schedule, and to the fact that they are able to get days off to rest and recover at home.
Considering that nurses have mainly administrai ve re-sponsibilii es in most of the departments, it is expected that the indicators for this category of professional are lower in comparison to the nursing auxiliaries and tech-nicians, who are exposed to a workload with a greater physical and ergonomic wear, which explains the higher frequency and durai on of sick leave.
This study indicates an increase of sick leave between 2003 and 2007 both in terms of incidence (from 551 to 785 incidences of sick leave) and durai on (from 3,317 to 10,344 missed workdays), though with greater concentra-i on among nursing auxiliaries followed by nursing techni-cians and lastly by nurses. This increase is demonstrated Table 5 – Averages of sick leave by profession and averages of missed workdays by sick leave according to department from 2003 to
2007 – HU-USP – São Paulo, SP, Brazil – 2008
Auxiliaries Technicians Nurses
Department
aLeave* aMWD** aLeave* aMWD** aLeave* aMWD**
Nursery 7.0 6.1 7.7 6.2 3.1 4.7
Surgical 7.9 5.2 5.7 3.5 3.6 3.6
Material 9.4 9.2 3.5 4.2 3.7 4.5
Obstetrics 4.8 5.0 5.3 3.0 3.4 7.5
Surgical-Outpatient- Endoscopy 10.2 7.0 12.2 24.2 4.6 5.1
10.8 11.7 5.9 4.9 5.8 7.8
6.9 20.5 6.9 23.2 2.8 3.2
Inpatient Clinical
5.8 19.1 4.4 10.0 6.3 3.0
Inpatient maternal-pediatrics
9.1 13.1 9.6 4.9 4.8 8.7
Outpatient 5.4 22.0 4.6 4.6 2.3 26.4
ICU and Clinical 6.9 10.2 6.2 4.8 5.3 3.9 ICU and Semi-ICU 15.3 24.8 5.9 10.3 6.3 4.8
Facility’s average 8.0 13.0 6.2 8.4 4.6 6.3
Emergency
by data presented in Table 1 in which 34% of nursing aux-iliaries account for 55% of missed workdays.
Table 3 concerns the increase in missed workdays over the studied period for the nursing auxiliaries followed by nursing technicians and nurses. Data revealed the impor-tance of monitoring and analyzing not only the frequency of sick leave but also its durai on.
A study(19) conducted at HU-USP verifi ed that sick leave
(up to and over 15 days) is the main and most frequent cause of unscheduled absences among nursing techni-cians and auxiliaries in most of the studied departments of this facility. The increase in the incidence of sick leave over 15 days in the studied period (2001 and 2005) for these professionals caught our at eni on. The frequency of sick leave, absences and maternity leave increased lit le among nurses, while sick leave over 15 days was rare.
Data in Table 4 characterize two disi nct and important aspects for the management process of the phenomenon
sick leave. The fi rst refers to the frequency employees are
absent, which requires immediate correci ve measures (rescheduling the present team members, head nurses have to deliver care, other departments lend employees, among other measures).
The second aspect refers to the durai on of leave. Long-durai on leave (over 15 days), which is the least fre-quent (5%) type, accounts for 66% of missed workdays, requiring other managerial measures in addii on to re-viewing the monthly schedule, negoi ai ng with superiors for the loan of employees from other units in the facility, and hiring temporary employees, among others.
A study addressing absenteeism that includes sick leave as one of its components idenifi ed that sick leave of one or two days represents 79% of unscheduled leave. The authors assert that such sick leave is exempt from medical invesi gai on, while from the 3rd day on the
em-ployee has to go to the State Social Security Insi tute to obtain a formal medical report(3).
A recent study(2) correlated absences due to leave
and occupai on rate at HU-USP and idenifi ed that the monthly frequency of leave was inversely propori onal to the occupai on rate, suggesi ng that professionals may have become sick at er more intense workload. Sick leave above 15 days was the most frequent (81.9%) among ab-senteeism due to illness but accounted only for 20.7% of the missed workdays in 2007.
Data concerning Table 5, amount of sick leave (aLeave) by profession on leave and average durai on of Missed
workdays (aMWD) by sick leave, indicate diff erent
con-texts according to the studied departments.
There are departments in which the variai ons per profession according to department are more expressive: Inpai ents Clinical: nursing auxiliaries (aLeave=6.9 and aMWD=20.5); nursing technicians (aLeave=6.9 and
aM-WD=23.2); Nurses (aLeave=2.8 and aMWD=3.2). Another example of department preseni ng such variai on is Out-pai ent: nursing auxiliaries (aLeave=5.4 and aMWD=22.0); nursing technicians (aLeave=4.6 and aMWD=4.6; nurses (aLeave=2.3 and aMWD=26.4).
On the other hand, there are departments in which these variai ons are less expressive: Obstetrics: nursing auxiliaries (aLeave=4.8 and aMWD=5.0); nursing techni-cian (aLeave=5.3 and aMWD=3.0; and nurses (aLeave=3.4 and aMWD=7.5).
Signifi cant diff erences were observed in relai on to sick leave among the departments and professions in a study(11) performed in hospitalizai on units at HU-USP,
confi rming the tendencies observed in this study.
The computai on performed by the authors(11) took
in-to account the average of missed workdays per profession (by percentage) over the year to determine the coverage of care. Sick leave up to 15 days varied lit le among nurses (from 0.45% to 2.07%); sick leave above 15 days was ob-served only in the Medical ICU (0.55%). Among mid-level professionals (nursing technicians and auxiliaries) sick leave up to 15 days varied from 0.9% to 2.06% and above 15 days was observed in seven of the eight studied de-partments with an expressive percentage: 7.42% in the Pediatric ICU; 4.06% in the medical ICU and 2.24% in the nursery.
This study also indicates the need for further studies correlai ng the causes of leave with the workers’ social and working condii ons and working processes in these units(11). The need to monitor and evaluate sick leave in
the nursing team is evident both for leave of one to two days of durai on, which overloads the team, and leave over 15 days, which considerably harms personnel assign-ments, causes suff ering for the professional on leave, and imposes costs on the eni re society(20).
It is evident that this phenomenon should be more specifi cally analyzed according to department and profes-sion because these variables imply diff erent working pro-cess and, consequently, diff erences related to sick leave among workers in each department are expected.
CONCLUSION
Systemai c monitoring and evaluai on of such an event can support managerial decision-making and improve hu-man resources policies, heath preveni on programs, oc-cupai on health preveni on programs and the quality of working life.
This study also indicates possible ways to monitor sick leave with greater at eni on to leave of longer durai on (over 15 days) and its reoccurrence over the years.
In this context, we believe the use of sick leave as an indicator is relevant to evaluai ng the quality of manage-ment jointly with other indicators, such as turnover, ac-cident rate index, training index, and hospitalizai on oc-cupai on rate.
A diff ereni al analysis for each profession is necessary due to the similarii es existent in the aci vii es performed by nursing auxiliaries and nursing technicians.
REFERENCES
1. Parra MT, Melo MRAC. Ações administrai vas do enfer-meiro frente ao abseni smo. Esc Anna Nery Rev Enferm. 2004;8(1):29-38.
2. Sancinei TR, Gaidzinski RR, Felli VE, Fugulin FMT, Bapi sta PCP, Ciampone MHT, et al. Abseni smo: doença na equipe de enfermagem: relação com a taxa de ocupação. Rev Esc En-ferm USP. 2009;43(n.esp 2):1277-83.
3. Silva DMPP, Marziale MHP. Condições de trabalho versus abseni smo-doença no trabalho de enfermagem. Ciênc Cuid Saúde. 2006;5 Supl:166-72.
4. Reis RJ, Rocca PF, Silveira AS, Bonilla IML, Giné NA, Mai n M. Fatores relacionados ao absenteísmo por doença em profi s-sionais de enfermagem. Rev Saúde Pública. 2003;37(5):616-23.
5. Barboza DB, Soler ZASG. Afastamentos do trabalho na enfer-magem: ocorrências com trabalhadores de um Hospital de Ensino. Rev Lai no Am Enferm. 2003;11(2)177-83.
6. Laus AM, Anselmi ML. Absences of nursing workers at a teaching hospital. Rev Esc Enferm USP [Internet]. 2008 [cited 2010 Ago 15];42(4):681-9. Available from: ht p://www.scielo. br/pdf/reeusp/v42n4/en_v42n4a09.pdf
7. Inoue KC, Matsuda LM, Silva DMPP, Uchimura TT, Mathias TAF. Absenteísmo-doença da equipe de enfermagem em unidade de terapia intensiva. Rev Bras Enferm. 2008;61(2):209-14.
8. Rogenski KE, Fugulin FMT. Índice de segurança técnica da equipe de enfermagem da pediatria. Rev Esc Enferm USP. 2007;41(4):683-9.
9. Matsushita MS, Adami NP, Carmagnani MIS. Dimensionamen-to do pessoal de enfermagem das Unidades de Internação do Hospital São Paulo. Acta Paul Enferm. 2005;18(1):9-19.
10. Nicola AL, Anselmi ML. Dimensionamento de pessoal de en-fermagem em um hospital universitário. Rev Bras Enferm. 2005;58(2):186-90.
11. Fugulin FMT, Gaidzinski RR, Kurcgant P. Ausências previstas e não previstas da equipe de enfermagem das Unidades de In-ternação do HU-USP. Rev Esc Enferm USP. 2003;37(4):109-17.
12. Gaidzinski RR. Dimensionamento de pessoal de enfermagem em insi tuições hospitalares [tese livre-docência]. São Paulo: Escola de Enfermagem, Universidade de São Paulo; 1998.
13. Leitão RER, Kurcgant P. Qualidade na prái ca gerencial da en-fermagem. Niterói: Intertexto; 2004.
14. Donabedian A. Evalución de la calidad de la atención médi-ca. In: White KL, Frank J, editores. Ivesi gaciones sobre ser-vicios de salud: una antologia. Washington: OPAS; 1992. p. 383-404.
15. Organização Mundial de Saúde (OMS). Avaliação dos Pro-gramas de Saúde: normas fundamentais para sua aplicação no processo de gestão para o desenvolvimento nacional na saúde. Genebra; 1981.
16. Joint Commission on Accreditai on of Healthcare Organiza-i ons (JCAHO). Accreditai on manual for hospitals: nursing care standards. Oakbrook Terrace (IL); 1992. p. 79-85.
17. Kurcgant P, Tronchin DM, Melleiro MM. A construção de indicadores de qualidade para a avaliação de recursos hu-manos nos serviços de enfermagem: pressupostos teóricos. Acta Paul Enferm. 2006;19(1):88-91.
18. Programa de Qualidade Hospitalar (CQH). Manual de indicado-res de Enfermagem NAGEH. São Paulo: APM/CREMESP; 2006.
19. Rogenski KE. Tempo de assistência de enfermagem: idenifi -cação e análise em insi tuição hospitalar de ensino [disser-tação]. São Paulo: Escola de Enfermagem, Universidade de São Paulo; 2006.
20. Brant LC, Gomez CM. O sofrimento e seus desi nos na gestão do trabalho. Ciênc Saúde Colei va. 2005;10(4):939-52.