ABSTRACT:Objective: To describe the annual evolution of the prevalence of overweight and obesity in the adult population of the 26 Brazilian state capitals and the Federal District from 2006 to 2012. Methods: Annual interviews (around 54,000 per year) from VIGITEL (Surveillance System of Risk and Protective Factors for Chronic Non-Communicable Diseases through Telephone Interviews) were used. Self-reported weight and height were used to estimate body mass index and nutritional status. Prevalence estimates of overweight and obesity are presented according to gender, age and schooling and to each city. Linear regression model was used to evaluate the time trend of prevalence. Results: Prevalence of overweight in adults in the 27 cities monitored by VIGITEL increased from 43.2% (2006) to 51.0% (2012), with an annual increase rate of 1.37%. Prevalence of obesity increased from 11.6% to 17.4%, with an annual increase rate of 0.89%. The study showed a statistically signiicant increase in the prevalence of overweight in all cities, and for both genders, all age groups and all levels of schooling. Similar trends were also veriied for obesity. Conclusions: If the trends veriied from 2006 to 2012 are maintained, in ten years, around two-thirds of the adults in Brazilian state capitals will be overweight, and a quarter will be obese. This perspective requests urgent response from government and intersectoral actions to combat the obesogenic environment.
Keywords: Overweight. Obesity. Telephone-Based Surveillance System. Chronic disease. Trends. Brazil.
Trends in prevalence of overweight and obesity
in adults in 26 Brazilian state capitals and the
Federal District from 2006 to 2012
Evolução anual da prevalência de excesso de peso e obesidade em adultos nas
capitais dos 26 estados brasileiros e no Distrito Federal entre 2006 e 2012
Deborah Carvalho MaltaI,II, Silvania Caribé AndradeI, Rafael Moreira ClaroIII,IV, Regina Tomie Ivata BernalIV, Carlos Augusto MonteiroIV
IDepartment of Non-Communicable Diseases Surveillance and Health Promotion, Secretariat of Health Surveillance, Ministry
of Health – Brasília (DF), Brasil.
IIDepartamento Materno Infantil e de Saúde Pública, Escola de Enfermagem, Universidade Federal de Minas Gerais –
Belo Horizonte (MG), Brasil.
IIIDepartamento de Nutrição, Escola de Enfermagem, Universidade Federal de Minas Gerais – Belo Horizonte (MG), Brasil.
IVNúcleo de Pesquisas Epidemiológicas em Nutrição e Saúde, Faculdade de Saúde Pública, Universidade de São Paulo –
São Paulo (SP), Brasil.
Corresponding author: Deborah Carvalho Malta. Departamento de Vigilância de Doenças e Agravos Não Transmissíveis e Promoção da Saúde, Secretaria de Vigilância em Saúde, Ministério da Saúde. SAF Sul, Trecho 02, Lotes 05 e 06, Bloco F, Torre I, Edifício Premium, Térreo, Sala 16, CEP: 70070-600, Brasília, DF, Brazil. E-mail: [email protected]
INTRODUCTION
Non-Communicable Diseases (NCD), including cardiovascular diseases, cancer, diabetes mellitus and chronic respiratory diseases, are considered an important public health problem1.
The NCD are associated with several risk factors, especially overweight, unhealthy diet, physical inactivity, excessive consumption of alcoholic beverages and smoking1-3. Estimates
from the World Health Organization (WHO) indicate that, in 2010, the NCD were responsible for 63% of deaths worldwide1.
Excess of weight (including the conditions of overweight and obesity) is the sixth most important risk factor for the global burden of diseases2,3 as for its association with several
NCD, including cardiovascular diseases, such as hypertension and stroke, diabetes, colon, rectum and breast cancer, cirrhosis, gout, osteoarthritis and sleep apnea1,2,4-7. It is estimated
that, currently, one billion adults are overweight worldwide and about 475 million of them are obese5, protruding even more impressive numbers for the next decade5,6. Estimates for
2020 indicate about ive million deaths attributed to overweight1,2.
Home-based nutritional surveys, repeated at various intervals of time, have shown systematic increases in the prevalence of overweight and obesity in many countries around the world1,5,8,9 and, also, in Brazil10.
RESUMO:Objetivo: Descrever a evolução anual da prevalência de excesso de peso e de obesidade na população adulta das capitais dos 26 estados brasileiros e no Distrito Federal entre 2006 e 2012. Métodos: A fonte de dados são entrevistas anuais (cerca de 54 mil ao ano) do sistema VIGITEL (Vigilância de Fatores de Risco e Proteção para Doenças Crônicas por Inquérito Telefônico). Informações autorreferidas de peso e altura foram usadas para calcular o Índice da Massa Corporal e classiicar o estado nutricional. Estimativas da prevalência de excesso de peso e obesidade são apresentadas segundo sexo, idade e escolaridade e, também, para cada cidade. Modelos de regressão linear avaliaram a signiicância estatística da variação temporal nas prevalências. Resultados: A prevalência de excesso de peso na população adulta das 27 cidades monitoradas pelo VIGITEL aumentou de 43,2% (2006) para 51,0% (2012), sendo de 1,37% o incremento anual médio calculado para o período. A prevalência da obesidade aumentou de 11,6% para 17,4%, com incremento anual de 0,89%. Aumento estatisticamente signiicativo na prevalência do excesso de peso foi observado em todas as cidades, nos dois sexos, em todas as faixas etárias e em todos os níveis de escolaridade. Evolução semelhante foi observada para a obesidade. Conclusão: Mantidas as tendências observadas no período entre 2006 e 2012, em dez anos, cerca de dois terços dos adultos nas capitais dos estados brasileiros terão excesso de peso, e cerca de um quarto será obeso, o que demanda urgente resposta do poder público e articulações intersetoriais que tornem o ambiente menos obesogênico.
Since 2006, Brazil has a national system for monitoring risk factors through telephone interviews called Protective and Risk Factors for Chronic Diseases by Telephone Survey – VIGITEL. This system provides annual estimates on the prevalence of overweight and obesity, and several other risk factors for chronic diseases in the adult population of all the capitals of Brazil’s 26 states and the Federal District11.
This study aims at describing the annual evolution of the prevalence of overweight and obesity in the adult population of the capitals of Brazil’s 26 states and the Federal District from 2006 to 2012.
METHODS
All data analyzed in this study come from the VIGITEL system. This system interviews approximately 54 thousand individuals aged 18 years old or older every year, being about two thousand of them in each of the capitals of the 26 Brazilian states and the Federal District. The sampling process of the system is done by cities and in two steps, involving the drawing of random samples of telephone lines and the random selection of one resident aged 18 years old or older by their telephone line. Details about the sampling process of the VIGITEL are provided in the annual reports of the technical system11.
The VIGITEL data analyzed in this study include weight and height reported by the respondents as well as their age, gender and level of schooling/education. In 2012, the VIGITEL performed the imputation of the missing data on weight and height. Initially the variables associated with lack of response, as well as the age, gender, education and race/color were identiied. The resulting model of this process allows the creation of groups of respondents and non-respondents with similar characteristics to the predictors of the condition of non-response. Finally, in every capital, it was selected, randomly, within each group, a person with known information to “donate” their weight or height values for the non-respondent belonging to the same group. Methodological details may be found in another publication11.
All estimates of the VIGITEL are weighted, so that they are representative of the total adult population of each city. The weight initially assigned to each individual respondent to the VIGITEL is the multiplication of two factors: the inverse of the number of telephone lines in the household and the number of adults in the household of the interviewee. This weight, which makes signiicant the estimates of the adult population served by home phone lines, is then multiplied by a second weight, called post-stratiication weight. This second weight aims to equalize the sociodemographic composition of the population served by household telephone lines to the sociodemographic composition of the total adult population of each city in the year of the survey11,12. The calculation of the post-stratiication weight is done
by the rake method11,12 and it considers the variables of gender, age and educational level.
population served by telephone and the same estimates on the city’s total population, the latter obtained from projections based on census data. Details on the process for weighting estimates from VIGITEL, as well as other details of the methodology are provided in the annual publication of its results11.
This study analyzed data on the prevalence of overweight and obesity in adults. It was considered to be overweight the individuals with Body Mass Index (BMI) ≥ 25 kg/m2, and as
obese those with BMI ≥ 30 kg/m2, according to data from the World Health Organization4.
The BMI corresponds to the division of the weight in kilograms by the square of the height in meters. VIGITEL obtains information on weight and height with the questions: “Do you know your weight (even approximately)?” and “Do you know your height?”.
Trend in the prevalence of overweight and obesity was estimated for the whole population of the 27 cities studied, for strata of this population defined by gender, age group (18 to 24, 25 to 34, 35 to 44, 45 to 54, 55 to 64 and 65 years old and older), education (0 to 8 years, 9 to 11 and 12 or more years of schooling), for each city individually and for groups of cities belonging to the same macro-region (North, Northeast, Midwest, South and Southeast).
In order to identify the existence of a linear trend in the temporal variation of the evolution of the indicators, were used linear regression models which consider as a dependent variable the prevalence of overweight or obesity, and each year of the study was used as explanatory variable13. The value of the slope of these models expresses the average annual
change (increase or decrease) in the prevalence of overweight or obesity. It was considered the existence of a signiicant linear trend when the slope of the model was shown to be diferent from zero for a p-value lower than 0.05. Stata statistical software was used for data analysis14. The data collection done by the VIGITEL was approved by the National Ethics
Committee on Human Research.
RESULTS
PREVALENCE OF OVERWEIGHT
Missing-data imputation of weight and height in 2012 for the total of the capitals altered the prevalence of 51.4% without imputation to 51% with imputation (data not shown).
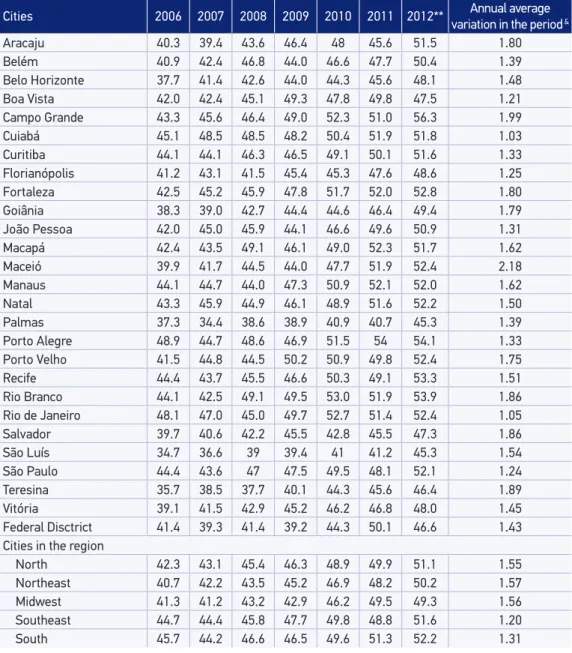
Prevalence of overweight increased signiicantly in all 27 cities covered by the VIGITEL with an average annual growth ranging from just over one percentage point in Belo Horizonte (+1.21%) to just over two percentage points in Maceio (+2.18%). The increases tended to be higher in cities in the North, Northeast and Midwest regions than in cities in the South and Southeast regions, which, in this case also contributed to homogenize the distribution of the prevalence of overweight in Brazil (Table 2).
PREVALENCE OF OBESITY
In the period from 2006 to 2012, the prevalence of obesity in the adult population of the 27 cities covered by the VIGITEL system increased from 11.6% to 17.4%, representing an average increase of 0.89% per year. Signiicant increases were observed for men and women, in all age groups (with the exception of the elderly, where the increase was not constant throughout the period) and at all levels of schooling. The increase in the prevalence of obesity for women was slightly higher, in subjects between 25 and 44 years of age and lower educational levels. According to these trends, in 2012, obesity became more frequent in women than in men (prevalence in both gender were similar in 2006) and have increased
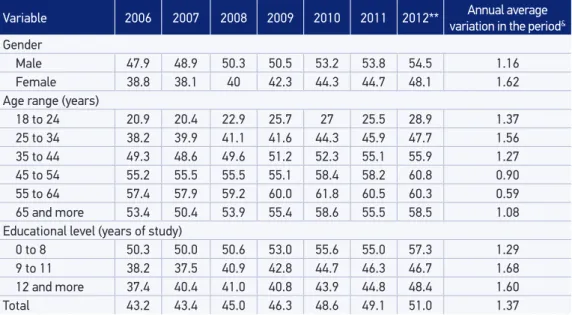
Table 1. Estimates of the prevalence (%) of overweight* in the adult population (≥ 18 years of
age) residing in the capitals of Brazil’s 26 states and the Federal District by gender, age and educational level. VIGITEL, 2006 – 2012.
Variable 2006 2007 2008 2009 2010 2011 2012** variation in the periodAnnual average &
Gender
Male 47.9 48.9 50.3 50.5 53.2 53.8 54.5 1.16
Female 38.8 38.1 40 42.3 44.3 44.7 48.1 1.62
Age range (years)
18 to 24 20.9 20.4 22.9 25.7 27 25.5 28.9 1.37
25 to 34 38.2 39.9 41.1 41.6 44.3 45.9 47.7 1.56
35 to 44 49.3 48.6 49.6 51.2 52.3 55.1 55.9 1.27
45 to 54 55.2 55.5 55.5 55.1 58.4 58.2 60.8 0.90
55 to 64 57.4 57.9 59.2 60.0 61.8 60.5 60.3 0.59
65 and more 53.4 50.4 53.9 55.4 58.6 55.5 58.5 1.08 Educational level (years of study)
0 to 8 50.3 50.0 50.6 53.0 55.6 55.0 57.3 1.29
9 to 11 38.2 37.5 40.9 42.8 44.7 46.3 46.7 1.68
12 and more 37.4 40.4 41.0 40.8 43.9 44.8 48.4 1.60
Total 43.2 43.4 45.0 46.3 48.6 49.1 51.0 1.37
*Self-reported data. Utilized: Body Mass Index ≥ 25 kg/m2. **Imputed Data. &Obtained by linear regression models and
the relative excess of obesity in individuals with low education. The increasing trend of obesity with age was not modiied in the period (Table 3).
The allocation of data on weight and height in 2012 for total capital altered the prevalence of obesity from 17.1% without imputation to 17.4% with imputation (data not shown).
Table 2. Estimates of the prevalence (%) of overweight* among the adult population (≥ 18 years
old) in the cities covered by the VIGITEL system, 2006 – 2012.
Cities 2006 2007 2008 2009 2010 2011 2012** variation in the periodAnnual average &
Aracaju 40.3 39.4 43.6 46.4 48 45.6 51.5 1.80
Belém 40.9 42.4 46.8 44.0 46.6 47.7 50.4 1.39
Belo Horizonte 37.7 41.4 42.6 44.0 44.3 45.6 48.1 1.48
Boa Vista 42.0 42.4 45.1 49.3 47.8 49.8 47.5 1.21
Campo Grande 43.3 45.6 46.4 49.0 52.3 51.0 56.3 1.99
Cuiabá 45.1 48.5 48.5 48.2 50.4 51.9 51.8 1.03
Curitiba 44.1 44.1 46.3 46.5 49.1 50.1 51.6 1.33
Florianópolis 41.2 43.1 41.5 45.4 45.3 47.6 48.6 1.25
Fortaleza 42.5 45.2 45.9 47.8 51.7 52.0 52.8 1.80
Goiânia 38.3 39.0 42.7 44.4 44.6 46.4 49.4 1.79
João Pessoa 42.0 45.0 45.9 44.1 46.6 49.6 50.9 1.31
Macapá 42.4 43.5 49.1 46.1 49.0 52.3 51.7 1.62
Maceió 39.9 41.7 44.5 44.0 47.7 51.9 52.4 2.18
Manaus 44.1 44.7 44.0 47.3 50.9 52.1 52.0 1.62
Natal 43.3 45.9 44.9 46.1 48.9 51.6 52.2 1.50
Palmas 37.3 34.4 38.6 38.9 40.9 40.7 45.3 1.39
Porto Alegre 48.9 44.7 48.6 46.9 51.5 54 54.1 1.33
Porto Velho 41.5 44.8 44.5 50.2 50.9 49.8 52.4 1.75
Recife 44.4 43.7 45.5 46.6 50.3 49.1 53.3 1.51
Rio Branco 44.1 42.5 49.1 49.5 53.0 51.9 53.9 1.86
Rio de Janeiro 48.1 47.0 45.0 49.7 52.7 51.4 52.4 1.05
Salvador 39.7 40.6 42.2 45.5 42.8 45.5 47.3 1.86
São Luís 34.7 36.6 39 39.4 41 41.2 45.3 1.54
São Paulo 44.4 43.6 47 47.5 49.5 48.1 52.1 1.24
Teresina 35.7 38.5 37.7 40.1 44.3 45.6 46.4 1.89
Vitória 39.1 41.5 42.9 45.2 46.2 46.8 48.0 1.45
Federal Disctrict 41.4 39.3 41.4 39.2 44.3 50.1 46.6 1.43
Cities in the region
North 42.3 43.1 45.4 46.3 48.9 49.9 51.1 1.55
Northeast 40.7 42.2 43.5 45.2 46.9 48.2 50.2 1.57
Midwest 41.3 41.2 43.2 42.9 46.2 49.5 49.3 1.56
Southeast 44.7 44.4 45.8 47.7 49.8 48.8 51.6 1.20
South 45.7 44.2 46.6 46.5 49.6 51.3 52.2 1.31
*Self-reported data. Utilized: Body Mass Index ≥ 25 kg/m2. **Imputed Data. &Obtained by linear regression models and
Prevalence of obesity increased signiicantly in all the cities covered by the VIGITEL except in Belém and in the Federal District, where the increases were not regular over the period. The average annual growth ranged from almost half a percentage point in Belém (0.43%) to almost one and a half percentage point in Rio Branco (+1.37%), without signiicant variations between the regions (Table 4).
DISCUSSION
Estimates presented in this study and calculated from annual data VIGITEL between 2006 and 2012 in the capital cities of 26 Brazilian states and the Federal District document the extent and intensity of the obesity epidemic in Brazil. Systematic increases in the proportion of overweight adults were observed in all the cities monitored, in both gender, at all ages and at all levels of schooling. A similar situation characterizes the evolution of the proportion of obese people.
The obesity epidemic is a global phenomenon and its causes are complex, including changes in the environment which result in an increased consumption of processed foods of high caloric density and in a decreased energy expenditure due to the low levels of physical activity of the population4,5.
Table 3. Estimates of the prevalence (%) of obesity* in the adult population (≥ 18 years) resident in the capitals of Brazil’s 26 states and the Federal District by gender, age and educational level. VIGITEL, 2006 – 2012.
Variable 2006 2007 2008 2009 2010 2011 2012** Annual average
variation in the period& Gender
Male 11.4 13.5 13.4 13.7 14.4 15.4 16.5 0.72
Female 11.8 12.1 13.5 14.0 15.4 16.1 18.2 1.04
Age range (years)
18 to 24 4.2 4.0 4.4 6.2 5.1 5.7 7.5 0.5
25 to 34 10.0 10.9 11.1 11.3 12.3 13.5 15.1 0.78
35 to 44 12.4 14.7 14.9 15.4 16.2 18.9 19.7 1.23
45 to 54 16.0 19.1 18.3 17.3 21.4 21.1 22.6 0.96
55 to 64 17.4 19.5 20.9 21.2 20.1 20.5 23.4 0.69
65 and more 16.0 13.3 17.4 17.0 19.4 17.6 19.0 0.70 Educational level (years of study)
0 to 8 15.1 16.1 17.3 17.5 18.7 19.3 21.7 0.99
9 to 11 9.2 10.8 11.0 12.0 13.1 14.3 15.2 0.97
12 and more 8.7 9.9 10.3 10.6 11.9 12.9 14.4 0.88
Total 11.6 12.8 13.4 13.8 14.9 15.8 17.4 0.89
*Utilized: Body Mass Index ≥ 30 kg/m2. **Imputed Data. &Obtained by linear regression models and statistically
National household surveys in Brazil in 2002 – 2003 and in 2008 – 2009 conirm the trend of the rapidly increasing prevalence of overweight and obesity in adults, and also in adolescents, being interesting to note that the national prevalence among adults observed in the survey conducted in 2008 – 2009 were close to the prevalence estimated by VIGITEL in the 27 cities monitored by the system10,15.
Table 4. Estimates of the prevalence (%) of obesity in the adult population (≥ 18 years) in the cities covered by VIGITEL system, 2006 – 2012.
Cities 2006 2007 2008 2009 2010 2011 2012** Annual average
variation in the period&
Aracaju 13.0 11.0 13.9 15.4 15.2 15.2 18.0 0.88
Belém 12.8 13.6 13.3 12.4 15.4 13.6 16.1 0.43
Belo Horizonte 8.9 11.0 11.8 12.3 12.3 13.9 14.5 0.83
Boa Vista 12.1 12.2 14.6 13.8 14.2 14.9 15.1 0.50
Campo Grande 11.9 15.3 14.1 16.5 16.9 18.0 21.0 1.27
Cuiabá 13.0 14.0 14.5 14.8 18.7 17.8 19.2 1.09
Curitiba 12.6 13.3 13.8 12.9 17.0 15.6 16.3 0.67
Florianópolis 10.1 11.3 11.4 13.0 14.3 15.0 15.7 0.97
Fortaleza 12.0 13.7 15.4 15.5 16.7 18.3 18.8 1.10
Goiânia 9.9 11.4 11.2 11.5 12.7 13.5 14.0 0.64
João Pessoa 13.7 12.6 14.4 13.4 14.8 15.6 19.9 0.89
Macapá 13.7 16.2 14.3 14.6 17.1 19.5 17.6 0.75
Maceió 13.0 12.2 14.1 13 14.8 18.0 19.9 1.18
Manaus 13.5 12.8 14.9 15.7 17.4 19.1 19.6 1.19
Natal 13.1 13.1 12.5 13.8 15.9 15.6 21.2 1.17
Palmas 9.3 8.7 10.4 9.5 13.3 13.0 15.7 1.09
Porto Alegre 12.8 12.7 15.3 14.3 15.1 18.1 18.4 0.98
Porto Velho 12.8 15.3 13.5 18.0 16.3 17.2 18.9 0.89
Recife 12.3 11.8 13.8 13.5 17.5 15.5 17.7 0.98
Rio Branco 12.5 13.0 14.6 15.6 17.3 17.6 21.3 1.37
Rio de Janeiro 12.8 14.2 13.0 16.6 16.3 17.4 19.5 1.06
Salvador 9.8 12.8 12.2 14 12.4 14.1 14.1 0.56
São Luís 9.0 9.6 9.8 10.6 12.0 12.7 13.2 0.75
São Paulo 11.5 13.2 14.4 13.7 14.9 15.3 17.8 0.84
Teresina 9.5 11.1 10.8 12.0 13.1 12.7 15.0 0.79
Vitória 9.7 12.0 11.0 12.0 14.3 14.0 15.5 0.88
Federal Disctrict 10.7 10.3 12.2 9.4 10.7 14.4 14.3 0.63 Cities in the region
North 12.9 13.3 14.0 14.4 16.3 16.7 18.0 0.87
Northeast 11.4 12.3 13.2 13.8 14.7 15.5 17.1 0.89
Midwest 10.9 11.7 12.5 11.5 13.0 15.0 15.7 0.77
Southeast 11.5 13.2 13.6 14.4 15.0 15.8 17.9 0.92
South 12.4 12.8 14.2 13.4 15.9 16.5 17.1 0.83
*Self-reported data. Utilized: Body Mass Index ≥ 30 kg/m2. **Imputed Data. &Obtained by linear regression models and
Multilevel analysis on the prevalence of obesity in the country have described the spread of obesogenic environments in all capitals16, becoming indispensable the development of
public policies and local actions towards the confronting of this epidemic.
In this sense, Brazil launched in 2011 the Brazilian Strategic Action Plan to Combat Chronic Non-Communicable Diseases (Plano de Ações Estratégicas para o Enfrentamento das Doenças Crônicas Não Transmissíveis)2011 – 202217,18, besides also having ongoing initiatives which include
a national intersectoral plan for the prevention and control of obesity. These initiatives involve actions and policies of food and nutrition education, including the revision of the Food Guide for the Brazilian Population (Guia Alimentar para a População Brasileira), the Programa Saúde na Escola, intersectoral public policies in the ield of food and nutrition security, promotion and supply of healthy foods in school settings, structuring actions of nutrition in primary care in the Sistema Único de Saúde, promotion of physical activity in the community, creating the Programa Academia da Saúde19 and regulatory and food control actions. These actions and
policies seek to provide an intersectoral response able to halt and even reverse the epidemic rise of overweight and obesity in the country20.
The use of self-reported measures may be seen as a limitation of the study. However, several studies attest to the validity of this strategy21,22. Additionally, although the methodology
for data collection may inluence the absolute values of the estimated prevalence for each of the years, it should not inluence the observed trends over time, since any efects of under or overestimation of prevalence will be constant over time.
Another limitation of this study is inherent to the methodology used by VIGITEL, which interviews only individuals living in households that have a landline. This problem, as was seen, is minimized by the use of weighting factors which equalized, each year, the sociodemographic characteristics of the sample studied by the VIGITEL to the characteristics of the total population of adults residing in the 27 cities monitored by the system11,12.
From 2012, the VIGITEL started using another method of post stratiication (rake)12 and
new population estimates from the 2010 Census. So then, the prevalence estimated here of overweight and obesity difer from the previously published data reports from VIGITEL, between 2006 and 2011, but are in accordance with the estimates of 2012’s11. The weight
and height data were imputed only in 2012, but showed little variation from the original data and did not change the trend.
CONCLUSION
Therefore, the challenges to stop the growth of obesity and overweight are great, with goals set by the Plano de Ações Estratégicas para o Enfrentamento das Doenças Crônicas Não Transmissíveis in Brazil18. This efort requires a joint and integrated action of the diferent
sectors of society as well as its active participation20.
1. Organização Mundial de Saúde. Global status report on noncommunicable diseases 2010. Geneva: WHO; 2011. 2. Organização Mundial de Saúde. Diet, Nutrition and
the Prevention of Chronic Diseases. Report FAO/ WHO Expert Consultation. WHO Technical Report Series, No. 916 (TRS 916). Geneva: WHO; 2003. 3. Organização Mundial de Saúde. WHO global strategy
on diet, physical activity and health. Food Nutr Bull 2004; 25(3): 292-302.
4. Obesity: preventing and managing the global epidemic. Report of a who Consultation. World Health Organ Tech Rep Ser 2000; 894:i-xii, 1-253.
5. International Association for the Study of Obesity. Adult overweight and obesity in the European Union (EU27). London: IASO; 2012. Disponível em: http://www. iaso.org/resources/world-map-obesity/ (Acessado em novembro de 2013).
6. Ravussin E, Smith SR. Increased fat intake, impaired fat oxidation, and failure of fat cell proliferation result in ectopic fat storage, insulin resistance, and type 2 diabetes mellitus. Ann N Y Acad Sci 2002; 967: 363-78. 7. Moura EC, Claro RM. Estimates of obesity trends in
Brazil, 2006-2009. Int J Public Health 2012; 57(1): 127-33 8. Ogden CL, Yanovski SZ, Carroll MD, Flegal KM. The epidemiology of obesity. Gastroenterology 2007; 132(6): 2087-102.
9. Schokker DF, Visscher TL, Nooyens AC, van Baak MA, Seidell JC. Prevalence of overweight and obesity in the Netherlands. Obes Rev 2007; 8(2): 101-8. 10. Brasil. Instituto Brasileiro de Geograia e Estatística. Pesquisa
de orçamentos familiares 2008-2009: antropometria e estado nutricional de crianças, adolescentes e adultos no Brasil. Rio de Janeiro: IBGE; 2010.
11. Brasil. Ministério da Saúde. Secretaria de Vigilância em Saúde. VIGITEL. Brasil 2012: Vigilância de fatores de risco e proteção para doenças crônicas por inquérito telefônico. Brasília: Ministério da Saúde, 2013. 12. Izrael D, Hoaglin DC, Battaglia MP. A SAS macro
for balancing a weighted sample. Proceedings of the
twenty-ifth annual SAS users group International Conference, Paper 275; 2000.
13. Latorre MRDO, Cardoso MRA. Análise de séries temporais em epidemiologia: uma introdução sobre os aspectos metodológicos. Rev Bras Epidemiol 2001; 4(3): 145-52 14. Stata Corporation. Stata Statistical Software: Release
12.1 [computer program]. College Station: Stata Corporation.
15. Monteiro CA, Conde WL. A evolução da altura e do índice de massa corporal de crianças, adolescentes e adultos brasileiros, no período de 1974 a 2007. In: Saude Brasil. Brasília: Ministério da Saúde; 2009. p. 267-80. 16. Sichieri R, Moura EC. Análise multinível das variações
no índice de massa corporal entre adultos, Brasil, 2006. Rev Saúde Pública 2009; 43(Supl 2): 90-7.
17. Malta DC, Morais Neto OL, Silva Júnior JB. Apresentação do plano de ações estratégicas para o enfrentamento das doenças crônicas não transmissíveis no Brasil, 2011 a 2022. Epidemiol Serv Saúde 2001; 20(4):425-38. 18. Brasil. Ministério da Saúde. Plano de ações estratégicas
para o enfrentamento das doenças crônicas não transmissíveis (DCNT) no Brasil, 2011-2022. Brasília: Ministério da Saúde; 2011.
19. Malta DC, Silva Júnior JB. Policies to promote physical activity in Brazil. Lancet 2012; 380(9838): 195-6. 20. Jaime PC, Silva AC, Gentil PC, Claro RM, Monteiro
CA. Brazilian obesity prevention and control initiatives. Obes Rev 2013; 14(2): 88-95.
21. Connor Gorber S, Tremblay M, Moher D, Gorber B. A comparison of direct vs. self-report measures for assessing height, weight and body mass index: a systematic review. Obes Rev 2007; 8(4): 307-26. 22. Peixoto MR, Benício MH, Jardim PC. Validade do peso
e altura referidos: o estudo de Goiânia. Rev Saúde Pública 2006; 40(6): 1065-72.
Received on: 01/14/2014
Final version presented on: 04/08/2014 Accepted on: 05/09/2014