O
ri
gi
na
l
a
rt
ic
le
s
Risk and protective factors for the development of chronic diseases in a
rural elderly population in Rio Grande do Sul
Andréia Focchesatto1,2
Fernanda Camboim Rockett1
Ingrid D. Schweigert Perry1,3
1 Universidade Federal do Rio Grande do Sul, Centro de Estudos em Alimentação e Nutrição, Hospital
de Clínicas de Porto Alegre. Porto Alegre, RS, Brasil.
2 Secretaria Municipal de Educação de Nova Bassano. Nova Bassano, RS, Brasil.
3 Universidade do Extremo Sul Catarinense, Unidade Acadêmica de Ciências da Saúde, Programa de
Pós-graduação em Saúde Coletiva. Criciúma, SC, Brasil.
Correspondence Ingrid D. Schweigert Perry
Centro de Estudos em Alimentação e Nutrição (CESAN) – Hospital de Clínicas de Porto Alegre/Centro de Pesquisa Clínica – prédio 21 – sala 21307
Rua Ramiro Barcelos, 2350 Porto Alegre-RS, Brasil. CEP 90035-903 E-mail: [email protected]
Abstract
Objective: to verify risk and protective factors for the development of chronic diseases among elderly persons living in the rural area of Linha Senador Ramiro, in Nova Bassano, Rio Grande do Sul. Methods:a cross-sectional censitary-based study was conducted of 70 male and female subjects aged 60 years or over. The subjects were interviewed through a questionnaire and anthropometrically evaluated (weight, height and waist circumference (WC)). The risk factors considered were: smoking, excess weight, intake of saturated fat, physical inactivity and excessive alcohol consumption. The protective factors were: physical activity during leisure time, consumption of fruits and vegetables, and cancer prevention. Results:the population was composed of 70 elderly persons,with a mean age of 70.4 ± 7.8 years. A total of 65.7% of the sample were women,57.1%considered their health “normal”, 72.3% said they were not sedentary and, among women, 78.3 and 47.8% performed mammography and Pap screening, respectively. The prevalence of excess weight was 55.9% and 76.5% of individuals were at increased risk of cardiovascular and metabolic diseases, according to waist circumference. Hypertension was the most prevalent chronic disease (64.3%). The prevalence of daily consumption of vegetables and fruit was 85.7% and 68.6%, respectively; wine, 54.3%, pork fat and queijo colonial (a local cheese) 75.7%, respectively, and homemade bread 87.1%. A total of 7.1% of the population said they smoked.
Conclusions:the risk factors identified were high intake of saturated fat, excess weight and a high waist circumference. The protective factors were regular consumption of fruit and vegetables, low rates of physical inactivity and smoking, regular and moderate consumption of wine and preventive examinations. Further studies can assess the true association of these factors with the occurrence of cardiovascular and cerebrovascular events.
INTRODUCTION
The intensity and speed of the growth of the elderly population1 has had a heterogeneous impact
on the Brazilian health sector and economy2,3
in different regions.3 Interactions between
socioeconomic and environmental factors, as well physical and mental health conditions, affect the quality of life of elderly individuals and consequently, their morbidity and mortality.4
Aging has been correlated with a greater prevalence of chronic diseases and disabilities and the use of health services tends to increase in this phase of life.5 While non-communicable chronic
diseases (NCCD) are predominant in advancing age, a reduction in malnutrition and an increase in obesity have also been highlighted as two of the most notable indicators of the nutritional change that is taking place in Brazil.6 This transition has
been observed in both urban and rural areas.7
As well as excess body weight, studies have correlated several of the most common NCCDs with an increase in risk factors, including smoking, excessive alcohol consumption, high blood pressure (hypertension), hypercholesterolemia, a low consumption of fruit and vegetables and a sedentary lifestlye.7 The transformation of the
eating habits of rural dwellers is mainly due to the urbanization of rural areas, which has led to an increase in the consumption of industrialized products that are rich in sugar and fat.8 The
abandonment of subsistence production has also led to cultural erosion in relation to nourishment, with the gradual replacement of a varied diet, rich in nutrients, by urban style eating habits.8
Schmidt et al.9 indicated that NCCDs have
become a priority for the Brazilian health sector. In 2007, 72% of the deaths recorded were attributed to NCCDs. The predominance of deaths related to NCCDs is significant in the elderly population.10
The municipality of Nova Bassano is located in the northeast of the Brazilian state of Rio Grande do Sul (RS) and was the focus of Italian immigration. It has a geographic area of 225 km2, of which 208
km2 are considered rural areas.11 According to the
IBGE demographic census,12 approximately 49%
of the 8840 inhabitants registered in 2010 were female. Of the 1413 individuals in the municipality aged 60 years or more, approximately 38% live in rural areas.12 The area known as Linha Senador
Ramiro contains 94 families, distributed among three rural communities: Santo Antônio; Botafogo and Caravágio. This area contains 70 elderly individuals (24 men and 46 women).
Considering the lack of population-based Brazilian studies that have analyzed risk or protection factors for chronic diseases in rural areas, as well as the fact that these factors are preventable and poorly monitored,7 there is a need
for studies that contribute to the development of healthcare policies for this segment of the population.
The aim of the present study was to determine the prevalence of risk and protection factors for the development of non-communicable chronic diseases in the elderly rural population of the municipality of Nova Bassano/RS.
METHODS
This cross-sectional census-based study included 70 individuals aged 60 years or more (men and women) who lived in Linha Senador Ramiro in the rural zone of Nova Bassano, RS, Brazil.
Recruitment for the present study involved prior telephone contact to schedule a visit. Data collection was performed between August and September 2009 using a questionnaire, which was applied on an individual basis by a researcher in the home of the elderly individual, as well as an anthropometric assessment. The VIGITEL13
questionnaire was used to assess risk and protection factors, considering their significance to the total load of the disease, as estimated by the WHO for the Americas.14 The following risk factors were
a sedentary lifestyle; and excessive consumption of alcoholic beverages. The following were considered as protection factors: the performance of physical activities during leisure time; the consumption of fruit and vegetables; and cancer prevention checks.13 Due to the specific work activities of this
population, agricultural work was considered as a physical activity.
The sociodemographic (gender, age, marital status, education level and ethnicity) and clinical variables (self-reported morbidity, bowel habits, self-assessment of their health status and cancer prevention) were both obtained using the VIGITEL questionnaire.13 Concerning cancer
prevention, indicators related to access to health services that can provide an early diagnosis of cancer (mammography and pap smear) were used for women, while an indicator that assessed protection against ultraviolet radiation was used for both men and women (the proportion of individuals that do not expose themselves to the sun’s rays for more than 30 minutes per day or who use sunscreen and/or a hat/umbrella and adequate clothing).13
In order to assess the behavioral variables (smoking, consumption of alcoholic beverages and physical activity), all individuals who smoked (regardless of the frequency and intensity) were considered smokers. Those who had smoked in the past were considered ex-smokers. Alcohol consumption was considered “abusive” if the individual had consumed more than four or five alcoholic drinks (for women and men, respectively) on a single occasion in the previous 30 days.13
Physical activity, including agricultural work (due to the specific work activities of this population), travelling to work and domestic tasks, were classified using the term “walks a lot”. Physical activity during leisure hours was defined as going out to walk or run or attend a gymnasium (gymnastics, bodybuilding) for at least 30 minutes a day at least five days a week. Individuals were considered to be physically inactive if: they did no physical activity during leisure hours in the
previous three months; they did not exert intense physical effort during their work; they did not carry heavy things; they did not travel to work on foot or by bicycle; and they did not perform cleaning activities in their own home.13
The nourishment patterns correlated with the occurrence of NCCDs were analyzed using indicators for the consumption of food found in the VIGITEL questionnaire,13 which incorporated
questions deemed relevant for the characteristics of the rural population in the region. The knowledge of the researcher, who was from the same community, was used as a basis. Indicators of the consumption of healthy food (fruit and vegetables) and unhealthy food (fatty red meat, chicken with skin, whole milk and soft drinks) were also used.
Anthropometric measurements (height, weight and waist size) were recorded by a trained analyst, using a specific protocol.15 Bedridden
and functionally-dependent individuals were not assessed anthropometrically due to the logistical difficulties related to collecting this data and the equipment available. Height was measured using a portable stadiometer (Sanny®, São Bernando
do Campo, São Paulo – SP, Brazil). Weight was measured using digital platform scales, with a maximum capacity of 150 kg and 100 g precision (Plenna®). The body mass index (BMI) was
calculated using the following formula: weight (kg) ÷ stature (m)2, considering the Lipschitz
criteria.16 Waist size was measured using an inelastic
measuring tape with 0.1 cm precision (Sanny®),
which was placed on the narrowest part of the torso. The cutoff points used were taken from the International Diabetes Federation,17 which
considers a waist size of 94 cm (for men) and 80 cm (for women) to be a sign of an increased risk of cardiovascular diseases and metabolic complications, and the National Cholesterol Education Program,18 which considers a waist
The data was analyzed using SPSS (version 18.0) software and displayed as absolute and relative frequencies for the risk and protection factors of chronic diseases in the population.13 In
the descriptive analysis, the categorical variables were displayed as frequencies and percentages, whereas the continuous variables were displayed as mean and standard deviation values. The
chi-squared test (χ2) was used to calculate correlations
between the genders and the students t-test was used to compare the mean values. The level of significance was set at 5%.
The present study received approval from the Research Ethics Committee of the Universidade
Federal do Rio Grande do Sul (UFRGS) under
protocol number 2008050/2009. All of the participants signed a free and informed consent form. This project was also approved by the Secretaria Municipal da Saúde (Municipal Health Secretary) of Nova Bassano, RS.
RESULTS
The population studied herein contained 70 individuals, which represents all of the elderly residents of Linha Senador Ramiro.
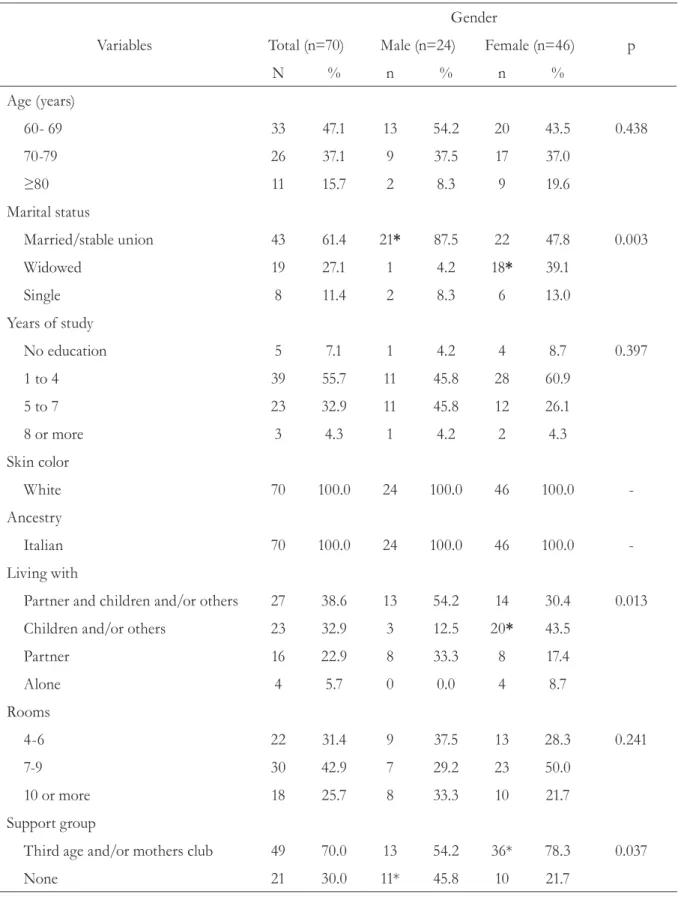
Table 1 displays the sociodemographic variables collected. In total, 47.1% of the population were aged between 60 and 69 years and 65.7% of the population were female. Expressive percentages were also recorded for women aged 80 years or more (19.6%) and widows (39.1%). All of the elderly individuals interviewed claimed to have Italian ancestry and 70% participated in community groups (Clubs for the Elderly, Mothers’ Club or both).
Table 1. Distribution of frequency of the sociodemographic variables according to the gender of the elderly individuals in Linha Senador Ramiro. Nova Bassano. RS. 2009.
Variables
Gender
Total (n=70) Male (n=24) Female (n=46) p
N % n % n %
Age (years)
60- 69 33 47.1 13 54.2 20 43.5 0.438
70-79 26 37.1 9 37.5 17 37.0
≥80 11 15.7 2 8.3 9 19.6
Marital status
Married/stable union 43 61.4 21* 87.5 22 47.8 0.003
Widowed 19 27.1 1 4.2 18* 39.1
Single 8 11.4 2 8.3 6 13.0
Years of study
No education 5 7.1 1 4.2 4 8.7 0.397
1 to 4 39 55.7 11 45.8 28 60.9
5 to 7 23 32.9 11 45.8 12 26.1
8 or more 3 4.3 1 4.2 2 4.3
Skin color
White 70 100.0 24 100.0 46 100.0
-Ancestry
Italian 70 100.0 24 100.0 46 100.0
-Living with
Partner and children and/or others 27 38.6 13 54.2 14 30.4 0.013
Children and/or others 23 32.9 3 12.5 20* 43.5
Partner 16 22.9 8 33.3 8 17.4
Alone 4 5.7 0 0.0 4 8.7
Rooms
4-6 22 31.4 9 37.5 13 28.3 0.241
7-9 30 42.9 7 29.2 23 50.0
10 or more 18 25.7 8 33.3 10 21.7
Support group
Third age and/or mothers club 49 70.0 13 54.2 36* 78.3 0.037
None 21 30.0 11* 45.8 10 21.7
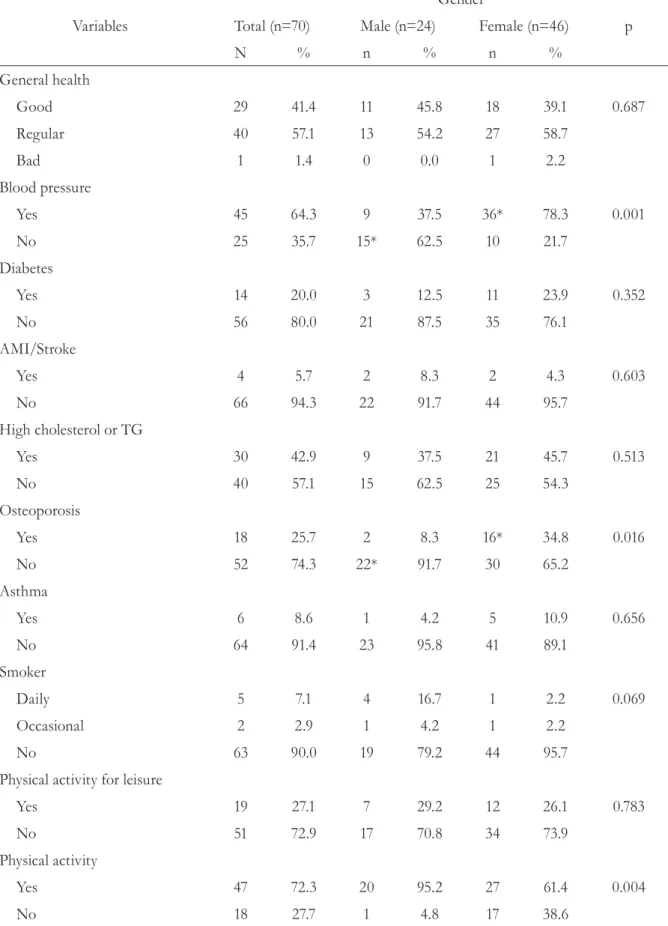
Table 2. Distribution of the frequency of clinical variables according to the gender of the elderly individuals in Linha Senador Ramiro. Nova Bassano. RS. 2009.
Variables
Gender
Total (n=70) Male (n=24) Female (n=46) p
N % n % n %
General health
Good 29 41.4 11 45.8 18 39.1 0.687
Regular 40 57.1 13 54.2 27 58.7
Bad 1 1.4 0 0.0 1 2.2
Blood pressure
Yes 45 64.3 9 37.5 36* 78.3 0.001
No 25 35.7 15* 62.5 10 21.7
Diabetes
Yes 14 20.0 3 12.5 11 23.9 0.352
No 56 80.0 21 87.5 35 76.1
AMI/Stroke
Yes 4 5.7 2 8.3 2 4.3 0.603
No 66 94.3 22 91.7 44 95.7
High cholesterol or TG
Yes 30 42.9 9 37.5 21 45.7 0.513
No 40 57.1 15 62.5 25 54.3
Osteoporosis
Yes 18 25.7 2 8.3 16* 34.8 0.016
No 52 74.3 22* 91.7 30 65.2
Asthma
Yes 6 8.6 1 4.2 5 10.9 0.656
No 64 91.4 23 95.8 41 89.1
Smoker
Daily 5 7.1 4 16.7 1 2.2 0.069
Occasional 2 2.9 1 4.2 1 2.2
No 63 90.0 19 79.2 44 95.7
Physical activity for leisure
Yes 19 27.1 7 29.2 12 26.1 0.783
No 51 72.9 17 70.8 34 73.9
Physical activity
Yes 47 72.3 20 95.2 27 61.4 0.004
No 18 27.7 1 4.8 17 38.6
AMI= acute myocardial infarction; TG= triglycerides.
In total, 22.8% of the elderly individuals had smoked in the past. Data concerning current habits is displayed in Table 2. Notably, the majority of the population were non-smokers.
Concerning annual examinations for cancer of the cervix and breasts, 47.8% of the women performed a cervical smear test and 78.3% had a mammogram.
Upon analysis of the risk factor exposure to the sun’s rays, 91.3% (n=42) of the women claimed to use some form of protection when exposed to the sun for more than 30 minutes. Thirty-seven (88.1%) used a hat and five (11.9%) used sunscreen and a hat. With the exception of one women who did not protect herself, none of the women exposed
themselves to the sun for more than 30 minutes. As for the men, 95.8% (n=23) only used a hat for protection.
A sedentary lifestyle was relatively rare in this population, with 72.3% claiming to walk regularly while performing their activities of daily living (Table 2). Concerning bowel habits, 78.3% of the women and 95.8% of the men classified their movements as daily.
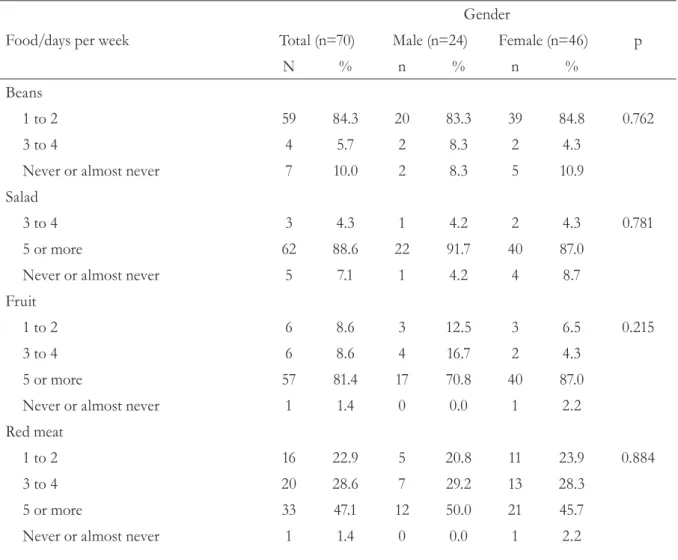
An expressive percentage of the population regularly consumed fruit and vegetables. Of these, 88.6% consumed salad (generally raw) and 81.4% consumed fruit on five or more days of the week. However, most of the interviewees only ate beans once or twice a week (Table 3).
Table 3. Distribution of the frequency of consumption of dietary variables from the Vigitel questionnaire
according to the gender of the elderly individuals in Linha Senador Ramiro.Nova Bassano. RS. 2009.
Food/days per week
Gender
Total (n=70) Male (n=24) Female (n=46) p
N % n % n %
Beans
1 to 2 59 84.3 20 83.3 39 84.8 0.762
3 to 4 4 5.7 2 8.3 2 4.3
Never or almost never 7 10.0 2 8.3 5 10.9
Salad
3 to 4 3 4.3 1 4.2 2 4.3 0.781
5 or more 62 88.6 22 91.7 40 87.0
Never or almost never 5 7.1 1 4.2 4 8.7
Fruit
1 to 2 6 8.6 3 12.5 3 6.5 0.215
3 to 4 6 8.6 4 16.7 2 4.3
5 or more 57 81.4 17 70.8 40 87.0
Never or almost never 1 1.4 0 0.0 1 2.2
Red meat
1 to 2 16 22.9 5 20.8 11 23.9 0.884
3 to 4 20 28.6 7 29.2 13 28.3
5 or more 33 47.1 12 50.0 21 45.7
The consumption of red meat, although distributed among the categories of frequency, was concentrated in the five or more days per week section (Table 3), with 13.3% of the women and 41.7% of the men unconcerned about the consumption of visible fat. Chicken was consumed up to twice a week by the majority of the individuals (78.6%), with 28.2% of the women and 56.3% of the men consuming it with its skin. The consumption of meat with visible fat and chicken with skin was
correlated with gender, given that men consumed a considerably greater amount of both than women.
In total, 64.3% of the population studied claimed to drink milk on five or more days of the week (Table 3). Of the 35 women who drank milk (76.1%), only five drank the skimmed variety, because of its altered lipid profile. The remainder consumed non-pasteurized whole milk. Of the 15 men who drank milk (62.6%), only one consumed
Food/days per week
Gender
Total (n=70) Male (n=24) Female (n=46) p
N % n % n %
Meat x visible fat
Removes excess fat 49 71.0 11 45.8 38* 84.4 0.003
Eats meat with fat 16 23.2 10* 41.7 6 13.3
Does note at meat with fat 4 5.8 3 12.5 1 2.2
Chicken
1 to 2 55 78.6 16 66.7 39 84.8 0.080
Never or almost never 15 21.4 8 33.3 7 15.2
Chicken x skin
Removes the skin 35 63.6 7 43.8 28* 71.8 0.050
Eats with the skin 20 36.4 9* 56.3 11 28.2
Milk
1 to 2 2 2.9 1 4.2 1 2.2 0.610
3 to 4 3 4.3 1 4.2 2 4.3
5 or more 45 64.3 13 54.2 32 69.6
Never or almost never 20 28.6 9 37.5 11 23.9
Soft drinks
1 to 2 35 50.0 9 37.5 26 56.5 0.277
3 to 4 1 1.4 0 0.0 1 2.2
5 or more 4 5.7 1 4.2 3 6.5
Never or almost never 30 42.9 14 58.3 16 34.8
Alcohol
1 to 2 4 8.7 1 4.8 3 12.0 0.005
3 to 4 2 4.3 0 0.0 2 8.0
5 or more 38 82.6 20* 95.2 18 72.0
Never or almost never 26 37.1 3 12.5 23* 50.0
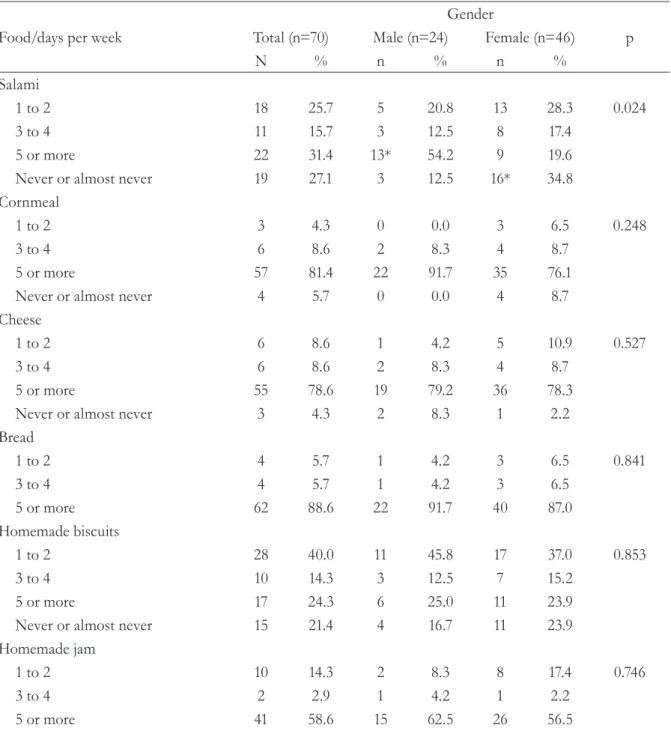
Table 4. Distribution of the frequency of consumption of other dietary variables according to the gender of the elderly individuals in Linha Senador Ramiro. Nova Bassano. RS. 2009.
Food/days per week
Gender
Total (n=70) Male (n=24) Female (n=46) p
N % n % n %
Salami
1 to 2 18 25.7 5 20.8 13 28.3 0.024
3 to 4 11 15.7 3 12.5 8 17.4
5 or more 22 31.4 13* 54.2 9 19.6
Never or almost never 19 27.1 3 12.5 16* 34.8
Cornmeal
1 to 2 3 4.3 0 0.0 3 6.5 0.248
3 to 4 6 8.6 2 8.3 4 8.7
5 or more 57 81.4 22 91.7 35 76.1
Never or almost never 4 5.7 0 0.0 4 8.7
Cheese
1 to 2 6 8.6 1 4.2 5 10.9 0.527
3 to 4 6 8.6 2 8.3 4 8.7
5 or more 55 78.6 19 79.2 36 78.3
Never or almost never 3 4.3 2 8.3 1 2.2
Bread
1 to 2 4 5.7 1 4.2 3 6.5 0.841
3 to 4 4 5.7 1 4.2 3 6.5
5 or more 62 88.6 22 91.7 40 87.0
Homemade biscuits
1 to 2 28 40.0 11 45.8 17 37.0 0.853
3 to 4 10 14.3 3 12.5 7 15.2
5 or more 17 24.3 6 25.0 11 23.9
Never or almost never 15 21.4 4 16.7 11 23.9
Homemade jam
1 to 2 10 14.3 2 8.3 8 17.4 0.746
3 to 4 2 2.9 1 4.2 1 2.2
5 or more 41 58.6 15 62.5 26 56.5
the skimmed variety, with the other 14 consuming non-pasteurized whole milk.
Regular consumption (five or more days of the week) of non-dietary soft drinks was not common in this population, with 50% of the sample only drinking them once or twice a week, usually on weekends (Table 3).
Of those who drank alcohol, 72.0% of the women and 95.2% of the men stated that they
drank every day or almost every day. A correlation was found between the male gender and this high frequency of alcohol consumption (Table 3). The drink in question was generally a glass of red wine with lunch and another with dinner.
Food/days per week
Gender
Total (n=70) Male (n=24) Female (n=46) p
N % n % n %
Never or almost never 17 24.3 6 25.0 11 23.9
Sweet foods
1 to 2 43 61.4 13 54.2 30 65.2 0.224
3 to 4 2 2.9 1 4.2 1 2.2
5 or more 2 2.9 2 8.3 0 0.0
Never or almost never 23 32.9 8 33.3 15 32.6
Candy
1 to 2 17 24.3 6 25.0 11 23.9 0.481
3 to 4 1 1.4 1 4.2 0 0.0
5 or more 1 1.4 0 0.0 1 2.2
Never or almost never 51 72.9 17 70.8 34 73.9
Industrial products
1 to 2 22 31.4 7 29.2 15 32.6 0.372
3 to 4 4 5.7 3 12.5 1 2.2
5 or more 6 8.6 2 8.3 4 8.7
Never or almost never 38 54.3 12 50.0 26 56.5
Fried food
1 to 2 32 45.7 10 41.7 22 47.8 0.603
3 to 4 12 17.1 6 25.0 6 13.0
5 or more 11 15.7 4 16.7 7 15.2
Never or almost never 15 21.4 4 16.7 11 23.9
Lard
1 to 2 3 4.3 1 4.2 2 4.3 0.690
3 to 4 2 2.9 0 0.0 2 4.3
5 or more 54 77.1 20 83.3 34 73.9
Never or almost never 11 15.7 3 12.5 8 17.4
Oils
1 to 2 1 1.4 0 0.0 1 2.2 0.529
3 to 4 1 1.4 0 0.0 1 2.2
5 or more 66 94.3 24 100.0 42 91.3
Never or almost never 2 2.9 0 0.0 2 4.3
Eggs
1 to 2 29 41.4 11 45.8 18 39.1 0.156
3 to 4 11 15.7 6 25.0 5 10.9
5 or more 4 5.7 2 8.3 2 4.3
Never or almost never 26 37.1 5 20.8 21 45.7
Fish
1 to 2 17 24.3 6 25.0 11 23.9 0.920
Never or almost never 53 75.7 18 75.0 35 76.1
Vegetable oil was used on five or more days of the week by 94.3% of the population. Lard was used by 77.1% (Table 4) as a basic ingredient in all of their food preparation, including homemade bread. Vegetable oil was used by the majority to add flavor to salad. Soy was the most common choice. Only a small number of the elderly women, who tended to worry more about their health, used olive oil (data not shown). Fried food was consumed up to twice a week by 45.7% of the interviewees (Table 4). The most common preparations were breaded steak, fried eggs and omelets (known as “fortaia” in the Italian dialect), which are often consumed with dinner (data not shown).
The consumption of industrialized products, generally industrial tomato paste, was infrequent among the participants. In fact, more than half never used these products (Table 4).
In total, 75.7% stated that they rarely or never ate fish (Table 4).
Sago and pudding were the most popular sweet products consumed by the participants, of whom 61.4% admitted eating sweet products once or twice a week. Candy was hardly ever eaten by this group of individuals.
The mean daily consumption of water was 4.74±2.82 glasses/day (approximately 800 ml) while the mean daily consumption of mate was 3.53±5.44 gourds.
The female participants exhibited significantly higher BMI values than the men, and more than half of the population were overweight (again, mostly female). The prevalence of underweight individuals (16.2%) was more common among the male participants (Table 5).
Table 5. Distribution of the anthropometric variables according to the gender of the elderly individuals
in Linha Senador Ramiro. Nova Bassano. RS. 2009.
Variables Total (n=68) Male (n=23) Female (n=45)
Mean ± standard deviation or n (%) p
Body mass index (kg/m2) 27.4 ± 4.7 24.9 ± 3.7 28.6 ± 4.7 0.002
<22 11 (16.2) 7 (30.4)* 4 (8.9) 0.021
>22 and <27 19 (27.9) 8 (34.8) 11 (24.4)
>27 38 (55.9) 8 (34.8) 30 (66.7)*
Waist circumference (cm) 91.7 ± 9.8 91.8 ± 11.4 91.7 ± 9.0 0.987
<80 (F) and <94 (M) 16 (23.5) 12 (52.2)* 4 (8.9) <0.001
≥80 and ≥94 52 (76.5) 11 (47.8) 41(91.1)*
<88 (F) and <102 (M) 37 (54.4) 19 (82.6)* 18 (40.0) 0.001
≥88 and ≥102 31 (45.6) 4 (17.4) 27 (60.0)*
Pearson’s test χ2 to associate the variables between genders and the Student´s t-test to compare the mean values; *indicates the correlation found.
Although BMI values correlated with high
blood pressure in the present study (p=0.003; χ2
test), there was only a tendency to correlate with
DM (p=0.051; χ2 test) and there was no correlation
at all with dyslipidemia.
Concerning waist size, most of the participants exhibited an elevated risk for cardiovascular and metabolic diseases. This risk is significantly higher among women.17 Less than half of the population
were considered to exhibit a high risk waist size, with an expressively higher value for women, according to the National Cholesterol Education Program18 (Table 5).
DISCUSSION
All elderly residents in the Linha Senador Ramiro community were assessed in the present study, including two bedridden and functionally-dependent individuals. Similar to the study conducted by Morais, Rodrigues & Gerhardt19 in
the rural area of Encruzilhada do Sul, there was a predominance of women in this research, with expressive figures among those aged 80 years or more. The feminization of the elderly population (greater proportion of women than men) has been previously described by Salgado.20
In the present study, 100% of the participants claimed to have Italian ancestry. All of them were white, reflecting their European origins and the characteristics of immigration in the region. According to the IBGE,12 83.2% of the population
of the state of Rio Grande do Sul are white.
The presence of elderly individuals who did not attend school or did so for a reduced number of years (particularly women) could be due to the cultural and social values that were prevalent in the first half of the 20th century, when women assumed a domestic role, as well as the difficulties encountered in gaining access to the educational system at that time.21
Concerning social relationships, the high percentage (70%) of elderly individuals who participated in community groups was also similar to previous studies. According to Missio
& Portela,22 who assessed elderly individuals in
rural communities in Campos Borges (RS), many elderly individuals find a new way of growing old in community groups, which demonstrates the relevance of this type of familiarity. The small number of elderly individuals who lived alone in the present study were female and widows. Previous studies have also noted that widows tend to stay single for the remainder of their lives.19,20 This
trend is similar among urban elderly individuals, with 25.3% of elderly women and 13.8% of men living alone.23
Considered a valid and relevant indicator of the general health of a population, the self-assessment of health status has been correlated with objective measurements of morbidity and the use of services, thereby representing a powerful predictor of mortality. However, it is limited by the fact that it can be affected by social and cultural contexts. This assessment is widely used in health surveys and produces a global classification of health status that can identify signs and symptoms of diseases (whether diagnosed or not by the health professional), as well as the impact these diseases have on the physical, mental and social wellbeing of the individuals.13 The perception among the
elderly individuals assessed in the present study confirmed a regular health status in 57.1% of the population. This result was quite similar to that found in another rural community in RS, where 46.7% of the population considered their health to be regular.19 Estimated frequencies of individuals
who reported a previous medical diagnosis of a risk factor may have been affected by the extent of the health service existing in each location. This can lead to underestimations or overestimations of the real prevalence of the risk factor in a population. Nevertheless, they provide useful data for the assessment of the demand for healthcare services due to the presence of the factor.13
High blood pressure, which was the most commonly reported morbidity in the population studied, was significantly more expressive in women. This finding is supported by studies in other rural communities in RS, which identified similar aspects. Morais, Rodrigues & Gerhardt19
Michelon & Moriguchi24 studied individuals aged
80 years or more in Veranópolis and recorded a greater prevalence of high blood pressure among women than among men. Similar results were reported by Scherer,25 who found an elevated
prevalence of high blood pressure among rural and urban elderly individuals in Marques de Souza, RS.
D y s l i p i d e m i a , p a r t i c u l a r l y hypercholesterolemia, was the second most prevalent disease in the present study. The results for men were similar to the prevalence rates reported by Silva,26 although women reported
approximately half of the prevalence found by the same author (22%),26 who used data from an
Elderly Persons Group in Agudo, RS (rural and urban). The prevalence of osteoporosis was also more commonly reported by the elderly women in Linha Senador Ramiro (34.8%). These values were close to WHO figures27 (one third of white women
aged 65 years or more suffer from osteoporosis). However, the prevalence of diabetes (20%) was higher than that reported in an extensive study of urban elderly dwellers (11.9% claimed to have diabetes).28 A notable positive in the results of
the present study was the low prevalence of acute
myocardial infarctions (AMI) and strokes.
Concerning the indicators for access to services that provide an early diagnosis of cancer, there was a high prevalence of mammograms, similar to a study involving elderly urban dwellers.29 However,
the examination that prevents cervical cancer, which is performed by 86% of elderly women in urban areas,29 was only performed by 47.8% of
the elderly women in Linha Senador Ramiro. This could be due to the fact that the present study dealt with rural residents, who had less information about this type of examination and were more prone to feelings of shame/modesty.
Concerning protection against ultraviolet radiation, the use of sunscreen and/or a hat/ umbrella and adequate clothes is considered effective.13 Since the present study was conducted
in a rural community where the main activities revolve around agriculture and livestock, it is clear that the residents are frequently exposed to open air and sunlight. The men in particular, appear
not to protect themselves sufficiently, given that almost all of them only use a hat, which only partially covers the body. Chorilli et al30 studied
a rural population in Piracicaba, São Paulo (not discriminating age groups) and recorded a high frequency of men (79%) who never used sunscreen. In the same study, although the women knew about sunscreen products, 52% never used them.
Smoking indicators identified a previous habit among a significant percentage of the population (22.8%). However, the frequency of smokers reduced drastically to close to 10%. These results are similar to those reported by Morais, Rodrigues & Gerhardt,19 who identified 11.7% of the third
age as smokers.
Despite the fact that many of the participants did not perform physical activities in their leisure time, a sedentary lifestyle was rare, due to the involvement in typically rural activities on a daily basis, by both men and women.
Data about the eating habits of elderly Brazilians, particular in rural areas, remains scarce due to the great regional diferences found in the country. The focus of the present study, which used indicators for the consumption of healthy and unhealthy food, led to the generation of characteristics that are somewhat specific for this community (and other communities with a population that is mostly of Italian origin).
Concerning the performance of practices considered healthy (frequency of consumption of fruit and vegetables), the WHO1 recommends
the consumption of at least 400 grams of fruit and vegetables per day (five portions). The VIGITEL13
only 20.6% of women and 14.8% of men consume five or more portions of fruit and vegetables per day. Upon stratification of the rural area however, including individuals with less than 65 years of age, 21.9% and 30.2% consume fruit and vegetables on a daily basis in rural areas, whereas 35.8% and 47.6% consume fruit and vegetables on a daily basis in urban areas. 31 Conversely, the consumption of
beans once or twice a week by the individuals in the present study differed greatly from other studies, which reported the daily consumption of beans.32
The low consumption rates for fish are in line with other communities of Italian settlers, who, according to Budó,33 have a diet that is based on
red meat. Food production in the area is based on poultry, livestock and pig farming. A significant percentage of the participants, particularly men, were not concerned about the ingestion of visible fat on meat. This confirms the fact that women pay more attention to their health than men in the region. The consumption of this type of meat, together with non-pasteurized whole milk (possibly produced by the individuals themselves) and the use of lard in cooking is indicative of the consumption of saturated fats. Although vegetable oil is used on a daily basis, it is done so in a measured manner.
Only 1.4% of the population abused alcohol 13
and in general, the residents of this community do not drink excessively. The daily consumption of red wine by almost all of the participants reflects the rural life of Italian immigrants and is considered a positive (protective) aspect.34 The phenolic
compounds present in the wine, particularly flavonoids, possess a potent antioxidant capacity and act as atherogenic agents. These properties were discovered as a result of the “French paradox” (the low rate of mortality by cardiovascular disease in populations with elevated consumption rates for saturated fats and red wine).35 This correlation
also applied to the elderly population in Linha Senador Ramiro. The consumption of red wine by the participants of the present study (among other factors) contributes to the low rates of cardiovascular and cerebrovascular events among these individuals, despite the fact that they consume an elevated quantity of saturated fats. Conversely,
one of the factors that could be linked to the high blood pressure found in this population is the consumption of salami and homemade cheese, which is rich in sodium and saturated fat.
The satisfactory bowel function reported by the participants could be associated with the adequate consumption of water and fiber, particularly from fruit and vegetables, and the low prevalence of a sedentary lifestyle.
Other positive aspects included the low consumption of industrialized products (generally restricted to industrial tomato paste), the low consumption of soft drinks (usually only consumed on weekends) and the extremely rare consumption of candy (limited to homemade sweets such as pudding and sago).
Budó33 analyzed Italian colonization in a rural
community of Silveira Martins/RS and identified several characteristics that are similar to those of the present study, including the following: the preparation of sweet homemade products, such as pudding and sago; the use of natural tomato paste, jams, lard, pork, beet, poultry, conservatives, bread, pasta, salami and cheese. In the population studied, the ease of access to certain products considered protection factors (red wine, fruit and vegetables) favored a regular and elevated consumption of the same and reduced the consumption of industrialized products (usually rich in sodium and/or saturated or trans fats). However, the production and consumption of sausages, pork lard (in practically all meals), meat with visible fat and whole milk could contribute to the risk factors. This combination leads to the following question: can the consumption of non-industrialized products and the homemade production that is characteristic of this population be considered a protection or risk factor for the development of chronic diseases? A combination of all of these aspects could explain the apparent paradox between the risk factors and the scarcity of cerebrovascular and cardiovascular events in this population.
Ramiro is not greatly influenced by industrialized products, suggesting that the urbanization of rural areas has not yet reached this community. Instead, this area has conserved traditions from the Italian colonization of the region, which differ from the indications of the urbanization of rural regions.8
Despite these positive aspects, including the absence of a sedentary lifestyle, excess body weight and obesity (particularly among women) and the deposition of abdominal fat (also more expressive among women), among other negative factors, are a concern. According to Budó,33 women are
overloaded with work as they alone perform domestic tasks, while also caring for animals, crops and gardens. They also often help out in the fields, especially during planting. As well as the different trends of the deposition of body fat between the genders, 36 there may be a mismatch
between energy needs and intake, despite the positive and healthy aspects of their diet.
Several studies have shown the predominance of excess weight among elderly individuals, although they used BMI cutoff points for adults. Dos Santos & Sichieri37 assessed elderly
individuals in the urban area of Rio de Janeiro and recorded a greater proportion of overweight individuals and an inadequate distribution of fat among the women (the waist size of the women was approximately double that of the men). Da Cruz et al.38 confirmed a prevalence of 23.3%
for obesity in a sample of elderly individuals in Veranópolis. Campos et al39 conducted studies
in the Northeast and Southeast of Brazil and recorded a value of 50.4% for eutrophy, while also reporting that the greatest rates of obesity were found among women, similar to the present study. According to VIGITEL 2007,13 of the
combined population of individuals aged 65 years or more in all Brazilian state capitals, 11.2% of the men and 20.5% of the women were obese. While this data is similar to the present study for male participants, when considering women
with a BMI ≥ 30, the percentage is far more
expressive in this study (37.7%). Scherer25 studied
the elderly population in the municipality of Marques de Souza, RS (using adult BMI cutoff
points) and found a prevalence of overweight and obese individuals of 57% (men) and (64%) for women (only 3% of the population were classified as thin). The present study corroborates the reduction of malnutrition and the significant increase in obesity as important characteristics of the nutritional transition in Brazil, 6 including
rural areas. 7
Although the questionnaire used herein is widely used, the fact that the assessment of outcome variables (morbidity) was performed by self-report is a limitation of the present study, as is its cross-sectional design, which only provided descriptive aspects. However, the assessment of food consumption was comprehensive, with the use of the questionnaire of frequency and the inclusion of food/preparations that are common in the population studied.
CONCLUSION
REFERENCES
1. Organização Mundial da Saúde. Obesidade: prevenindo e controlando a epidemia global. São Paulo: Roca; 2004.
2. Chaimowicz F. A saúde dos idosos brasileiros às vésperas do século XXI: problemas, projeções e alternativas. Rev Saúde Pública 1997;31(2):184-200. 3. Parahyba MI, Veras R, Melzer D. Incapacidade
funcional entre as mulheres idosas no Brasil. Rev Saúde Pública 2005;39(3):383-91.
4. Rautio N, Heikkinen E, Heikkinen RL. The association of socio-economic factors with physical and mental capacity in elderly men and women. Arch Gerontol Geriatr 2001;33(2):163-78.
5. Travassos C, Viacava F. Acesso e uso de serviços de saúde em idosos residentes em áreas rurais, Brasil, 1998 e 2003. Cad Saúde Pública 2007;23(10):2490-2502. 6. Marques APO, Arruda IKG, Do Espírito Santo ACG,
Raposo MCF, Guerra MD, Sales TF. Prevalência de obesidade e fatores associados em mulheres idosas. Arq Bras Endocrinol Metab 2005;49(3):441-8. 7. Monteiro CA, De Moura EC, Jaime PC, Lucca A,
Florindo AA, Figueiredo ICR, et al. Monitoramento de fatores de risco para doenças crônicas por entrevistas telefônicas. Rev Saúde Pública 2005;39(1):47-57.
8. Balem TA, Silveira PR. A erosão cultural alimentar: processo de insegurança alimentar na agricultura familiar [Internet]. Porto Alegre: Universidade Federal Santa Maria, 2002 [acesso em 15 mar. 2015]. Grupo de Pesquisa Sociedade, Ambiente e Desenvolvimento Rural. Disponível em: http://www. ufsm.br/desenvolvimentorural/textos/artigo%20 erosao%20alimentar.pdf
9. Schmidt MI, Duncan BB, Silva GA, Menezes AM, Monteiro CA, Barreto SM, et al. Doenças crônicas não transmissíveis no Brasil: carga e desafios atuais [Internet]. London: Lancet; 2011 [acesso em jul. 2014]. Disponível em: http://download.thelancet.com/ flatcontentassets/pdfs/brazil/brazilpor4.pdf 10. Quintella LCM. Qualidade de vida e estado
nutricional de idosos: um estudo descritivo sobre freqüentadores do Centro de Práticas Esportivas da Universidade de São Paulo [dissertação]. São Paulo: Universidade de São Paulo, Programa de Pós-Graduação: Interunidades em Nutrição Humana Aplicada; 2006.
11. Empresa de Assistência Técnica e Extensão Rural. Título ?. Nova Bassano: EMATER; 2009.
12. Instituto Brasileiro de Geografia e Estatística. Rio de Janeiro: IBGE; [1995- ]. Censo Demográfico 2010: características da população e dos domicílios: resultados do universo [Internet]; 2010; [acesso em 16 mar. 2015]; [11 telas]. Disponível em: http://www. ibge.gov.br/home/estatistica/populacao/censo2010/ caracteristicas_da_populacao/tabelas_pdf/tab1.pdf 13. Brasil. Secretaria de Vigilância em Saúde, Secretaria
de Gestão Estratégica e Participativa. VIGITEL BRASIL 2007: vigilância de fatores de risco e proteção para doenças crônicas por inquérito telefônico... . Brasília, DF: IBGE; 2008. (Série G); (Estatística e Informação em Saúde).
14. World Health Organization. World Health Report 2002: Reducing risks, promoting healthy life [Internet]. Geneva: WHO; 2002 [acesso em 1 mar. 2015]. Disponível em: http://whqlibdoc.who.int/ publications/2002/9241562072.pdf
15. Brasil. Ministério da Saúde. Vigilância Alimentar e Nutricional – SISVAN. Orientações básicas para a coleta, o processamento, a análise de dados e a informação em serviços de saúde [Internet]. Brasília, DF: Ministério da Saúde; 2004 [acesso em 5 mar. 2015]. Disponível em: http://bvsms.saude.gov.br/bvs/ publicacoes/orientacoes_basicas_sisvan.pdf
16. Lipschitz DA. Screening for nutritional status in the elderly. Prim Care 1994;21(1):55-67.
17. International Diabetes Federation (IDF). The IDF consensus worldwide definition of the metabolic syndrome [Internet]. Brussels: IDF; 2006 [acesso em 7 mar. 2015]. Disponível em: https://www.idf.org/ webdata/docs/IDF_Meta_def_final.pdf
18. National Cholesterol Education Program. Executive summary of the third report of the National Cholesterol Education Program (NCEP) Expert Panel on Detection, Evaluation, And Treatment of High Blood Cholesterol In Adults (Adult Treatment Panel III). JAMA 2001;285(19):2486-97.
19. Morais EP, Rodrigues RAP, Gerhardt TE. Os idosos mais velhos no meio rural: realidade de vida e saúde de uma população do interior gaúcho. Texto & Contexto Enferm 2008;17(2):374-83.
21. Meireles VC, Matsuda LM, Coimbra JAH, Mathias TAF. Características dos idosos em área de
abrangência do Programa Saúde da Família na região noroeste do Paraná: contribuições para a gestão do cuidado em enfermagem. Saúde Soc 2007;16(1):69-80. 22. Missio M, Portella MR. Atenção aos idosos rurais
no contexto da família: um desafio para a equipe do programa saúde da família. Bol Saúde 2003;17(2):25-36. 23. Lebrão ML, Laurenti R. Saúde, bem-estar e
envelhecimento: o estudo SABE no município de São Paulo. Rev Bras Epidemiol 2005;8(2):127-41.
24. Michelon E, Moriguchi EH. Características da distribuição dos lipídeos plasmáticos e dos fatores de risco coronariano em indivíduos com 80 anos ou mais. Rev Med PUCRS 1996;6:13-23.
25. Scherer F. Estado nutricional e sua associação com fatores de risco cardiovascular e síndrome metabólica em idosos [dissertação]. Porto Alegre: Pontifícia Universidade Católica do Rio Grande do Sul, Instituto de Geriatria e Gerontologia; 2008. 26. Da Silva EB. Estudo do perfil lipídico de um grupo
de idosos. NewsLab 2005;72:142-50. 27. World Health Organization. Assessment of
fracture risk and its application to screening for postmenopausal osteoporosis: report of a WHO study group. WHO Tech Rep Ser 1994;843:1-129.
28. Viegas-Pereira APF, Rodrigues RN, Machado CJ. Fatores associados à prevalência de diabetes auto-referido entre idosos de Minas Gerais. Rev Bras Estud Popul 2008;25(2):365-76.
29. Novaes CO, Mattos IE. Prevalência e fatores associados a não utilização de mamografia em mulheres idosas. Cad Saúde Pública 2009;25 Supl 2:310-20.
30. Chorilli M, Otto T, Alves MIF, Cavallini ME, Leonardi GR. Avaliação do uso de protetores solares pela população rural de Piracicaba, São Paulo, Brasil,
através da aplicação de questionário. Rev Bras Farm 2007;88(4):167-72.
31. Jaime PC, Monteiro CA. Fruit and vegetable intake by brazilian adults, 2003. Cad Saúde Pública 2005;21 Supl 1:19-24.
32. Instituto Brasileiro de Geografia e Estatística. Pesquisa de orçamentos familiares 2008-2009: análise do consumo alimentar pessoal no Brasil [Internet]. Rio de Janeiro: IBGE; 2011 [acesso 10 mar 2015]. Disponível em: http://www.ibge.gov.br/home/estatistica/ populacao/condicaodevida/pof/2008_2009_analise_ consumo/pofanalise_2008_2009.pdf
33. Budó MLD. O antigo e o novo: o cuidado em saúde no cotidiano de uma cultura italiana. Cogitare Enferm 1996;1(2):27-34.
34. De Oliveira FAM. Padrões alimentares em mudança: a cozinha italiana no interior paulista. Rev Bras Hist 2006;26(51):47-62.
35. Giehl MR, Dal Bosco SM, Laflor CM, Weber B. Eficácia dos flavonóides da uva, vinho tinto e suco de uva tinto na prevenção e no tratamento secundário da aterosclerose. Sci Med 2007;17(3):145-55.
36. Tchernof A, Després JP. Pathophysiology of human visceral obesity: an update. Physiol Rev 2013;93(1):359-404.
37. Dos Santos DM, Sichieri R. Índice de massa corporal e indicadores antropométricos de adiposidade em idosos. Rev Saúde Pública 2005;39(2):163-8. 38. Da Cruz IBM, Almeida MSC, Schwanke CHA,
Moriguchi EH. Prevalência de obesidade em idosos longevos e sua associação com fatores de risco e morbidades cardiovasculares. Rev Assoc Med Bras 2004;50(2):172-7.
39. Campos MAG, Pedroso ERP, Lamounier JA, Colosimo EA, Abrantes MM. Estado nutricional e fatores associados em idosos. Rev Assoc Med Bras 2006;52(4):214-21.