ABSTRACT: Objective: To analyze the association between perceptions of neighborhood safety (PNS) and
screen time among adolescents and to assess the moderating efects of sex, age and socioeconomic status. Methods: A cross‑sectional study with school survey was conducted in Curitiba, Brazil. First, six schools (three public and three private) were intentionally selected. Next, one class within each educational level (from the sixth year of elementary school to the third year of high school) was randomly selected. PNS was assessed using a NEWS‑Y scale, and daily screen time was deined as the time spent watching TV/videos/ DVDs, playing video games and using the Internet. Multinomial logistic regression models were used to test the association between PNS and screen time, adjusting for the confounding variables. Results: The sample included 776 adolescents (boys and girls), aged between 11 and 18 years old. Perceived crime was associated with time playing video games among older teenagers (p < 0.05). Pedestrian and traic safety was inversely associated with time playing video games among adolescents with high socioeconomic status (p < 0.05). Conclusion: The association between PNS and screen time is complex among adolescents and varies according to sociodemographic variables and the screen time outcome (TV/videos/DVDs, video games and the Internet). Keywords: Perception. Sedentary lifestyle. Adolescents. Gender. Age groups. Socioeconomic status.
Perception of neighborhood safety and
screen time in adolescents from Curitiba, Brazil
Percepção de segurança no bairro e tempo despendido
em frente à tela por adolescentes de Curitiba, Brasil
Crisley Vanessa PradoI,II, Cassiano Ricardo RechII,III, Adriano Akira Ferreira HinoII, Rodrigo Siqueira ReisII,IV,V
ICentro Universitário Autônomo do Brasil – Curitiba (PR), Brazil.
IIGraduate program in Health Technology, Pontifícia Universidade Católica do Paraná, Campus Curitiba – Curitiba (PR), Brazil. IIICenter of Sports, Federal University of Santa Catarina – Florianopolis (SC), Brazil.
IVGraduate Program in Physical Education, Universidade Federal do Paraná – Curitiba (PR), Brazil. VPrevention Research Center, Brown School, Washington University – St. Louis, MO, United States.
Corresponding author: Crisley Vanessa Prado. Centro Universitário Autônomo do Brasil. Curso de Graduação em Educação Física. Rua Konrad Adenauer, 442, Tarumã, CEP: 82821-020, Curitiba, PR, Brasil. E-mail: [email protected]
INTRODUCTION
Time spent in front of screens, which includes watching television, playing video games, and using the computer or Internet, is a common sedentary activity among ado‑ lescents1,2. Currently in Brazil, 79.5% of adolescents aged between 12 and 14 years spend
over two hours a day on these activities3. Evidence indicates a positive association between
this behavior and obesity, diabetes and low levels of physical itness in adolescents4‑6.
There is also indication that this behavior increases throughout adolescence. For exam‑ ple, in a longitudinal study with 4,218 adolescents, an average increase of 60 minutes/ day per year in the screen time in adolescents aged 11 and 15 years was observed; and this increase was associated with body adiposity7. In addition, this behavior is more likely to
continue into adulthood8.
Given this context, there is a growing interest in understanding the aspects that afect screen time, particularly aspects from the community environment9‑12, and especially public
safety and traic. In fact, the perception of neighborhood safety related to crimes and traf‑ ic has an inverse association with sedentary behavior among young people11‑13. This rela‑
tionship is also observed when parents perceive that their the neighborhood is unsafe9,10.
These indings may be partly explained by the absence of safe walking places, as it reduces the adolescent’s physical activity going to and from home, and induces the adolescent to spend more time doing sedentary activities14,15. Such aspects may be even more important
in the Brazilian context, since crime rates and traic‑related deaths16‑18 are among the high‑
est in the world.
To date, studies on the association between perceived safety and time spent by adoles‑ cents in front of the screen (watching TV/videos/DVDs, playing video games or using the
RESUMO: Objetivo: Analisar a associação entre a percepção de segurança (PS) no bairro e o tempo despendido
em frente à tela pelos adolescentes e veriicar o papel moderador das variáveis sexo, idade e nível socioeconômico nessa relação. Métodos: Trata‑se de um estudo transversal, com inquérito escolar realizado em Curitiba, Paraná. Inicialmente foram selecionadas, de modo intencional, seis escolas (três públicas e três privadas), e em seguida foi sorteada uma turma de cada período de ensino (sexto ano do ensino fundamental ao terceiro ano do ensino médio). A PS foi avaliada com a escala NEWS-Y, e o tempo diário despendido em frente à tela foi deinido por aquele passado diante da televisão/vídeo/DVD, jogando videogame e utilizando a internet. Modelos de regressão logística multinomial foram utilizados para testar a associação entre a PS e essa atividade, ajustando para as variáveis moderadoras. Resultados: Participaram do estudo 776 adolescentes, com idade entre 11 e 18 anos. A PS relacionada aos crimes foi associada com o uso de videogame por adolescentes mais velhos, no sentido contrário ao esperado (p < 0,05). A PS relacionada ao tráfego de pedestres foi associada inversamente ao uso de videogame por adolescentes de maior nível socioeconômico (p < 0,05). Conclusão: A associação entre PS e tempo despendido em frente à tela é complexa para os adolescentes e difere em relação às variáveis sociodemográicas e o desfecho analisado (televisão/vídeo/DVD, videogame e internet).
internet) have not been identiied in the country. Greater attention was observed in the associations between time spent watching TV, and less attention was given to other behav‑ iors like playing videogames and using the Internet, which presented a high prevalence in this population19.
Likewise, the moderating role of sociodemographic variables in the relationship between safety and time spent by adolescents in front of screens is also not well demon‑ strated. However, these variables are believed to exhibit diferences in the screen‑related behaviors of the population subgroups. Considering some scientiic articles, there is a greater possibility for boys to play videogames in unsafe places11. In addition, younger
female adolescents with a higher income reported a lower perceived safety20,21. Moreover, it
is believed that socioeconomic level is an important variant to be considered, since peo‑ ple with a higher income feel more unsafe in their neighborhood, possibly because those neighborhoods are more attractive to criminals22. Identifying subgroups that are more
exposed to the efect of insecurity can improve the understanding of this complex rela‑ tionship, especially considering the role of sociodemographic aspects, which have not yet been explored.
Thus, this study aimed to:
1. analyze the association between the perception of neighborhood security and screen time, including time spent watching television/videos/DVDs, playing videogames and suring the internet;
2. verify the moderating role of sociodemographic variables such as gender, age and socioeconomic level in this relationship.
METHODS
POPULATION AND STUDY DESIGN
This is a cross‑sectional study that was conducted between September and October of 2012. The participants were adolescents aged between 11 and 18 years, of both sexes, from Curitiba, Paraná, Brazil. All procedures were approved by the Human Research Ethics Committee of the Pontifícia Universidade Católica do Paraná (Protocol No. 93.664/12).
The most recent estimates suggest that Curitiba has around 269,505 adolescents aged between 10 and 19 years, evenly distributed in terms of gender (50.5% boys). According to data from the Brazilian Institute of Geography and Statistics (Instituto Brasileiro de Geograia e Estatística, IBGE), the number of students enrolled in primary and secondary education in 2012 was 234,215 and 81,614, respectively23. Most students, from both the elementary
were chosen from the elementary and middle schools in Curitiba, Paraná. This criterion was adopted in order to include students from the region that belongs to both the highest and lowest socioeconomic classes. In the second stage, all schools that met the following criteria were eligible:
1. having at least one grade between the sixth year of elementary school and the third year of high school in the daytime;
2. having at least 20 students in each class.
Thereby, it was decided to randomly select one teaching period at each school among the eligible classes. Finally, 42 classes and an estimated total of 1,344 adoles‑ cents were selected. However, a sample of 1,081 adolescents (54% girls) was obtained during the collection.
STUDY VARIABLES
For data collection, an instrument composed of three sessions was applied:
1. sociodemographic information;
2. perception of the neighborhood environment;
3. sedentary behavior.
The instrument was applied at school and during the classes with the permission of the school board and conducted by a team of three trained evaluators.
Screen time was analyzed based on the time spent watching television/videos/DVDs daily, in addition to playing videogames and using the Internet. This did not include school hours or weekend days. Participants were asked how many minutes per day they spent on these activities. The response was obtained on an ordinal scale of seven points (none, 15 minutes, 30 minutes, 1 hour, 2 hours, 3 hours, ≥ 4 hours). This proce‑ dure has been used in similar studies to analyze screen time24. For analysis purposes,
responses were grouped into three levels: up to 15 minutes; from 30 minutes to 1 hour; 2 hours or more.
Perceptions of traffic and crime‑related safety were assessed using the Neighborhood Environment Walkability Scale for Youth (NEWS‑Y)25. The scales that were related to
traffic safety and crime were translated and adapted to the Brazilian context and its final version presented adequate conceptual and semantic equivalence26. Perceptions
on traffic safety were evaluated using eight items related to vehicle traffic and pedes‑ trians in the neighborhood. Safety from crimes in the neighborhood was evaluated through seven items and using a four‑point ordinal scale ranging from “totally dis‑ agree” to “totally agree”.
through a protocol suggested by the Brazilian Association of Research Companies (Associação Brasileira das Empresas de Pesquisa–ABEP), which considers the possession of items at home and categorize families into the seven economic (A1, A2, B1, B2, C1, C2, D and E)27.
For this study participants were grouped into three categories: high (class A1 + A2), middle (class B1 + B2) and low (class C1 + C2 + D + E).
DATA ANALYSIS
The description of the study variables was performed by means of descriptive statistics according to the measurement scale of each variant. Quantitative variables were described by mean and standard deviation, while qualitative variables were determined by means of the absolute and relative frequency distribution. In order to conirm the main components of each NEWS‑Y scale, an exploratory factorial analysis was performed with traic and crime‑related safety perception scales.
The bivariate association between the variables gender, age and SES was measured using the χ2 test for proportions. The multivariate association of the variables gender,
age, SES, safety perception and the three categories of time of sedentary behaviors (up to 15 minutes, from 30 minutes to 1 hour, and 2 hours or more) was examined using mul‑ tinomial logistic regression analysis, as the data did not conirm previous assumptions to allow ordinal logistic regression to be performed. In the multivariate analysis, all vari‑ ables were inserted into the model. The odds ratio (OR) was estimated from the associ‑ ation between independent variables (perception of crime‑related safety, vehicle traic and pedestrian traic), inserted in the model as continuous variables (standardized factor load) and interpreted as the cause of increase of the OR and for the increase of a standard deviation in the standard factorial load.
Furthermore, the interaction between the independent variables (perception of crime‑re‑ lated safety, vehicular traic and pedestrian traic) was tested with the variables gender (male = 0 versus female = 1), age (11–14 years = 0 versus 15 to 18 years = 1) and socioeco‑ nomic level (“C”, “B” and “A”). To this end, a term was created to describe the interaction between the independent variables and the potential moderating variables (gender, age and SES) by means of the product between them. SES was converted into two dummy variants to identify participants with socioeconomic status “B” and “A”. The interaction terms were inserted into the adjusted model for the other potential confounding variables. All analyzes were performed using the statistical package STATA, version 11.0, and adopting a signii‑ cance level of p < 0.05.
RESULTS
Items
Descriptive analysis
Conirmatory Factor
Analysis
A SD F1 F2 F3
Is there a lot of traic on the streets near your neighborhood? 2.5 1.0 0.09 0.63 - 0.32
Is the speed of traic in the surrounding areas less than 40 km/h? 2.4 1.0 - 0.10 0.61 0.16
Do drivers drive above the speed limit? 2.3 0.9 0.01 0.68 0.20
Are the streets of your neighborhood well lit at night? 2.7 1.0 0.14 0.12 0.70
Can pedestrians and cyclists be seen easily? 2.7 1.0 0.02 0.09 0.53
Are there pedestrian lanes and traic signs? 2.6 1.1 0.03 - 0.19 0.72
Is there a lot of exhaust smoke/pollution on the streets? 2.7 1.0 0.18 0.59 - 0.02
Are there many crimes in your neighborhood? 2.6 1.0 0.41 0.30 0.41
Does the crime rate make it unsafe to walk at night? 2.3 1.1 0.53 0.28 0.36
Fear of being attacked by a stranger at home 3.1 1.1 0.78 0.00 0.07
Fear of being attacked by a stranger in the vicinity 3.2 1.0 0.82 0.00 0.02
Fear of being attacked by a stranger while walking 3.0 1.0 0.82 0.10 0.02
Fear of being attacked by a stranger in the park 2.8 1.0 0.73 - 0.01 0.05
% variance explained 22.95 14.01 13.68
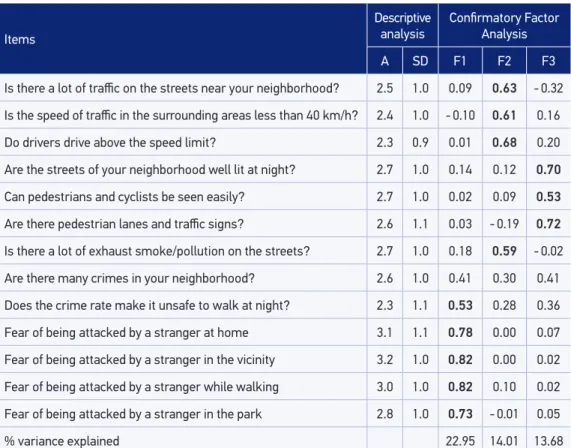
Table 1. Results of the analysis of the main components for scales of safety perception in adolescents. Curitiba, 2015.
A: average; SD: standard deviation; F1: perception of crime-related safety; F2: perception of vehicle traic-related safety; F3: perception of pedestrian traic-related safety.
1. perception of safety related to crime, consisting of ive items;
2. perception of safety related to vehicle traic, composed of four items;
3. perception of safety related to pedestrian traic, composed of three items.
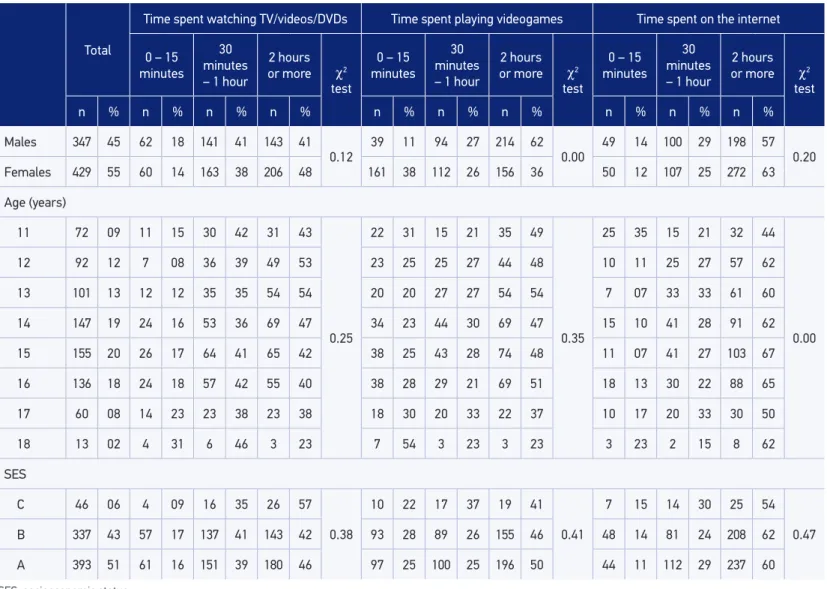
by 48.0% (95%CI 45.9 – 52.2) of the sample, with a higher prevalence for boys (62.0 ver‑ sus 36.0%), aged 13 years old (54.0%) and high SES (50.0%). More time spent in front of the screen suring the Internet was observed in 61.0% (95%CI 57.8 ‑ 63.9) of the sample. Girls (63.0 versus 57.0%) aged 15 years old (67.0%) and “middle” SES (62.0%) showed a higher prevalence for this behavior. Table 2 presents other descriptive characteristics of the participants.
The bivariate analysis observed a lower chance of adolescents watching TV in excess as they grow older (OR = 0.84, 95%CI 0.74 – 0.94). There was a 13.0% increase in the possi‑ bility of excessive Internet use for each year of life. Girls were less likely to spend their time playing videogames (OR = 0.18; 95%CI 0.12 – 0.27) compared to boys.
Perception of safety was not associated with time devoted to watching television; however, statistically significant association were observed between pedestrian traf‑ fic safety and time devoted to playing videogames (OR = 1.27, 95%CI 1.04 – 1.55) and vehicle traffic safety and time on the Internet (OR = 1.32, 95%CI 1.04 – 1.69), both in the reverse order than expected. The perception of safety related to crime (Table 3) remained associated with the use of videogames and the Internet, contrary to our hypothesis (p < 0.05).
After adjusting for the confounding variables (Table 4), the perception of safety related to crime was associated with 30 minutes to 1 hour playing videogames by older adolescents (OR = 1.15, 95%CI 1.03 – 1.29). The perception of safety related to pedestrian traic was associated with the presence of 30 minutes to 1 hour playing videogames by adolescents with higher SES (OR = 2.40, 95%CI 1.05 – 5.47). The association between safety perception related to pedestrian traic and playing videogames for 2 hours or more, decreases with increasing age (OR = 0.87; 95%CI 0.79 – 0.97).
DISCUSSION
The results in this study indicate different directions and magnitudes in the associ‑ ation between the perception of safety and the screen time of adolescents. There was a high prevalence of adolescents who did screen‑related activities for more than two hours daily, corroborating other findings3,7,13. When considering the sedentary activ‑
ities separately, it was observed that the prevalence of each one differs according to gender, age and SES.
The predominance in TV use was higher among girls and low‑income youth. The lack of safety present in the community, combined with social norms that inhibit girls’ autonomy, could, at least partially, explain this result. For example, parents may prohibit activities away from home, leading girls to opt for more sedentary activities. Greater TV use in low‑income economic classes has been demonstrated in other stud‑ ies9,12,28,29. Among girls, during adolescence, there is a predominance of Internet use.
Total
Time spent watching TV/videos/DVDs Time spent playing videogames Time spent on the internet
0 – 15 minutes
30 minutes – 1 hour
2 hours or more χ2
test
0 – 15 minutes
30 minutes – 1 hour
2 hours or more χ2
test
0 – 15 minutes
30 minutes – 1 hour
2 hours or more χ2
test
n % n % n % n % n % n % n % n % n % n %
Males 347 45 62 18 141 41 143 41
0.12
39 11 94 27 214 62
0.00
49 14 100 29 198 57
0.20
Females 429 55 60 14 163 38 206 48 161 38 112 26 156 36 50 12 107 25 272 63
Age (years)
11 72 09 11 15 30 42 31 43
0.25
22 31 15 21 35 49
0.35
25 35 15 21 32 44
0.00
12 92 12 7 08 36 39 49 53 23 25 25 27 44 48 10 11 25 27 57 62
13 101 13 12 12 35 35 54 54 20 20 27 27 54 54 7 07 33 33 61 60
14 147 19 24 16 53 36 69 47 34 23 44 30 69 47 15 10 41 28 91 62
15 155 20 26 17 64 41 65 42 38 25 43 28 74 48 11 07 41 27 103 67
16 136 18 24 18 57 42 55 40 38 28 29 21 69 51 18 13 30 22 88 65
17 60 08 14 23 23 38 23 38 18 30 20 33 22 37 10 17 20 33 30 50
18 13 02 4 31 6 46 3 23 7 54 3 23 3 23 3 23 2 15 8 62
SES
C 46 06 4 09 16 35 26 57
0.38
10 22 17 37 19 41
0.41
7 15 14 30 25 54
0.47
B 337 43 57 17 137 41 143 42 93 28 89 26 155 46 48 14 81 24 208 62
A 393 51 61 16 151 39 180 46 97 25 100 25 196 50 44 11 112 29 237 60
Table 2. Descriptive characteristics of adolescents according to screen time (n = 776). Curitiba, 2015.
Time spent watching TV/videos/DVDs Time spent playing videogames Time spent on the internet
30 minutes – 1 hour
2 hours or more
30 minutes – 1 hour
2 hours or more
30 minutes – 1 hour
2 hours or more
OR CI95% OR CI95% OR CI95% OR CI95% OR CI95% OR CI95%
Females*† 1.19 (0.78 – 1.82) 1.49 (0.98 – 2.25) 0.29 (0.19 – 0.45) 0.18 (0.12 – 0.27) 1.05 (0.65 – 1.69) 1.35 (0.87 – 2.08)
Age 0.89 (0.79 – 1.01) 0.84 (0.74 – 0.94) 0.98 (0.88 – 1.09) 0.94 (0.85 – 1.03) 1.11 (0.97 – 1.26) 1.13 (1.00 – 1.28)
SES B 0.60 (0.19 – 1.88) 0.39 (0.13 – 1.16) 0.56 (0.24 – 1.30) 0.88 (0.39 – 1.97) 0.84 (0.32 – 2.24) 1.21 (0.50 – 2.97)
SES A 0.62 (0.20 – 1.93) 0.45 (0.15 – 1.35) 0.61 (0.26 – 1.39) 1.06 (0.48 – 2.38) 1.27 (0.48 – 3.36) 1.51 (0.61 – 3.70)
PS crimes 0.88 (0.70 – 1.09) 0.89 (0.72 – 1.11) 1.10 (0.91 – 1.34) 1.23 (1.04 – 1.47) 1.17 (0.92 – 1.49) 1.14 (0.92 – 1.41)
PS veh. traf. 1.14 (0.92 – 1.41) 0.95 (0.77 – 1.17) 1.20 (0.98 – 1.46) 1.12 (0.94 – 1.33) 1.30 (1.02 – 1.66) 1.09 (0.88 – 1.36)
PS ped. traf. 0.91 (0.74 – 1.12) 1.14 (0.93 – 1.41) 1.26 (1.03 – 1.53) 1.12 (0.95 – 1.33) 1.22 (0.96 – 1.55) 1.10 (0.89 – 1.36)
**Females† 1.12 (0.73 – 1.73) 1.39 (0.91 – 2.13) 0.28 (0.18 – 0.44) 0.18 (0.12 – 0.27) 1.18 (0.72 – 1.94) 1.50 (0.96 – 2.35)
Age 0.89 (0.79 – 1.01) 0.84 (0.75 – 0.95) 0.98 (0.87 – 1.10) 0.92 (0.83 – 1.02) 1.15 (1.01 – 1.32) 1.16 (1.03 – 1.31)
SES B 0.61 (0.19 – 1.93) 0.42 (0.14 – 1.26) 0.54 (0.23 – 1.28) 0.84 (0.36 – 1.97) 0.75 (0.28 – 2.02) 1.11 (0.45 – 2.77)
SES A 0.63 (0.20 – 1.98) 0.47 (0.16 – 1.43) 0.51 (0.22 – 1.21) 0.88 (0.38 – 2.06) 1.10 (0.41 – 2.94) 1.42 (0.57 – 3.52)
PS crimes 0.88 (0.71 – 1.11) 0.91 (0.73 – 1.14) 1.02 (0.83 – 1.25) 1.08 (0.90 – 1.30) 1.20 (0.94 – 1.54) 1.19 (0.95 – 1.49)
PS veh. traf. 1.12 (0.91 – 1.39) 0.93 (0.75 – 1.14) 1.20 (0.98 – 1.47) 1.10 (0.91 – 1.32) 1.32 (1.04 – 1.69) 1.11 (0.89 – 1.39)
PS ped. traf. 0.89 (0.72 – 1.10) 1.10 (0.89 – 1.36) 1.27 (1.04 – 1.55) 1.13 (0.94 – 1.35) 1.23 (0.97 – 1.57) 1.12 (0.90 – 1.39)
Table 3. Association between sociodemographic characteristics and screen time in adolescents (n = 776). Curitiba, 2015.
OR Gender p-
value OR Age
p-
value OR SES A
p-
value OR SES B
p- value
TV/V
ideos/DVDs
30 minutes –
1 hour
PS crimes 0.82 (0.52 – 1.29) 0.39 1.01 (0.89 – 1.14) 0.87 0.97 (0.35 – 2.73) 0.96 1.33 (0.48 – 3.70) 0.59
PS veh. traf. 1.10 (0.72 – 1.68) 0.65 1.01 (0.89 – 1.13) 0.91 0.53 (0.14 – 2.06) 0.36 0.80 (0.21 – 3.07) 0.74
PS veh. traf. 0.86 (0.56 – 1.31) 0.48 0.98 (0.87 – 1.11) 0.78 0.48 (0.15 – 1.54) 0.22 0.56 (0.17 – 1.79) 0.33
2 hours or +
PS crimes 0.84 (0.54 – 1.32) 0.45 1.06 (0.94 – 1.19) 0.38 1.01 (0.37 – 2.73) 0.99 1.31 (0.49 – 3.50) 0.60
PS veh. traf. 1.07 (0.70 – 1.63) 0.76 1.02 (0.90 – 1.14) 0.80 0.50 (0.14 – 1.87) 0.31 0.68 (0.18 – 2.54) 0.57
PS veh. traf. 0.82 (0.54 – 1.25) 0.36 0.95 (0.85 – 1.08) 0.45 0.33 (0.10-1.08) 0.07 0.43 (0.13 – 1.39) 0.16
V
ideogames
30 minutes – 1 hour
PS crimes 0.87 (0.54 – 1.40) 0.57 1.15 (1.03 – 1.29) 0.01 0.70 (0.32 – 1.52) 0.37 1.36 (0.63 – 2.93) 0.43
PS veh. traf. 0.95 (0.60 – 1.49) 0.82 0.99 (0.89 – 1.11) 0.93 0.77 (0.33 – 1.81) 0.55 1.15 (0.49 – 2.69) 0.75
PS veh. traf. 1.36 (0.87 – 2.14) 0.18 0.93 (0.83 – 1.05) 0.25 2.40 (1.05 – 5.47) 0.04 2.04 (0.89 – 4.65) 0.09
2 hours or +
PS crimes 0.71 (0.46 – 1.09) 0.12 1.09 (0.98 – 1.20) 0.11 0.49 (0.22 – 1.07) 0.08 0.86 (0.39 – 1.88) 0.71
PS veh. traf. 0.76 (0.50 – 1.16) 0.20 1.03 (0.93 – 1.14) 0.61 1.79 (0.72 – 4.42) 0.21 1.72 (0.70 – 4.25) 0.24
PS veh. traf. 0.91 (0.60 – 1.37) 0.65 0.87 (0.79 – 0.97) 0.01 1.53 (0.68 – 3.44) 0.31 1.57 (0.70 – 3.55) 0.28
Internet
30 minutes – 1 hour
PS crimes 1.12 (0.68 – 1.84) 0.66 0.97 (0.85 – 1.11) 0.70 1.01 (0.42 – 2.45) 0.98 1.68 (0.70 – 4.01) 0.24
PS veh. traf. 0.93 (0.57 – 1.51) 0.76 1.11 (0.97 – 1.26) 0.13 0.47 (0.15 – 1.46) 0.19 0.67 (0.22 – 2.04) 0.48
PS veh. traf. 1.10 (0.68 – 1.78) 0.71 1.01 (0.89 – 1.16) 0.83 1.67 (0.64 – 4.34) 0.29 2.37 (0.91 – 6.17) 0.08
2 hours or +
PS crimes 0.89 (0.57 – 1.40) 0.63 0.96 (0.85 – 1.08) 0.47 0.93 (0.41 – 2.09) 0.86 1.49 (0.67 – 3.30) 0.33
PS veh. traf. 1.06 (0.68 – 1.65) 0.80 1.08 (0.96 – 1.22) 0.19 0.78 (0.28 – 2.20) 0.64 0.86 (0.31 – 2.39) 0.77
PS veh. traf. 0.90 (0.58 – 1.39) 0.63 0.97 (0.86 – 1.09) 0.59 0.69 (0.29 – 1.66) 0.41 0.97 (0.41 – 2.31) 0.94
Table 4. Multinomial regression analysis (n = 775). Reference = 0 – 15 minutes per day. Curitiba, 2015.
OR: odds ratio; SES: socioeconomic status; PS: perception of safety; PS: perception of safety; veh. traf.: vehicle traic; ped. traf.: pedestrian traic. Adjusted for the
blogs and other activities related to the Internet30, which is different from boys, who
prefer electronic games11,31.
There was a positive association between the perception regarding crime‑related safety and playing videogames. This result is contrary to the hypothesis of the present study. In a survey conducted in Texas, in the United States, diferent results were obtained, and the high crime rate in the neighborhood was associated with more time devoted to vid‑ eogames11. However, a survey of a large sample of Brazilian schoolchildren found no
association between neighborhood characteristics and time spent watching television32.
The use of self‑reported measures regarding public safety may present limitations, and suggests the need to improve the understanding of the phenomenon of violence in young people’s perception of safety.
There was an inverse association between the understanding of pedestrian, traic‑re‑ lated safety and adolescents playing videogames. Generally, older adolescents spend more time away from home and have greater independence with regard to mobility15.
As such, these factors can contribute so that they spend less time on activities such as video games. Nevertheless, the perception of safety related to pedestrian traic was not associated with TV and Internet use. It is believed that these activities, in this age group, are tied to individual preferences. The Internet is a communication tool that is an inte‑ gral part of adolescents’ daily life30. Thus, neighborhood environment aspects may have
less relation to these behaviors.
Finally, it is important to emphasize that this study approached adolescents’ percep‑ tion of safety, since evidence obtained through the parents’ perceptions tend to difer33.
This may be related to the adolescent’s lack of awareness about the reality of the neigh‑ borhood, or to the fact that the family can transmit a sense of safety. Moreover, this sub‑ jective evaluation does not allow us to identify the reality of the neighborhood nor the exact amount of screen time. Another limitation related to the measurement of screen time is the lack of information considering the weekends, which could imply diferent results for the investigation. Thus, future research related to the topic is suggested, which includes other control variables, such as the caregiver’s perceptions of safety and the adolescents’ practice of physical activity. In addition, these investigations should include objective ways of assessing screen time, in addition to diferent study designs, so that it is possible to identify cause and efect relationships between neighborhood safety and time adolescents spend in front of screens.
results. This study was carried out with adolescents aged 11 to 18 years, who are students from public and private schools in Curitiba, Paraná. Thus, it is not possible to extrapolate these results to other populations.
Despite these limitations, the issues addressed here are extremely important for the imple‑ mentation of policies aimed at reducing the time spent by adolescents in front of screens. Although only one expected association was found, other important information must be considered. The results in this study allow us to observe the characteristics in the proile of the adolescents who use television, videogames and the Internet, thus enabling future interventions aimed at reducing these activities in this age group. In addition, diferent out‑ comes related to screen time and more speciic characteristics related to the perception of neighborhood safety were considered. In low‑ and middle‑income countries like Brazil, this type of research involving adolescents is still scarce.
CONCLUSION
The association between perceived safety and time spent by adolescents in front of screens is complex and varies according to sociodemographic characteristics and the type of equipment used during screen time (television/videos/DVDs, videogames and the Internet). The prevalence of screen time among adolescents over two hours daily is high. Greater perception of crime in the neighborhood was associated with more time spent play‑ ing videogames by older adolescents. Thus, new research is recommended that may include objective measurements of safety in the neighborhood, and also that investigate the per‑ ception of parents, in order to better understand this complex relationship. Furthermore, it is suggested that interventions that reduce screen time should be priorities in the health agenda for adolescents.
ACKOWLEDGMENTS
We would like to thank Mr. Alex Vieira Lima, who coordinated the research, and the members of the Research Group on Physical Activity and Quality of Life that performed the data collection.
REFERENCES
1. Bauer KW, Friend S, Graham DJ, Neumark‑Sztainer D. Beyond Screen Time: assessing recreational sedentary behavior among adolescent girls. J Obes 2012; 2012: 83194. DOI: 10.1155/2012/183194
3. Brasil. Instituto Brasileiro de Geograia e Estatística (IBGE). Pesquisa nacional de saúde do escolar 2012. Rio de Janeiro: IBGE; 2012.
4. Salmon J, Tremblay MS, Marshall SJ, Hume C. Health risks, correlates, and interventions to reduce sedentary behavior in young people. Am J Prev Med 2011; 41(2): 197‑206. DOI: 10.1016/j. amepre.2011.05.001
5. Boulos R, Vikre EK, Oppenheimer S, Chang H, Kanarek RB. ObesiTV: how television is inluencing the obesity epidemic. Physiol Behav 2012; 107(1): 146‑53. DOI: 10.1016/j.physbeh.2012.05.022
6. Mitchell JA, Rodriguez D, Schmitz KH, Audrain‑ McGovern J. Greater screen time is associated with adolescent obesity: a longitudinal study of the BMI distribution from ages 14 to 18. Obesity (Silver Spring) 2013; 21(3): 572‑5. DOI: 10.1002/oby.20157
7. Dumith SC, Garcia LMT, Silva KS, Menezes AMB, Hallal PC. Predictors and health consequences of screen‑time change during adolescence — 1993 Pelotas (Brazil) birth cohort study. J Adolesc Health 2012; 51(6 Suppl): 16‑21. DOI: 10.1016/j. jadohealth.2012.06.025
8. Biddle SJ, Pearson N, Ross GM, Braithwaite R. Tracking of sedentary behaviours of young people: a systematic review. Prev Med 2010; 51(5): 345‑51. DOI: 10.1016/j. ypmed.2010.07.018
9. Burdette HL, Whitaker RC. A national study of neighborhood safety, outdoor play, television viewing, and obesity in preschool children. Pediatrics 2005; 116(3): 657‑62.
10. Datar A, Nicosia N, Shier V. Parent perceptions of neighborhood safety and children’s physical activity, sedentary behavior, and obesity: evidence from a national longitudinal study. Am J Epidemiol 2013; 177(10): 1065‑73. DOI: 10.1093/aje/kws353.
11. Brown HS, Perez A, Mirchandani GG, Hoelscher DM, Kelder SH. Crime rates and sedentary behavior among 4th grade Texas school children. Int J Behav Nutr Phys
Act 2008; 5(28). DOI: 10.1186/1479‑5868‑5‑28.
12. MacLeod KE, Gee GC, Crawford P, Wang MC. Neighbourhood environment as a predictor of television watching among g irls. J Epidemiol Community Health 2008; 62(4): 288‑92. DOI: 10.1136/ jech.2007.061424
13. Salmon J, Veitch J, Abbott G, ChinAPaw M, Brug JJ, teVelde SJ, et al. Are associations between the perceived home and neighbourhood environment and children’s physical activity and sedentary behaviour moderated by urban/rural location? Health Place 2013; 24: 44‑53. DOI: 10.1016/j.healthplace.2013.07.010
14. Carver A, Timperio AF, Crawford DA. Neighborhood road environments and physical activity among youth: the clan study. J Urban Health 2008; 85(4): 532‑44. DOI: 10.1007/s11524‑008‑9284‑9
15. Santos MP, Pizarro AN, Mota J, Marques EA. Parental physical activity, safety perceptions and children’s independent mobility. BMC Public Health 2013; 13: 584. DOI: 10.1186/1471‑2458‑13‑584
16. Waiselisz JJ. Mapa da Violência 2013: acidentes de trânsito e motocicletas. Rio de Janeiro: Flacso; 2013.
17. World Health Organization (WHO). Global status report on road safety 2013: supporting a decade of action. Geneva: WHO; 2013.
18. Waiselisz JJ. Mapa da violência 2013: mortes matadas por armas de fogo. Brasília: Flacso; 2013.
19. Autran RG, Rech CR, Mota J, Santos MP. Percepção de regras e de coniança em reduzir o tempo de tela em adolescentes. Rev Bras Ativ Fis Saúde 2014; 19(6): 690‑9. DOI: 10.12820/RBAFS.V.19N6P690
20. Dallago L, Perkins DD, Santinello M, Boyce W, Molcho M, Morgan A. Adolescent place attachment, social capital, and perceived safety: a comparison of 13 countries. Am J Community Psychol 2009; 44(1‑2): 148‑60. DOI: 10.1007/s10464‑009‑9250‑z
21. Schoen TH, Vitalle MSS. Tenho medo de quê? Rev Paul Pediatr 2012; 30(1): 72‑8. DOI: 10.1590/ S0103‑05822012000100011
22. Borges D. Vitimização e sentimeto de insegurança no Brasil em 2010: teoria, análise e contexto. Mediações 2013; 18(1): 141‑63. DOI: 10.5433/2176‑6665.2013v18n1p141
23. Brasil. Instituto Brasileiro de Geograia e Estatística (IBGE). Paraná, Curitiba: ensino, matrículas, docentes e rede escolar – 2012. [Internet]. Disponível em: http://cidades.ibge.gov.br/xtras/temas. php?lang=&codmun=410690 &idtema=117&sear ch=parana|curitiba|ensino‑matriculas‑docentes‑e‑ rede‑escolar‑2012 (Acessado em 14 setembro de 2015).
24. Rosenberg DE, Sallis JF, Kerr J, Maher J, Norman GJ, Durant N, et al. Brief scales to assess physical activity and sedentary equipment in the home. Int J Behav Nutr Phys Act 2010; 7:10. DOI: 10.1186/1479‑5868‑7‑10
25. Rosenberg D, Ding D, Sallis JF, Kerr J, Norman GJ, Durant N, et al. Neighborhood environment walkability scale for youth (NEWS‑Y): reliability and relationship with physical activity. Prev Med 2009; 49(2‑3): 213‑8. DOI: 10.1016/j.ypmed.2009.07.011
27. Associação Brasileira de Empresas e Pesquisa. Brazilian criteria foreconomic classiication. [Internet]. Disponível em: http://www.abep.org/criterio‑brasil (Acessado em 02 de dezembro de 2014).
28. Chowhan J, Stewart JM. Television and the behaviour of adolescents: does socio‑economic status moderate the link? Soc Sci Med 2007; 65(7): 1324‑36. DOI: 10.1016/j.socscimed.2007.05.019
29. Molnar BE, Gortmaker SL, Bull FC, Buka SL. Unsafe to play? neighborhood disorder and lack of safety predict reduced physical activity among urban children and adolescents. Am J Health Promot 2004;18(5): 378‑86.
30. Brasil. Fundo das Nações Unidas para a Infância (UNICEF). O uso da internet por adolescentes. Brasília: UNICEF; 2013.
31. Salmon J, Timperio A, Telford A, Carver A, Crawford D. Association of family environment with children’s
television viewing and with low level of physical activity. Obes Res 2005; 13(11): 1939‑51. DOI: 10.1038/ oby.2005.239
32. Martins MO, Cavalcante VLF, Holanda GS, Oliveira CG, Maia FES, Meneses Júnior JR, et al. Associação entre comportamento sedentário e fatores psicossociais e ambientais em adolescentes da região nordeste do Brasil. Rev Bras Ativ Fis e Saúde 2012; 17(2): 143‑50. DOI: 10.12820/RBAFS.V.17N2P143‑150
33. Kerr J, Norma GJ, Sallis JF, Patrick K. Exercise aids, neighborhood safety, and physical activity in adolescents and parents. Med Sci Sports Exerc 2008; 40(7): 1244‑8. DOI: 10.1249/MSS.0b013e31816b8797
Received on: 02/16/2016