Physical activity level among
children and adolescents
orphaned by AIDS
Nível de atividade física de crianças e
adolescentes órfãos por aids
Cláudia Renata dos Santos Barros
Eliana Miura Zucchi
Ivan França Junior
Departamento de Saúde Materno-Infantil da Faculdade de Saúde Pública da Universidade de São Paulo – USP
Financiamento: FAPESP (03/10883-5) e Apoio da Coordenação de Aperfeiçoamento de Pessoal do Nível Superior (CAPES) sob a forma de bolsa de estudo de mestrado.
Correspondência: Ivan França Junior, Departamento de Saúde Materno-Infantil da Faculdade de Saúde Pública da Universidade de São Paulo, Av. Dr. Arnaldo, 715 - 2º andar – sala 218, Cerqueira César, São Paulo, SP CEP 01246-904 - E-mail: [email protected]
Abstract
Objective: To estimate the level of physical
activity among children and adolescents orphaned by AIDS according to socio-de-mographic and orphanhood-related char-acteristics. Methods: A population-based study was carried out with 235 children and adolescents aged 7 to 14 years in the mu-nicipality of São Paulo, SP, in 2007. Children were classiied as active and inactive. The cut-off point established was 300 minutes of weekly physical activity. All variables were compared between both groups and sexes.
Results: An overall prevalence of 42% of inactivity was found. Active commuting and child’s play were the main physical activities for most of the children and adolescents. As for physical activity level, a signiicant difference was observed between sexes (p < 0.001). Boys were more active and played outdoors more than girls. Conclusions:
There is a high prevalence of physical in-activity among children and adolescents orphaned by AIDS, especially girls.
Keywords: AIDS. Orphans. Physical activity.
Introduction
A major outcome of the heterosexual AIDS epidemic in Brazil in the last ten years was a growing number of children of people living with HIV. Considering the low pro-bability of mother-to-child transmission,1 especially among pregnant women recei-ving adequate prenatal care, most of these children are not infected by HIV and may be orphaned by the death of one or both parents by AIDS. Studies show that AIDS orphanhood may have an adverse impact on the life of orphaned children, especially affecting their health.2
Most studies on the health of AIDS orphans have focused on mental (stress, low self-esteem and depression)3,4 and nu-tritional health conditions (prevalence of malnutrition).5 However, there are no stu-dies on the level of physical activity among children orphaned by AIDS.
For children and young people, regular
physical activity is essential for healthy gro-wth and development.6,7,8 Regular physical activity is deined as “any bodily movement produced by skeletal muscles that requires an energy expenditure greater than resting levels”.9
Although physical activity contributes to health benefits and quality of life of children and adolescents, high prevalence of physical inactivity,10,11 especially among girls, has been reported in children from low education and low income communities.12
The objective of the present study was to estimate the level of physical activity among children and adolescents orphaned by AIDS and to examine their sociodemographic and orphanhood-related characteristics.
Materials and Methods
Subjects
A population-based cross-sectional stu-dy was conducted on probabilistic sample.
Cluster sampling was carried out with the
selection of clusters of varying sizes from
the AIDS death database of the city of São
Resumo
Objetivo: Estimar o nível de atividade física em crianças e adolescentes órfãos por aids, segundo características sociodemográicas e relativas à orfandade. Métodos: Inquérito populacional realizado no município de São Paulo, SP, entre 2006 e 2007, com 235 crianças e adolescentes de 7 a 14 anos. As crianças foram classiicadas como ativas e sedentárias com o ponto de corte em 300 minutos por semana de atividade física. Todas as variáveis foram comparadas entre os dois grupos e entre os sexos.
Resulta-dos: Foi observada prevalência de 42% de
sedentarismo. A maioria das crianças e adolescentes apresentou locomoção e brin-cadeiras infantis como principais atividades físicas. Quanto ao nível de atividade física foi observada diferença signiicativa entre os sexos (p < 0,001). Os meninos eram mais ativos e brincavam mais na rua do que as meninas. Conclusões: Há alta magnitude de prevalência de sedentarismo entre crianças e adolescentes órfãos por aids, sendo maior entre as meninas.
Palavras-chave: Órfãos. Aids. Atividade
Paulo (PROAIM) for the period between 2000 and 2004. A two-stage proportional to size sampling method was used, totaling 124 primary sampling units (PSUs) in the irst stage and 40 dwellings in the second one. The final equiprobabilistic sample comprised 2,081 dwellings of deceased per-sons, of which 88% were located. After home visits, we identiied 918 (50.3%) households eligible for the study (deceased people survived by children). Of these, 436 (47.5%) were eligible children and adolescents 7–14 years of age living in the city of São Paulo. A total of 291 (66%) sociodemographic in-terviews were conducted. The main reasons for losses included: geographical migration (73; 16.6%); refusals (45; 10.3%); unable to contact after three attempts (25; 5.7%); and unsafe environment (2; 0.4%).
Most children and adolescents (242; 83.2%) who participated in the interviews also underwent a physical evaluation. Only a small proportion of caregivers (3%) did not agree to participate in these evaluations.
To prevent that high rates of losses could affect the study representativeness and po-tential inferences, a nonresponse weighting method was applied using a loglinear Pois-son model for adjusting the distribution of respondents for the entire study population. Weighting was estimated based on one or more variables available for respondents and non-respondents that were correlated with the variables studied. The following covariates were used for adjustment: living area, marital status, age of deceased, gender and exposure category.13,14,15
The inal sample consisted of 235 (83%) children and adolescents. The assessment also included a physical evaluation so that there will be adequate information for es-timating weights for sampling correction.
The majority of children and adolescents were paternal orphans aged between 10 and 13 years old, HIV-negative, and non-white. They were mostly living with the remaining parent, most often the mother, in families with high socioeconomic score (SES) and per capita income lower than R$ 380.00. Forty percent of caregivers had four years
of schooling or less. (Table 1)
Face-to-face interviews were conducted with parents or caregivers using two struc-tured questionnaires. One questionnaire consisted of sociodemographic questions and the second one was an instrument va-lidated for use in adolescents16 to collect in-formation on physical activity and inactivity.
Independent variables
Sociodemographic characteristics of children
The following sociodemographic varia-bles were included: gender, age, skin color, type of orphan, type of caregiving arrange-ment, and HIV status.
Institutionalization was not included in the analysis as only ive (2%) subjects were in shelters. Regarding HIV status, 12 (5%) children were HIV-positive, 53 (22%) were not tested, 7 (3%) did not know whether they have been tested or not, and 1 (0.4%) did not know the test result. Subjects were then divided into three groups: HIV-positive; HIV-negative; and unknown HIV status.
Sociodemographic characteristics of parents or caregivers
The sociodemographic variables of pa-rents or caregivers included: socioeconomic score (SES) calculated based on the sum of possessions in the household (TV, radio, VCR etc.) and caregiver’s schooling (total score was categorized into tertiles); per capita income with a cut-off of R$ 380.00 (monthly minimum wage in the reference year of 2005); and schooling.
Variables related to free-time play
Only 4 (1.6%) children and adolescents did not play at all during their free time. Among those who did engage in playing, information on place of play, playmates and frequency of play was examined.
Physical inactivity
Table 1 - Overall distribution and stratiied by gender of children and adolescents orphaned by AIDS according to sociodemographic characteristics. City of São Paulo, 2007. (N= 235)
Total Male Female
Variable n % (95% CI) n % (95% CI) n % (95% CI)
Age (years)
07|---10 77 (32.0) (25.5;39.3) 32 (27.8) (19.1;38.5) 45 (35.6) (27.4;44.8)
10|---13 96 (41.2) (35.5;47.1) 44 (42.0) (32.7;51.8) 52 (40.6) (32.4;49.4)
13|---15 62 (26.7) (21.2;33.0) 32 (30.2) (21.9;40.2) 30 (23.8) (16.0;33.7)
p= 0.4189 Type of orphan
Paternal 114 (48.5) (40.7;56.5) 50 (46.4) (36.1;57.0) 64 (50.3) (40.7;60.0)
Maternal 68 (29.0) (22.6;36.5) 30 (28.1) (19.9;38.0) 38 (29.9) (21.6;39.7)
Both 53 (22.5) (15.6;31.1) 28 (25.5) (16.8;36.8) 25 (19.8) (12.6;29.6)
p=0.548 HIV status
Positive 12 (5.5) (3.0;9.7) 5 (5.3) (2.2;12.3) 7 5.5 (2.4;12.5)
Negative 165 (69.2) (61.3;76.1) 79 (70.7) (59.8;79.6) 86 68.0 (56.6;77.6)
Unknown 58 (25.3) (18.7;33.4) 24 (24.0) (16.5;33.6) 34 26.5 (17.2;38.4)
p= 0.919 Skin color
White 99 (43.7) (35.4;52.3) 46 (44.0) (33.6;54.8) 53 (43.5) (34.0;53.5)
Non-white 136 (56.3) (47.6;64.6) 62 (56.0) (45.2;66.4) 74 (56.5) (46.5;66.0)
p=0.935 Type of caregiving arrangement
Parent 109 (46.9) (38.4;55.5) 54 (50.4) (38.1;62.7) 55 (43.8) (32.7;55.4)
Other family member
104 (43.1) (34.0;52.7) 48 (42.6) (30.8;55.2) 56 (43.6) (32.2;55.8)
Non-family member
22 (10.0) (6.2;15.6) 6 (7.0) (3.1;15.0) 16 (12.6) (7.1;21.4)
p=0.429 Socioeconomic score#
Score 1 (P25) 75 (31.1) (22.8;40.9) 32 (28.2) (17.8;41.5) 43 (33.6) (23.7;45.2)
Score 2 (P50) 62 (26.9) (19.0;36.6) 36 (33.4) (22.9;45.8) 26 (21.3) (13.2;32.6)
Score 3 (P75) 93 (42.0) (33.5;50.9) 38 (38.4) (27.0;51.2) 55 (45.1) (34.9;55.6)
0.1783 Per capita income##
< R$ 380.00 186 (84.1) (76.3;89.7) 82 (81.6) (68.7;89.9) 104 (86.1) (77.4;91.8)
≥ R$ 380.00 32 (15.9) (10.3;23.7) 16 (18.4) (10.1;31.2) 16 (13.9) (8.2;22.6)
p=0.415 Schooling (years)
0–4 95 (39.9) (31.5;48.9) 44 (39.3) (28.9;50.6) 51 (40.4) (29.4;52.4)
5–9 74 (32.0) (24.7;40.2) 31 (29.6) (21.7;38.9) 43 (34.0) (24.3;45.2)
More than 9 66 (28.1) (21.8;35.5) 33 (31.1) (21.6;42.4) 33 (25.6) (18.1;34.9)
p=0.643 # 5 institutionalized children were excluded from the sample
## 5 children were institutionalized and 12 caregivers did not know the monthly income
Dependent variable – physical activity
For the assessment of the dependent variable – physical activity –, the Physical Activity Questionnaire validated for use in adolescents was applied.16
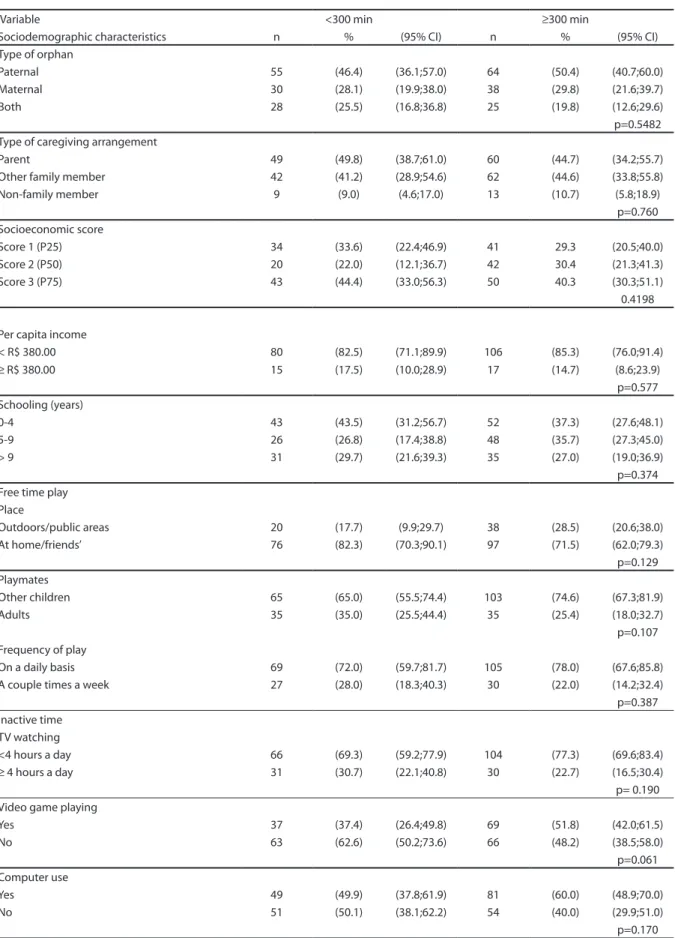
Table 2 - Overall distribution of sociodemographic variables, play, and free time stratiied by physical activity of children and adolescents according to sociodemographic and orphanhood-related characteristics. City of São Paulo, 2007.
Variable <300 min ≥300 min
Sociodemographic characteristics n % (95% CI) n % (95% CI)
Gender
Male 31 (30.0) (22.3;39.2) 77 (58.0) (48.8;66.7)
Female 69 (70.0) (60.8;77.7) 58 (42.0) (33.2;51.2)
p=0.000* Age (years)
07|---10 36 (35.2) (26.6;44.9) 41 (29.7) (20.9;40.4)
10|---13 34 (34.1) (26.7;42.4) 62 (46.3) (38.3;54.6)
13|---15 30 (30.7) (22.7;40.0) 32 (24.0) (16.3;33.6)
p=0.194 Skin color
White 45 (46.7) (34.6;59.2) 54 (41.5) (33.1;50.5)
Non-white 55 (53.3) (40.8;65.3) 81 (58.5) (49.5;66.9)
p=0.4105 HIV status
Positive 5 (4.9) (1.7;12.5) 7 (5.9) (2.8;11.7)
Negative 70 (71.5) (58.9;81.4) 95 (67.6) (57.1;76.5)
Unknown 25 (23.6) (14.6;35.9) 33 (26.5) (18.5;36.5)
p=0.828
The questionnaire’s wording/phrases were adapted to allow caregivers to provide answers about the children and adolescents. Frequently reported games and activities for children included in the Compendium of Physical Activities18 were considered for estimating the level of physical activity.
All interviews were conducted by trained professionals after the children’s caregivers signed a written consent form.
Data analysis
The descriptive analysis was presented using proportions. The chi-square test at a 5% signiicance level and 80% power was used to test the hypothesis. All analyses were performed in “svy” commands in Stata 10.0.
The study was approved by the Research Ethics Committee of Universidade de São Paulo School of Public Health. There is no conlict of interest.
Results
More than half of the children and adolescents studied reported at least 300 minutes of physical activity per week, with
a predominance of males. There were no differences in the level of physical activity according to other variables. (Table 2)
Most children and adolescents reported out-of-school physical activity (74%) also and active commuting (84%). Regarding the type of physical activity, 49% engaged in children’s games and play and the remaining 51% performed structured sport activities such as soccer, volleyball, swimming, mar-tial arts, and sports initiation.
Only 1.7% of children and adolescents did not play at all during their free time. Among those who did play, most played on a daily basis with other children at home or at their friends’. After stratifying by gender, it was found a higher proportion of males playing outdoors and in public areas. No sta-tistically signiicant gender differences were seen regarding playmates and frequency of play (Table 3).
Table 2 - Continuation
Variable <300 min ≥300 min
Sociodemographic characteristics n % (95% CI) n % (95% CI)
Type of orphan
Paternal 55 (46.4) (36.1;57.0) 64 (50.4) (40.7;60.0)
Maternal 30 (28.1) (19.9;38.0) 38 (29.8) (21.6;39.7)
Both 28 (25.5) (16.8;36.8) 25 (19.8) (12.6;29.6)
p=0.5482 Type of caregiving arrangement
Parent 49 (49.8) (38.7;61.0) 60 (44.7) (34.2;55.7)
Other family member 42 (41.2) (28.9;54.6) 62 (44.6) (33.8;55.8)
Non-family member 9 (9.0) (4.6;17.0) 13 (10.7) (5.8;18.9)
p=0.760 Socioeconomic score
Score 1 (P25) 34 (33.6) (22.4;46.9) 41 29.3 (20.5;40.0)
Score 2 (P50) 20 (22.0) (12.1;36.7) 42 30.4 (21.3;41.3)
Score 3 (P75) 43 (44.4) (33.0;56.3) 50 40.3 (30.3;51.1)
0.4198
Per capita income
< R$ 380.00 80 (82.5) (71.1;89.9) 106 (85.3) (76.0;91.4)
≥ R$ 380.00 15 (17.5) (10.0;28.9) 17 (14.7) (8.6;23.9)
p=0.577 Schooling (years)
0-4 43 (43.5) (31.2;56.7) 52 (37.3) (27.6;48.1)
5-9 26 (26.8) (17.4;38.8) 48 (35.7) (27.3;45.0)
> 9 31 (29.7) (21.6;39.3) 35 (27.0) (19.0;36.9)
p=0.374 Free time play
Place
Outdoors/public areas 20 (17.7) (9.9;29.7) 38 (28.5) (20.6;38.0)
At home/friends’ 76 (82.3) (70.3;90.1) 97 (71.5) (62.0;79.3)
p=0.129 Playmates
Other children 65 (65.0) (55.5;74.4) 103 (74.6) (67.3;81.9)
Adults 35 (35.0) (25.5;44.4) 35 (25.4) (18.0;32.7)
p=0.107 Frequency of play
On a daily basis 69 (72.0) (59.7;81.7) 105 (78.0) (67.6;85.8)
A couple times a week 27 (28.0) (18.3;40.3) 30 (22.0) (14.2;32.4)
p=0.387 Inactive time
TV watching
<4 hours a day 66 (69.3) (59.2;77.9) 104 (77.3) (69.6;83.4)
≥ 4 hours a day 31 (30.7) (22.1;40.8) 30 (22.7) (16.5;30.4)
p= 0.190 Video game playing
Yes 37 (37.4) (26.4;49.8) 69 (51.8) (42.0;61.5)
No 63 (62.6) (50.2;73.6) 66 (48.2) (38.5;58.0)
p=0.061 Computer use
Yes 49 (49.9) (37.8;61.9) 81 (60.0) (48.9;70.0)
No 51 (50.1) (38.1;62.2) 54 (40.0) (29.9;51.0)
Discussion
The prevalence of physical inactivity found in the present study was lower than that (58.2%) seen among children aged 10–12 in the city of Pelotas, southern Brazil.19 However, this inding is similar to that reported in other studies in Pelotas and Lages, southern Brazil,
with adolescents aged 15–18 and 10–17 years who showed a prevalence of 39%20 and 40%12 of inactivity, respectively. It should be noted, however, that these studies used different methods to investigate the level of physical activity, the questions about physical activity, free time and inactive time were adjusted according to different cultures and the cutoff
Table 3 - Overall distribution and stratiied by gender of children and adolescents orphaned by AIDS according to variables related to free-time play. City of São Paulo, 2007.
Total Male Female
Variable n % (95% CI) n % (95% CI) n % (95% CI)
Place of free-time play
Outdoors/public areas 58 (24.1) (18.4;31.0) 36 (32.6) (23.9;42.7) 22 (16.6) (11.2;23.8)
At home/friends’ 173 (75.9) (68.9;81.6) 72 (67.4) (57.3;76.1) 101 (83.4) (76.2;88.7)
p=0.001* Playmates
Other children 162 (69.2) (59.3;77.6) 72 (64.6) (52.0;75.4) 90 (73.4) (62.5;81.9)
Adults 69 (30.8) (22.4;40.7) 36 (35.4) (24.6;47.9) 33 (26.6) (18.0;37.4)
p=0.119 Frequency of play
On a daily basis 174 (75.6) (67.6;82.1) 86 (80.2) (70.4;87.4) 88 (71.4) (58.8;81.4)
A couple times a week 57 (24.4) (17.9;32.3) 22 (19.8) (12.6;29.6) 35 (28.6) (18.6;41.2)
p=0.222
# 4 children did not play at all
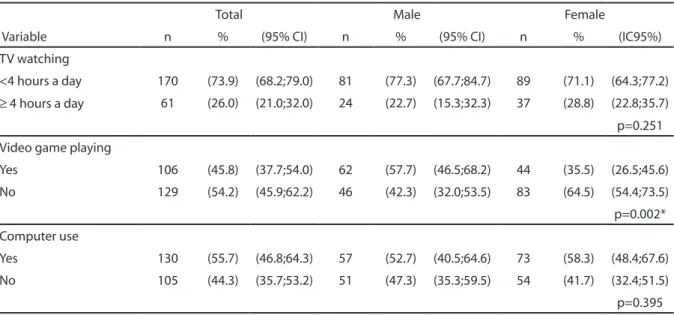
Table 4 - Overall distribution and stratiied by gender of children and adolescents orphaned by AIDS according to variables related to inactive time. City of São Paulo, 2007.
Total Male Female
Variable n % (95% CI) n % (95% CI) n % (IC95%)
TV watching
<4 hours a day 170 (73.9) (68.2;79.0) 81 (77.3) (67.7;84.7) 89 (71.1) (64.3;77.2)
≥ 4 hours a day 61 (26.0) (21.0;32.0) 24 (22.7) (15.3;32.3) 37 (28.8) (22.8;35.7)
p=0.251 Video game playing
Yes 106 (45.8) (37.7;54.0) 62 (57.7) (46.5;68.2) 44 (35.5) (26.5;45.6)
No 129 (54.2) (45.9;62.2) 46 (42.3) (32.0;53.5) 83 (64.5) (54.4;73.5)
p=0.002* Computer use
Yes 130 (55.7) (46.8;64.3) 57 (52.7) (40.5;64.6) 73 (58.3) (48.4;67.6)
No 105 (44.3) (35.7;53.2) 51 (47.3) (35.3;59.5) 54 (41.7) (32.4;51.5)
p=0.395
points for inactivity were inconsistent.11,17,20 These methodological inconsistencies pre-vent a direct comparison between the various groups of children and adolescents studied. Despite methodological differences between studies, we found that physical inactivity is a major issue among children orphaned by AIDS, as documented among children and adolescents in the general population.
Being orphaned by AIDS does not seem to affect the level of physical activity. In contrast, living with HIV/AIDS has been shown to be an important limitation for physical activity.21
Since there were few HIV-positive indi-viduals in the sample studied, physical inac-tivity was comparable to that see in general population. Yet, it is remarkable that the loss of a parent or both was not associated with physical inactivity. One explanation might be that foster families have a similar behavior regarding physical activity for children and adolescents.22
Physical inactivity in AIDS-orphaned chil-dren and adolescents can be attributable to their low economic condition, similar to that seen in school children in other studies. There is an inverse relationship between physical activity and economic condition.6,11,12,23 Poor housing/neighborhood conditions, together with social insecurity and prioritization of transport, make poor areas unfriendly en-vironments for children and adolescents to play outdoors or in public spaces. In addition, free sports facilities and parks are usually lo-cated far from home, which may discourage children’s involvement in physical activity.24
The higher prevalence of physical inacti-vity among orphaned girls is consistent with other studies reporting that boys are more active.12,25,26 This same gender difference is found in different age groups. Gomes et al.,19 in a household survey assessing adolescents over 12, found that boys were more active than girls. Montgomery et al.26 studied preschool and irst grade children and also reported that boys with a mean age of 5.4 years were more active than girls. These differences can be explained by gender-related cultural
factors. Most boys prefer to play with kids of the same gender, typically playing soccer or racing games while girls engage in mixed gender activities; however, they usually have a submissive attitude and sometimes prefer to just watch the boys play.27,28 Girls tend to engage in plays representing their mother’s or caregiver’s role such as play house and baby caring, usually in a sitting position with low energy expenditure.
Time spent watching TV, playing video games or using the computer shows a negative relationship with the level of physical activity in adolescents.26,29 However, this relationship was not seen among children orphaned by AIDS since most of them did not spend much time watching TV or did not use a computer. Although they were from low-income families, only 5 (2.3%) reported not having a TV set at home. It could be that these children may engage in other activities during their free time, e.g., homemaking activities as part of their responsibility as orphans.
The present study has limitations asso-ciated to the dificulty of inding children and adolescents orphaned by AIDS, which resul-ted in a loss of 26%. Besides, the PROAIM da-tabase had missing or incorrect information regarding addresses of deceased individuals. This can be due not only to data entry errors but also incorrect information provided by people living with HIV/AIDS for fear of dis-crimination in their neighborhoods.
However, after adjustment for losses, there was found an intracluster homogeneity with a design effect (deff) greater than 1, except for time spent watching TV. Except for computer use and the variable “playmates,” conidence intervals were adjusted to include weights, improving the accuracy of estimates. (Table 5)
Table 5 - Estimates of proportion, standard error (SE), conidence interval and design effect (deff ) of physical activity, inactive time and playing among children orphaned by AIDS. City of São Paulo, 2007 (N= 235).
Variable (%) SE (%) (95% CI) Deff
At least 300 minutes of physical activity per week
Clustering effect with weighting 41.76 3.50 34.70;48.82 1.18
Clustering effect without weighting 42.55 3.53 35.44;49.66 1.19
Less than 4 hours a day watching TV
Clustering effect with weighting 73.98 3.68 68.56;79.40 0.86
Clustering effect not stratiied 73.59 2.62 68.31;78.87 0.81
Video game playing
Clustering effect with weighting 45.79 4.07 37.58;53.99 1.56
Clustering effect not stratiied 45.10 4.27 36.48;53.73 1.73
Computer use
Clustering effect with weighting 55.74 4.38 46.90;64.58 1.82
Clustering effect without weighting 55.31 4.32 46.59;64.04 1.77
Playing outdoors and in public areas
Clustering effect with weighting 23.79 2.82 18.10;29.48 1.18
Clustering effect not stratiied 24.35 3.00 18.30;30.40 1.32
Playing with other children
Clustering effect with weighting 69.22 4.58 59.98;78.47 2.27
Clustering effect without weighting 70.12 4.25 61.55;78.70 1.98
Frequent playing
Clustering effect with weighting 75.57 3.58 68.34;82.80 1.60
Clustering effect without weighting 75.32 3.65 67.96;82.68 1.65
References
6. Arruda ELM, Lopes AS. Gordura corporal, nível de atividade física e hábitos alimentares de adolescentes da região serrana de Santa Catarina, Brasil. Rev Bras Cinentropom Desempenho Hum. 2007; 9(1):05-11.
7. Barnett LM, Beurden EV, Morgan PJ, Brooks LO, Zask A, Beard JR. Six year follow-up of students who partcipated in a school-based physical activity intervention: a longitudinal cohort study.I JBNPA. 2009; 6(1).
8. Guedes DP, Guedes JERP, Barbosa DS, Oliveira JA, Staganelli LCR. Fatores de riscos cardiovasculares em adolescentes: indicadores biológicos e
comportamentais. Arq Bras Card. 2006; 86(6):439-50.
9. World Health Organization. Global strategy on diet, physical activity and health. Available from: http://who. int/dietphysicalactivity/pa/en/index.html.
10. Ceschini FL, Andrade DR, Oliveira LC, Araújo-Júnior JF, Matsudo VKR. Prevalence of physical inactivity and associated factors among high school students from state’s public schools. J.Pediatr. 2009;85(4):301-306. 1. Boletim epidemiológico de Aids. 2009. Ano IV. Available
from: http://www.aids.gov.br
2. Monasch R, Boerma JT. Orphanhood and childcare patterns in Sub-Sahara Africa: an analysis of national, surveys from 40 countries. AIDS. 2004; 18(Suppl2):55-65.
3. Onuoha FN, Munakata T. Inverse association of natural mentoring relationship with distress mental health in children orphaned by aids. BMC Psychiatry. 2010; 10(6):2-8.
4. Tshweneagae GT, Wright SD, Hoffmann WA. Mental health challenges of the lived experiences of adolescents orphaned by HIV and Aids in South Africa. Journal of Aids and HIV. 2010. 21(1):8-16.
11. Hallal PC, Bertoldi AD, Gonçalves H, Victoria CG. Prevalência de sedentarismo e fatores associados em adolescentes de 10-12 anos de idade. Cad Saúde Pública. 2006; 22(6):1277-87.
12.Oeshlschlaeger MHK, Pinheiro RT, Horta B, Gelatti C, San’Tana P. Prevalência e fatores associados ao sedentarismo em adolescentes de área urbana. Rev Saúde Pública. 2004; 38(2):157-63.
13. Kalton G. Compensating for missing survey data. Institute for Social Research. The University of Michigan. Ann Arbor, Michigan.1983.
14. Korn EL e Grauband BI. Analysis of health survey. John Wiley e Sons Sons. Inc.1999.
15.Silva NN. Amostragem Probabilística. 2ª ed. São Paulo: EDUSP; 2000.
16. Florindo AA, Romero A, Peres SV, Silva MV, Slater B. Desenvolvimento e validação de um questionário de avaliação física para adolescentes. Rev Saúde Pública. 2006; 40(4):1-8.
17.Pate RR, Freedson PS, Sallis JF, Taylor WC, Sirard J, Trost SG, Dowda M. Compliance with physical activity guidelines: prevalence in a population of children and youth. Ann Epidemiol. 2002; 12:303-8.
18. Farinatti PTV. Compêndio da atividade física. Rev Bras Fisiol Exerc. 2003; 2:177-208.
19.Gomes VB, Siqueira KS, Sichieri R. Atividade física em uma amostra probabilística da população do município do Rio de Janeiro. Cad. Saúde Pública. 2001; 17(4):969-76.
20.Gordon-Lansen P, McMurray RG, Popkin BM. Determinantes of adolescents physical activity e inactivity patterns. Pediatrics. 2000; 105(6).
21. Ayres JRCM, Segurado AAC, Galano E, Marques HHS, França – Junior I, Silva MHe col. Adolescentes e Jovens vivendo com HIV/Aids: cuidado e promoção da saúde cotidiano da equipe multiproissional. Available from: www.crt.saude.sp.gov.br/down/ManualECI_inal.pdf.
22. Pearson N, Timperio A, Salmon J, Crawford D, Biddle SJH. Family inluences on children’s physical activity and fruit and vegetable consumption. Int. J. Behavior Nutrition and Physical Activity. 2009 6(34):1-7.
23. Dollman J, Lewis NR. Interaction of socioeconomic position with psychosocial and environmental correlates of children’s physical activity: an
observational study of south Australian families. IJBNPA. 2009;6(1).
24. Lackey KJ, Kaczynski AT. Correspondence of perceived vs. objective proximity to parks and their relationship to park-based physical activity. IJBNPA. 2009; 6(1).
25. Ruiz JR, Rizzo NS, Wenlöf AHW, Ortega FB, Wärnberg J, Sjöstrom M. Relations of total physical activity and intensity to itness and fatness in children: the european youth heart study. Am J Clin Nutr. 2006; 84: 299-303.
26. Montgomery C, Reilly JJ, Jackson DM, Kelly LA, Slater C, Paton JY, Grant S. Relation between physical activity and energy expenditure in a representative sample of young children. Am J Clin Nutr. 2004; 80:591-6.
27. Leite MIFP. Brincadeiras de menina na escola e na rua: relexões da pesquisa no campo. Cad Cedes. 2002; 22(56):63-80.
28. Silva LIC, Pontes FAR, Silva SDB, Magalhães MC, Bichara ID. Diferenças de gêneros nos grupos de brincadeiras na rua: a hipótese de aproximação unilateral. Psicol Relex Crit. 2006; 19(1):114-21.
29. Pardo IMCG, Mondin ACS, Muller RCL. Associação entre índice de massa corpórea e hábitos sedentários em estudantes adolescentes. Rev Paul Pediatr. 2001; 19(4):183-86.