Received November 15, 2001 / Accepted July 18, 2002
GRAVITY SURVEY OF THE PANTANAL WETLAND:
DATA ACQUISITION AND PROCESSING
Shozo Shiraiwa
1& Naomi Ussami
2A gravity survey was conducted between 1988 and 1993, mostly during the dry season (july to october) in the Pantanal Wetland and surrounding highlands, aiming to obtain a first regional gravity coverage. The Pantanal Wetland is an important geomorphological unit extending from -54o to -59.o, east-west,
and from 14o to 23o , north-south, in SW Brazil. The topography ranges from 80 m to 200 m above sea
level within the plain. A total of 3,662 gravity stations were collected. Because of the difficulty in accessing the flood plain, apart from conventional ground survey, fluvial and air routes were used in the field data acquisition. The data acquisition procedure is described in detail and a discussion on the final gravity anomaly accuracy is presented. From the total number of stations, 7 stations belong to the Fundamental Brazilian Gravity Network, 1,886 gravity stations were obtained on bench marks, 1,505 stations were set up together with barometric levelling or the altitude was estimated from topographic maps in places with smooth topography (horizontal gradient < 0.5 m/km), 237 stations were collected along the main rivers and 33 stations using aircraft.
Key Words: Gravity survey; Pantanal wetland; Regional bouguer anomalies.
LEVANTAMENTO GRAVIMÉTRICO NO PANTANAL MATOGROSSENSE: AQUISIÇÃO E PROCESSAMENTO DE DADOS - Um levantamento gravimétrico foi conduzido entre 1988 e 1993, principalmente durante o período de sêca (julho a outubro) no interior da planície do Pantanal Matogrossense e planaltos vizinhos, com o objetivo de obter uma primeira cobertura gravimétrica regional. O Pantanal Matogrossense é uma importante unidade geomorfológica que se estende entre 54o e 59o W, leste-oeste, e entre 14o e 23o S, norte-sul, no sudoeste do Brasil. A topografia varia entre 80 m e 200 m acima do nível do mar no interior da planície. Um total de 3.662 estações gravimétricas foram coletadas. Devido à dificuldade de acessar a planície de inundação, além do levantamento gravimétrico terrestre convencional, acessos fluvial e aéreo também foram utilizados na aquisição de dados de campo. Os procedimentos de aquisição de dados são descritos em detalhe e uma discussão da precisão sobre a anomalia gravimétrica final é apresentada. Do total das estações gravimétricas, 7 estações pertencem à Rede Gravimétrica Fundamental Brasileira, 1.886 estações foram obtidas sobre referências de nível, 1.234 estações foram medidas em conjunto com um levantamento barométrico ou a altitude foi estimada a partir de cartas topográficas em locais de topografia suave (gradiente horizontal < 0,5 m/km), 237 estações foram coletadas nas margens dos principais rios e 33 estações utilizando uma aeronave.
Palavras-chave: Levantamento gravimétrico; Pantanal matogrossense; Anomalias Bouguer.
1 Depto. de Física
Universidade Federal do Mato Grosso Instituto de Ciências Exatas e da Terra
Av. Fernando Correia da Costa s/no. Cuiabá, MT, 78060-900
2 Depto. de Geofísica
Universidade de São Paulo
Instituto de Astronomia, Geofísica e Ciências Atmosféricas Rua do Matão 1226
316 Gravity Survey of the Pantanal
INTRODUCTION
Regional gravity surveys are fundamental data in applications ranging from natural resources exploration to geodesy and geodynamics. In Brazil, several institutions are responsible for conducting systematic and long term gravity data collection (see Sá et al., 1993; Molina et al., 2000 for references). However, a desired high-resolution ( < 5 km) coverage for most of Brazil is far to be completed. The average resolution of the regional gravity maps in Brazil is not better than 10 km, with large areas in the western and northern parts of the country completely devoid of gravity data. Since the initial stages of regional gravity data collection, IAG-USP adopted the procedure of setting up the gravity stations on bench marks, named as RN by the Instituto Brasileiro de Geografia e Estatística -IBGE and Diretoria do Serviço Geográfico do Exército - DSG, along the main roads. Altitudes of bench mark are obtained using geometric leveling with centimeter accuracy and spaced every 2-3 km. Most of the available bench marks in Brazil are presently gravity stations and this routine of gravity data acquisition is still used whenever a new line of bench marks is established.
The prospect to improve the regional gravity coverage in Brazil is very promissing with the use of differential GPS systems (DGPS) for altitude determination. However, the convertion from normal to orthometric altitude depends on having a high-resolution local geoid model, which in its turn depends on gravity data. Therefore, to make full use of the GPS technology, one must start from basic regional gravity information.
In the present paper we describe the gravity data acquisition in the Pantanal Wetland and surrounding highlands which resulted in a 5’x5’ Bouguer anomaly
map. The regional and residual maps are also shown and qualitatively discussed.
The regional Bouguer gravity map of the Pantanal Wetland has already been used in tectonic studies (Shiraiwa, 1994; Ussami et al., 1999) and in the geoid map of Brazil (Molina & Ussami, 1999) to study thermo-mechanical properties of the South American lithosphere.
GRAVITY SURVEY
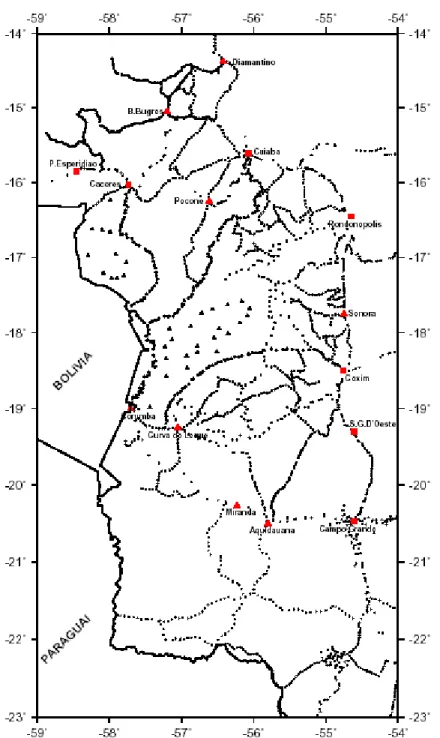
The present gravity data distribution in the Pantanal Wetland and surrounding highlands is shown in Fig. 1.
Fundamental Gravity Network
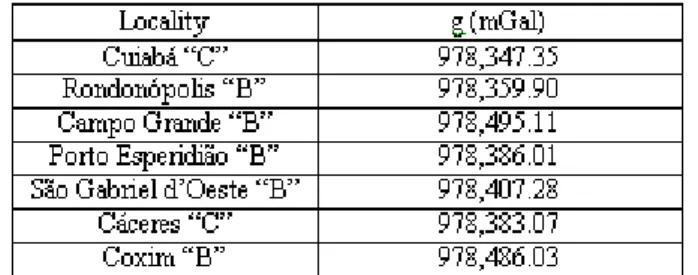
The gravity densification survey in the Pantanal Wetland used 7 gravity reference stations of the RGFB (Rede Gravimétrica Fundamental Brasileira, ON, 1987) which is referred to the IGSN71 (Morelli et al., 1971). The stations and their gravity values are listed in Table 1 and the stations are shown in Fig. 1 as full squares.
Second Order Gravity Network
Due to the extent of the region to be surveyed and the difficult condition of vehicle dislocation within the Pantanal Wetland a second order gravity network was initially established to tie the gravimeter measurements to a gravity network within the maximum time interval of 48 hours in order to minimize instrumental drift effect.
For this purpose, three Lacoste & Romberg G-type model gravimeters were used: the G-454 from Instituto de Astronomia, Geofísica e Ciências
Table 1 - Fundamental Brazilian Gravity Network (ON, 1987) used in the Pantanal gravity densification survey.
Figure 1 - Distribution of gravity stations in the Pantanal Wetland and surrounding highlands. Full squares are RBG stations, full triangles the second order gravity network, crosses are the stations on bench marks, full circles the stations along the main rivers, full small triangles the stations set up using aircraft, open circles densification gravity survey using barometers and altitude estimated from topographic maps.
Figura 1 - Distribuição das estações gravimétricas do Pantanal Matogrossense e planaltos circunvizinhos. Quadrado cheio são as estações da RBG, os triângulos cheios as estações da rede de segunda ordem, cruzes as estações sobre referências de nível (RN), círculos cheios as estações nas margens dos rios, triângulos pequenos cheios as estações utilizando aeronave, círculos vazios as estações de densificação com altitudes obtidas por barometria ou a partir de cartas topográficas.
Atmosféricas of São Paulo University, the G-613 from the Instituto de Geociências of Brasilia University and the G-881 from Instituto de Ciências Exatas e da Terra of Federal University of Mato Grosso. The measurements were carried out following the international standard recommendation for reference network. Gravity measurements were processed using
318 Gravity Survey of the Pantanal
Table 2 - Average of gravity measurements in the second order gravity network in Mato Grosso and Mato Grosso do Sul states. Values in mGal.
Tabela 2 - Média das medidas de gravidade na rede gravimétrica de segunda ordem implantada nos estados de Mato Grosso e Mato Grosso do Sul. Valores em mGal.
Table 3 - Comparison between geometric and barometric leveling in Pantanal Wetland. S.D.R.=Standard Deviation of the Residue; M.Q.R.=Mean Quadratic Residue; Max. R.=Maximum Residue; Min. R.= Minimum Residue.
Tabela 3 - Comparação entre nivelamentos geométrico e barométrico no Pantanal Matogrossense. S.D.R.=Desvio Padrão dos Resíduos; M.Q.R.=Resíduo Quadrático Médio; Max. R.=Resíduo Máximo; Min. R.= Resíduo Mínimo.
The acceleration values in mGal for this second order gravity network are shown in Table 2 and the stations are shown in Fig. 1 as full triangles.
Densification of Gravity Stations
The first data to be collected were along the main roads between cities and towns where IBGE had set
up the bench marks. They are shown in Fig. 1 as crosses. Almost the totality of horizontal coordinates of the gravity stations were obtained using the Magnavox GPS system with an accuracy of ± 100 m.
barometric leveling was carried out using two batteries of three barometers each. During data collection, bench mark stations were occupied with barometers in order to control the accuracy of the method and the operational condition of the barometers. An example of this checking is shown in Table 3. Stations where the altitude was determined using barometers are shown in Fig. 1 as open circles. Error in the estimated altitude is less than 2 meters.
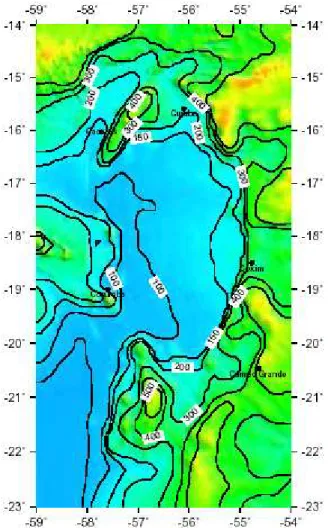
The second group of gravity data was obtained in regions more than 50 km far from bench marks. We have used two procedures: first, barometric leveling which gave a mean deviation of 5 meters and second, in regions of very smooth topography (horizontal gradient of 0.20 to 0.40 meters/km, see Fig. 2) the altitude was estimated from 1:100.000 scale
topographic maps. Stations where altitude was obtained from topographic maps are also shown in Fig. 1 as open circles.
Gravity stations were set up along the margins of three main rivers: Paraguai river (from Cáceres city to Cuiabá river conjunction) with 52 stations collected; Paraguai and Cuiabá rivers from Corumbá to Cuiabá cities where 120 stations were set up with the help of a Brazilian Navy vessel and finally, along the Taquari river from Coxim city to Porto da Manga (near Corumbá city) with 62 stations set up. Altitude for these stations was obtained using the leveling carried out by DNOS (1972) along the Taquari, Cuiabá and Paraguai rivers. The interpolated altitude has an accuracy better than ±1 meter. The river stations are shown in Fig. 1 as closed circles.
In the region of almost flat topography within the Taquari river flood plain where access by road or by boat is not possible, an aircraft was used taking advantage of landing facilities in major farms. The first line started and ended in Cáceres city, where 11 stations were set along a circuit of 200 km. A second line started and ended in Corumbá city, where 22 gravity stations were occupied along 500 km of flown distance. Because of very smooth topographic gradient (< 0.2 m/km) the altitude for these stations was estimated from the topographic maps and the stations are shown as full triangles in Fig. 1.
GRAVITY MAPS
Free-air (∆ga) and Bouguer (∆gb) anomalies for each station were calculated using the following expressions:
∆
∆
∆
g
g
h
g
g
G h
a b a
= +
−
=
−
0 3086
2
.
γ
π ρ
(1)where g is the observed acceleration, h is the orthometric altitude in meters,
γ
is the 1967 theoretical gravity formula (IAG, 1971) for latitude correction given byϕ
is the geographical latitude of the station.Figure 2 - Shaded relief map of the study area with contours in meters representing the average topography of the gridded (5 km x 5 km) data. Color version of this map also shown in the front cover of this issue.
320 Gravity Survey of the Pantanal
Figure 3 - (a) Free-air anomaly map and (b) Bouguer anomaly map. Contour interval 5 mGal. Color version of Bouguer anomaly map also shown in the front cover of this issue.
Figura 3 - (a) Mapa de anomalias ar-livre e (b) Mapa de anomalias Bouguer. Intervalo de contorno 5 mGal. A versão colorida do mapa de anomalias Bouguer encontra-se na capa deste volume.
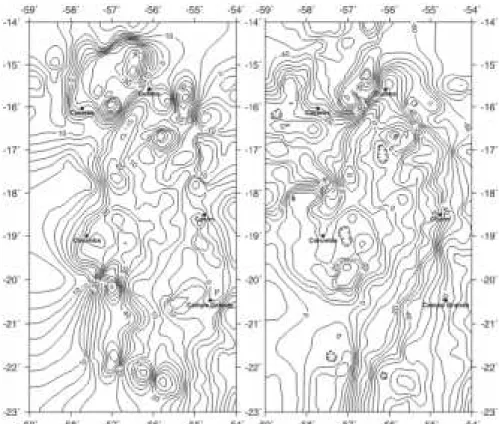
Figure 4 - Regional (left) gravity map after polynomial fitting of first degree to the map shown in Fig. 3(b). Residual gravity map (right) is the difference between map shown in Fig. 3(b) and the regional gravity map.
Figure 5 - Regional (left) gravity map after polynomial fitting of second degree to the map shown in Fig. 3(b). Residual gravity map (right) is the difference between map shown in Fig. 3(b) and the regional gravity map.
Figura 5 - Mapa gravimétrico regional (esquerda) após ajuste polinomial de grau dois ao mapa mostrado na Fig. 3(b). O mapa de anomalias residuais (direita) é a diferença entre o mapa mostrado na Fig. 3(b) e o mapa gravimétrico regional.
Figure 6 - Regional (left) gravity map after polynomial fitting of third degree to the map shown in Fig. 3(b). Residual gravity map (right) is the difference between map shown in Fig. 3(b) and the regional gravity map.
322 Gravity Survey of the Pantanal
ρ
is the average density of the crust (2,670 kg/m3)G = Universal Gravitational Constant (6.673x10⁻¹¹ N
m2 kg-2)
Free-Air Anomalies
Fig. 3a shows the free-air anomaly map in mGal. All maps in this and following sections were generated by initially averaging and resampling the data in 5’x5’ blocks using L
2 norm. Following, a 5’x5’ grid was
generated using the algorithm proposed by Smith & Wessel (1990) which use continuous splines with varying tension. This map still shows a strong correlation between gravity anomalies and topographic features of short and intermediate wavelengths.
Bouguer Anomaly and its Regional and Residual Components
Fig.3b (see color version in the front cover of this volume) shows the simple Bouguer anomaly map in mGal. The main feature is a sequence of positive anomalies aligned along a NE-SW direction, between -56o e -58o. To the east, correlating with higher
topography and over the Paraná basin the anomalies are more negatives (< -50 mGal).
In order to highlight short to intermediate wavelength gravity anomalies, associated with sources in the upper crust, results of regional-residual separation procedures using polynomial fitting are presented. They are shown in Fig. 4, 5 and 6. Color versions of all maps can be downloaded from the following internet address: www.iag.usp.br/geofisica/ pantanal.
DISCUSSION AND CONCLUSION
The uncertainty in the Bouguer anomaly is easily estimated for each station using the expression in (1). The error ranges from ±0.02 mGal for stations located on bench marks to ±0.5 mGal for stations situated more than 50 km far from a bech mark and which had its altitude determined using barometer or the altitude estimated from 1:100.000 scale topographic maps. The 5’x5’ resolution gravity map and the accuracy in anomaly determination for most of the
Pantanal Wetland provide a detailed mapping of subsurface structures in regional tectonic studies and a precision better than ±0.5 m in geoid determination. Large areas between gravity lines, especially in the southern part of the map (-19o to -23o) outside the
Pantanal Wetland should be densified using secondary roads in order to improve the gravity map resolution in this region, making full use of the higher accuracy of Bouguer anomaly determination on bench marks.
ACKNOWLEDGEMENTS
This project of data collection was supported by PADCT/FINEP and FAPESP. The senior author had UFMT PICDT-Capes Doctorate Scholarship during the period of the project. We thank Nelsi C. de Sá and Eder C. Molina for their assistance in data reduction and processing, Odilon F.Miranda Filho and Alexandrino do Nascimento for keeping the enthusiasm constant during field data acquisition. All maps were produced using GMT-System free-software by P.Wessel and W.H.F. Smith.
REFERENCES
DNOS (Departamento Nacional DE Obras E Saneamento), 1972. Estudos hidrológicos da Bacia do Alto Paraguai. Ministério do Interior, Rio de Janeiro. 4 volumes.
I.A.G. (International Association of Geodesy), 1971. Geodetic Reference System 1967. Pub. Spec. No. 3 du Bulletin Géodésique, 115 pp.
Molina, E.C. & Ussami, N., 1999. The geoid in southern Brazil and adjacent regions: new constraints on density distribution and thermal state of the lithosphere. J. of Geodynamics, 28, 357-374.
Molina, E.C., Ussami, N. & Marangoni, Y.R., 2000. Digital (5’ x 5’) Gravity Maps of the São Francisco Cráton and surrounding fold belts, margins and oceanic basins. CD-ROM with gridded data, explanatory texts and maps. ISBN 85-85047-09-7, second edition. IAG-USP, São Paulo.
ON (Observatório Nacional), 1987. Rede Gravimétrica Fundamental Brasileira, Conselho Nacional de Pesquisas, 2 volumes.
Sá, N.C. de; Ussami, N. & Molina, 1993. Gravity Map of Brazil I: Representation of free-air and Bouguer anomalies, J. Geophys. Res., 98, 2,187-2,198.
Sá, N.C. de, 1994. Redução de observações gravimétricas: teoria e prática. Instituto Astronômico e Geofísico da USP, São Paulo, 70 pp.
Shiraiwa, S., 1994. Flexura da litosfera continental sob os Andes Centrais e a origem da Bacia do Pantanal. Tese de Doutoramento, Universidade de São Paulo, São Paulo, 110 pp.
Smith, W.H.F. & Wessel, P., 1990. Gridding with continuous curvature splines in tension. Geophysics, 3, 293-305.
324 Gravity Survey of the Pantanal