Abstract— The use of wireless local area networks, called WLANs,
as well as the proliferation of the use of multimedia applications have grown rapidly in recent years. Some factors affect the quality of service (QoS) received by the user and interference is one of them. This work presents strategies for planning and performance evaluation through an empirical study of the QoS parameters of a voice over Internet Protocol (VoIP) application in an interference network, as well as the relevance in the design of wireless networks to determine the coverage area of an access point, taking into account several parameters such as power, jitter, packet loss, delay, and PMOS. Another strategy is based on a hybrid approach that considers measuring and Bayesian inference applied to wireless networks, taking into consideration QoS parameters. The models take into account a cross layer vision of networks, correlating aspects of the physical environment, on the signal propagation (power or distance) with aspects of VoIP applications (e.g., jitter and packet loss). Case studies were carried out for two indoor environments and two outdoor environments, one of them displaying main characteristics of the Amazon region (e.g., densely arboreous environments). This last test bed was carried out in a real system because the Government of the State of Pará has a digital inclusion program called NAVEGAPARÁ.
Index Terms— Bayesian Inference, Network Qualifier, Performance
Evaluation, QoS, Wi-fi.
I. INTRODUCTION
The Wireless Local Area Networks (WLANs) standard IEEE802.11 have been largely used in recent years due to their mobility, ease in configuration, and low-cost deployment. Hence, they have become an interesting alternative for industries, enterprises, among others. This technology usually supports data traffic generated by applications such as web browsing. In recent years, however, it has been used for voice communication, especially in offices [1]. The VoIP technology provides the transmission packages of voice over IP, used in the Internet, thereby reducing significantly the cost of calls when compared with those carried out by a public switched telephone network (PSTN). However, the VoIP application requires that WLAN be able to support rigid QoS specifications for voice transmission. This has been established in ITU-T (International Telecommunication Union)
New Strategies for Planning and Performance
Evaluation of Wireless Networks: Case
Studies Based on the Cross-layer Approach
Jasmine Araújo, Josiane Rodrigues, Simone Fraiha, Hermínio Gomes, João C W A Costa, Gervásio Cavalcante and Carlos Francês
G.114 recommendation and in the Wang and Fang work [2]. Due to the rigid parameter requirements of the VoIP application, the protocol has been evaluated in several test beds [3]-[5].
Performance evaluation can be realized following several techniques broadly grouped into measuring, simulation, and modeling techniques. Usually, techniques such as measurements, benchmarking, and prototyping fall into the category of measuring; these techniques are very useful when investigating the existing systems, i.e., systems that have already been built, providing accurate information for their performance evaluation and analysis [6]. On the other hand, the design and the installation of WLAN still are done without a planning strategy, thereby causing issue degradation on the users’ application performance. Moreover, many radio planning strategies have been proposed in the literature, using mathematical models to predict coverage signal [7],[8], and models including QoS specifications [2],[9],[10].
The QoS parameters such as delay, jitter, packet loss, and PMOS are important measures of real-time mulreal-timedia communications. The delay is the real-time it takes for a packet to travel from the transmitter to the receiver. Jitter is the variation of the delay time between two consecutive packets in the flow. The MOS is the average users’ opinions on the call quality, while the PMOS or the pseudo-MOS is an analytical derivation of pseudo-MOS, and it gives an indication of the user’s perception on the call quality. With the increasing use of interactive multimedia services and broadband applications, the users’ opinion takes the quality perspective into account [11]. In this paper, the performance evaluation of the QoS parameters is done through a qualification factor called ”Network Qualifier” (NQ).
Such a proposal establishes a methodology in the design and the deployment of wireless networks in indoor environments. For this evaluation, two experiments were conducted following the same measurement procedure, but in different environments. Two notebook computers created VoIP calls using the Call Gen323 software [12]. In each measuring point, three one-minute calls were made. The VoIP receiver notebook and the access point (AP) were connected to a protocol analyzer [13]. Supplementary applications were used to increase the traffic on the network. These applications provided file transfer during the transmission, generating 4 sessions of the http transfer using threads in the range of 10 microseconds (149 Kbytes). Finally, the Iperf software [14] was used as a second application running in the client mode, creating UDP streams of a specified bandwidth (7Mbps). To evaluate some QoS parameter behavior (jitter, packet loss, delay, and PMOS) versus distance, two situations were considered: the single network, i.e., without interference; and the presence of another network operating in the same frequency.
II. NAVEGAPARÁ DIGITAL INCLUSION PROGRAM
As of January 2007, the State of Pará, Brazil, with the Pará Government developed the NavegaPará program as a part of its strategic activities. This was done with the goal of creating a communications network for the interconnectivity of all government departments within the state, and for the promotion of widespread digital access to its citizens. This would benefit Pará State society by offering a wide range of services such as enabling access on the part of state and institutional educational and research units to the fiber optic network; creating a favorable atmosphere for the incorporation of technology and innovation in terms of processes and products; increasing competitive advantages within regional, national, and international plans; facilitating the implementation of company networks and agglomerations within productive setups; electronic governance; distance learning and telemedicine services.
As to the deployment of its communication network, the State of Pará signed technical cooperative agreements with several different public and private institutions to share the already existing resources and in-built infrastructures. Thus, in a short space of time, it has been possible to implement a modern communication network and create a state information superhighway with a backbone of more than 2,000 km of optical network, operating systems with transmission rates of up to 17 Gbps, servicing 15 cities in its first phase. As described below, Marituba was the first digital city of this program and one of the outdoor environment test beds.
III. SCENARIO AND METRICS
The indoor measurements were made in two buildings at the Federal University of Pará
(UFPA). The first one has classrooms, while the second is a building especially built for
research laboratories and teachers’ rooms. The outdoor measurements were made in a square
and at a University Car Park. The main differences between the aforementioned
environments is the equipments used, because in the former, an access point 802.11g Linksys
WRT54G Router Speed Booster for indoor environment was used, and in the latter, a Hot
Zone Motorola equipment was used. In the following subsections these indoor environment
will be presented.
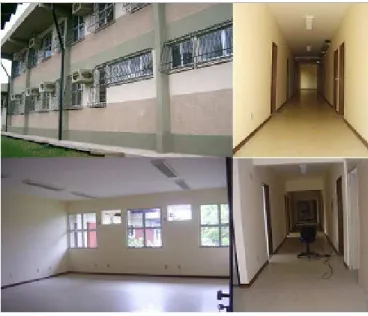
A. Classroom building
Fig. 1. Pictures of the building. Clockwise from top right: external elevation with glass windows, classroom, corridor, and external wall with corridor.
B. Research Laboratories
The metrics are collected in a two-storey brick building with lecture rooms, computer and telecommunication labs, and an anechoic camera, whose height can cover both the floors. The building has side glass windows with aluminum frames except where the anechoic camera is located. The rooms are divided by brick walls. The building is still empty and without furniture (Fig. 2).
Fig. 2. Pictures of the research laboratory building: corridors of the second and the first floors, and laboratory classroom.
In the following subsections, the outdoor environments will be presented.
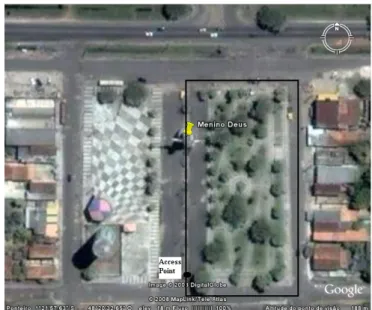
C. Marituba's Square
network of this program [15]. Fig. 3 shows a picture of the square in this city. This is highlighted by the black rectangle and the small black circle at the left-hand side of the rectangle indicates the access point being studied.
Fig. 3. Marituba's square.
D. Parking lot
The metrics were collected in a parking lot of the Federal University of Pará. Fig. 4 shows a picture of the parking lot. The area is highlighted by the red line and the blue circle at the right side of the picture indicates the access point being studied.
Fig. 4. The Federal University of Pará parking lot.
IV. MEASUREMENT METHODOLOGY
In summary, according to the methodology described in [4], the following can be seen:
Characterization of the environment parameters (physical layer) of the WLAN: The presence of obstacles, like walls, environmental aspects, among others, on the path of the radio transmission attenuates the signal power. The signal-to-noise ratio (SNR) must be also considered.
The survey of the networks or the interfering networks:
• Defines the spatial distribution of the wireless network;
• Marks and obtains the coordinates of access points to be evaluated; • Starts the application for the wireless network to be studied;
• Uses an application in the protocol analyzer to store QoS measures; • Starts application(s) in the interferent wireless network if it is used.
Definition of QoS requirements of the target application: There are several available metrics to measure the quality of a connection such as packet loss rate, one-way delay, jitter, and throughput. The ITU-T guidelines recommend a one-way delay of up to 150 milliseconds [16]. Packet loss rates up to 1% are generally acceptable for VoIP [16]. Throughput: the bandwidth required by a single VoIP connection is significantly less than the nominal capacity of IEEE 802.11 networks. Typical speech codecs require no more than 64 Kbps while 802.11g offers 54 Mbps. However, if the same access point is used to support multiple calls, there may be a capacity problem [16]. It is important to check if there are other WLANs similar to the author´s because access point channels of the neighbors could interfere with author´s. Technologies that could produce interference are: Bluetooth, microwaves, some cellular phones, other WLANs, among others [17].
Characterization of traffic for the target application:
• Running several iterations of the application target observing patterns and typical curves by
acquiring samples and using goodness-of-fit tests;
• Defining probability distribution for each performance measure studied, such as: delay,
blocking probabilities, and throughput;
• Defining the measures that must be considered in the computational models (computational
intelligence, optimization, and simulation).
Inferences were based on simulation, computational intelligence, or analytical models/optimization to verify aspects such as correlation, possible scenarios, scalability, availability, and performance.
Using the aforementioned proposed methodology, the following stages and activities were performed.
Measurement points and the positioning of the access point: some points were marked to take the measurements. For the indoor environment, the distances from the walls to the points were measured and, for the outdoor environment, the GPS coordinates were collected. Firstly, the network under analysis was installed.
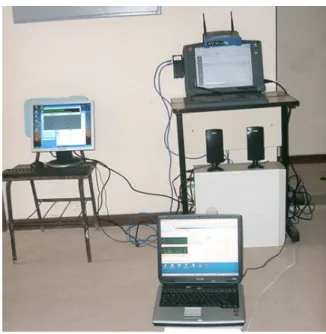
Fig. 5. Network under analysis.
Traffic Generation at Network under analysis: a notebook computer, located in the first plane in Fig. 5, was used to generate traffic in the WLAN. Files were transferred to a server in the network through APT.
VoIP Transmitter: to transmit the VoIP calls, another notebook located on a cart was used, (Fig. 6) and it was positioned in the selected measurement points.
Fig. 6. The cart with notebook running Network NetStumbler (the lower end of the picture) and the notebook running VoIP calls (the upper end).
Power Measurement: the cart carries also another notebook. The power measurement was done in each point through the Network Stumbler software [18]. This notebook was necessary because the Network Stumbler, while in use, does not allow the computer to connect to any WLAN.
(through the Netstumbler software), distance transmitter-receiver, jitter, delay, packet loss, and PMOS (measured by the protocol analyzer).
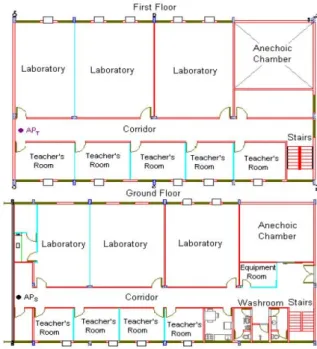
After that first measurement phase, a second one was performed using the same procedure of the first, but now, with the presence of another network using the same channel of the network under analysis, called "interference network". The access point of the interference network was positioned in the second floor in the same direction of the network under analysis, APS, in Fig. 7. The Iperf program [14] was used to generate traffic in the interference network; this makes it possible to specify the time during which this traffic is generated.
Fig. 7. Layout of the research laboratories (first and second floors) with the location of the measurement points and APs.
After this second measurement phase, the data were treated and compared to find a parameter variation in the presence of an interference network. The following section presents the results of those comparisons.
Fig. 8. Layout of the classroom building with the location of the measurement points and APs.
V. STRATEGIES USED FOR DATA ANALYSIS
A. Network Qualifier - NQ
The qualifier proposed in this paper (NQ) considers QoS standards defined through recommendations: delay - ITU-T G.114; jitter - ITU-T Y1540; packet loss - ITU-T Y.1541; and PMOS in [19]. Based on these reference values, the following thresholds were adopted: delay smaller or equal to 250ms; jitter smaller or equal to 30ms; packet loss smaller or equal to 1%; and PMOS larger or equal to 3. Through the use of these threshold values, a network qualifier was defined.
NQ=A/T*100 (1)
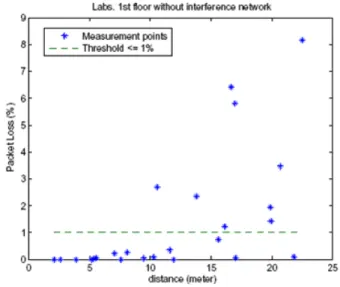
A is the number of samples inside, standardized by the ITU-T threshold value, and T is the total number of the collected samples. Fig. 9 presents points with the values of packet loss obtained for each distance, with the threshold value of 1% represented by a dashed line. In Fig. 9 (packet loss without interference network and at research laboratories), the NQ is equal to 64%, i.e., in 16 measurement points, of the existing 25; and the parameter packet loss is below the threshold of 1%. This NQ will be used in the analysis of the other results of the indoor measurements presented in this paper.
B. Bayesian Networks
The process of knowledge discovery in database (KDD) is a technology that is widely used to search the existing parameters in the data. Therefore, its main objective is to find valid and potentially useful patterns from the data. The extraction of knowledge from data can be seen as a process with at least the following steps: understanding the application domain, selection and preparation of the data, data mining, evaluation of the extracted knowledge, and consolidation and the use of the extracted knowledge. Once in the data mining stage, taking into consideration the core of the KDD process, methods and algorithms are used for the knowledge extraction from the database. This stage involves the creation of appropriate models representing patterns and relations identified in the data. The results of these models, after evaluation by the analyst, specialist and/or final user, are used to predict the values of attributes defined by the final user based on new data. In this study, the computational intelligence algorithm used for data mining was based on Bayesian networks. A Bayesian network is composed of several nodes, where each node of the network represents a variable, that is, an attribute of the database; in the relation of dependency, directed arcs connecting them imply the variable can possess over the others; and finally probability tables for each node.
The Bayesian networks can be seen as coding models of the probabilistic relationships between the variables that represent a given domain. These models possess a qualitative representation of the dependencies between the nodes and a quantitative (conditional probability tables of these nodes) structure as components, which can evaluate, in probabilistic terms, these dependencies. These components together provide an efficient representation of the joint probability distribution of the variables of a given domain. One of the major advantages of the Bayesian networks is their semantics, which facilitates, given the inherent causal representation of these networks, the understanding and the decision-making process for the users of these models. Basically, the relations between the variables of the domain can be visualized graphically, besides providing an inference mechanism that allows quantifying, in probabilistic terms, the effect of these relations [20].
VI. RESULTS
A. Network Qualifier Results
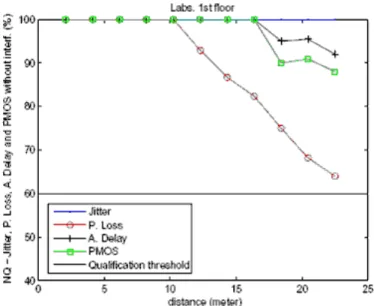
Fig. 10. QoS parameter variation with distance to the research laboratories without interference.
Fig. 11. QoS parameter variation with distance to the classroom building without interference.
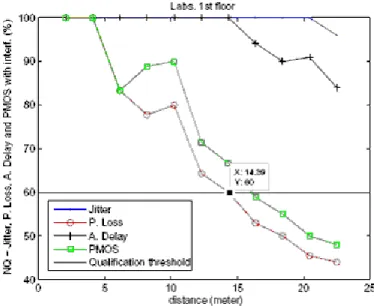
Fig. 12. QoS parameter variation with distance to the research laboratories with interference.
Fig. 13. QoS parameter variation with distance to the classroom building with interference.
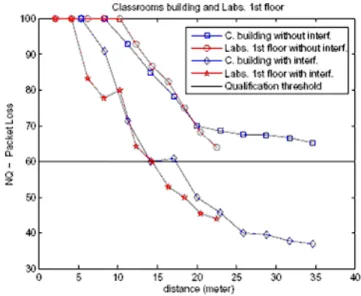
Fig. 14. The behavior of the packet loss parameter with distance to both environments studied.
B. Bayesian Inference Results
This section discusses the measurements of the application and physical layers as well as the results obtained by Bayesian networks. The study involves processing the measured data with the Bayesian network technique [5]. In any process of knowledge discovery, there is a pre-analysis phase of processing (soft mining) the data where information that does not to contribute to the final result is removed. Hence, the input fields for the Bayesian network were obtained from the protocol analyzer after the pre-analysis. They worked as the input to the free version Bayesware Discoverer(BDD) commercial software [21].
1) Indoor Environment - Research laboratory:
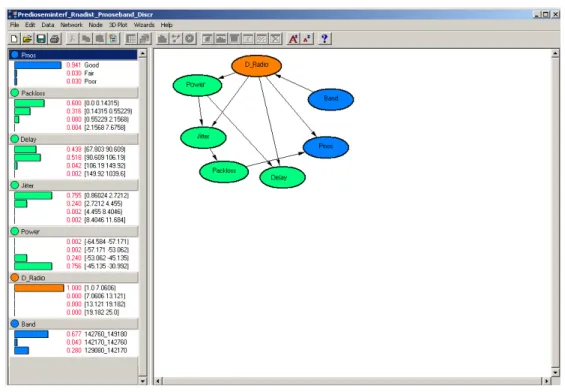
The inference results related to distance with the best value are presented in Fig. 15. The probability of a throughput lying within 142760.0 to 149180.0 bps is 67.7%. The results for other metrics are described as follows: in the case of packet loss, the probability of loss lying within 0 to 0.14% is 60.0%. This value added to the second interval of a larger probability (31.6%) results in the probability of 91.6% of packet loss for lying within 0 to 0.55% (recommended less than 1%). Considering now the jitter, its probability for lying within 0.86 to 2.72 ms is 75.5% (the maximum recommended is 30 ms). Finally, the PMOS probability values of lying between 4.0 and 4.9(Good) are 94.1% (the values of PMOS were codified in agreement with the ITU-T Recommendation P.800 [22]).
beyond 19 meters of the access point (distances less than 19 meters can be treated as acceptable QoS parameters for half of the time).
Fig. 15. Bayesian networks with best distance inference applied to ground floor.
Fig. 16. Bayesian networks with worst throughput inference applied to ground floor.
2) Outdoor Environment - Marituba's Square
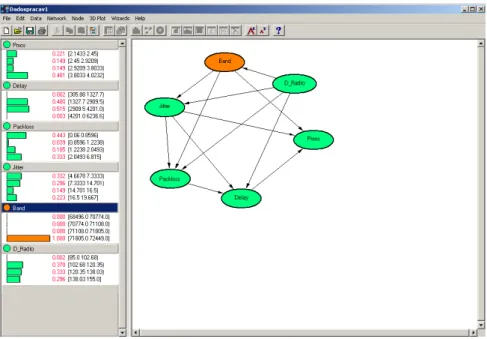
Fig. 17 presents the inference results related to throughput with the best value. In the case of packet loss, the probability of loss lying between 0 to 0.85% is 44.3%. Considering now the jitter, its probability of lying between 4.66 to 7.33 ms is 33.2%. Finally, the probability value of the PMOS lying between 3.8 (Fair) to 4.02 (Good) is 48.1% (the values of PMOS were codified in agreement with the ITU-T Recommendation P.800 [22]).
jitter probability of being greater than 16.5 ms is 47.8%. The PMOS has a probability value of 51.8% of lying between 2.45 and 2.92 (Poor). Finally, the probability of the throughput metric lying between 68496 bps and 70774 bps is 51.8%.
Through the use of Bayesian networks, the QoS parameters applied to the outdoor environment were degraded even in the best situation of the network, i.e., the best throughput. Referring to the worst case collected, the parameters degraded, but the achieved distances are larger than those in the indoor environment, i.e., 155 meters and 19 meters for the indoor environment. The difference between the equipments used can be the reason for this, but the densely arboreous environment contributes to both. The use of this computational intelligence helps the decision maker in choosing the best point to locate the access point and see how the Qos parameters will behave.
Fig. 17. Bayesian networks with the best throughput inference applied to Marituba's square.
Fig. 18. Bayesian networks with the worst distance inference applied to Marituba's square.
Fig. 19 presents the inference results related to the best distance. In the case of packet loss, the probability of loss equal to zero is 87.1%. Considering now the jitter, its probability for lying within 2.66 to 3.33 ms is 61.5%. Finally, for the PMOS, the probability value for lying within 3.89(Fair) to 4.02(Good) is 39.3% (the values of PMOS were codified in agreement with the ITU- T Recommendation P.800 [22]).
Another inference performed is the selection of the worst distance in Fig. 20. The packet loss for the network with an inference of the worst distance is 61.4%, which is greater than 5%. The jitter probability value is 77.5% when lying within 15.95 and 34.66 ms. The PMOS has a probability value of 76.9% when lying between 0 and 2.48 (Poor). Finally, the probability of the throughput metric lying between 57297 bps and 69527 bps is 75.5%. The use of this computational intelligence helps the decision maker in choosing the best point to locate the access point and how the Qos parameters will behave.
Fig. 20. Bayesian networks with the worst distance inference applied to a parking lot.
VII. CONCLUSIONS
This paper presented an empirical study concerning the behavior of the QoS parameters of a VoIP application in an 802.11g network. The study was performed in two different environments, characterizing two types of scenarios: (a) single network; (b) interference network. This was done to establish the correlation between the behavior of the QoS parameters and the distance. A network qualifier was proposed, taking into account the number of samples collected above or below the acceptable level, according to the international specifications for each metric. A threshold value of 60% was selected. This value can change according to the planner's criterion.
This work proposed a planning strategy for the WLAN access point coverage range determination based on the QoS parameters. This was done by joining measurement campaign techniques and a Network Qualifier definition. The results show that the packet loss metric was the most degraded one. This fact, combined with the NQ qualifier, plays an important role in the design of WLANs. The coverage area can be determined with the help of an NQ qualifier. In this work, 60% was used for both environments, thereby producing a range of 14 meters.
In a real building, there is a very strong trend of finding similar scenarios to the ones presented in this paper, where different networks cohabit and where it is desirable that applications with rigid parameters of QoS are carried out. Another important contribution can be seen in Fig. 14. The packet loss behavior is almost the same in the two environments. Thus, a decision model can be built to assist in making similar environments to the measured ones.
The next step in this work is to perform other measurements in other environments to validate the proposed strategy. One limitation of this research is the fact that it has used only VoIP applications, therefore, future works include tests with video applications and the evaluation whether this methodology is efficiently maintained.
The main contribution of the Bayesian strategy is the use of computational intelligence to differentiate the two environments and the robustness of the methodology proposed here. Another contribution is the installation of new hot spots at digital cities in the State of Pará. This methodology will help the decision makers locate the access point to better attend the public offices. It is important to mention that the Bayesian network offers an approach of selecting several scenarios of QoS. Therefore, it is possible to guarantee a minimum distance to the AP for VoIP applications in an indoor or outdoor WLAN environment.
perform evaluation and to assist in the WLAN design. Bayesian networks were also used to establish a correlation between the aforementioned metrics and to assist in the WLAN design. The use of the cross-layer approach is a new contribution that shows the influence of the physical layer metrics, i.e., power and distance, in the behavior of high-layer metrics.
ACKNOWLEDGMENT
The authors would like to thank the UFPA and the Brazilian Foundations, viz. The State of Pará Research Foundation (FAPESPA), The National Council for Scientific and Technological Development (CNPq), and National Institute of Science and Technology - Wireless Communication (INCT-CSF) for the support provided for the research described in this paper. The authors would also like to thank the data processing company of the government of the State of Pará (PRODEPA) for allowing use of its equipments for the outdoor measurements.
REFERENCES
[1] Medepalli K., Gopalakrishnan P., Famolari D. and Kodama T., Voice capacity of IEEE 80211b, 80211a and 80211gWireless Lans, Globecomm 2004, IEEE Communications Society, 3, 1549-1553.
[2] Wang Z. and Fang Y., Providing statistical QoS guarantee for voice over IP in the IEEE 802.11 Wireless LANs, IEEE Wireless Communications 2006, v. 13, 36-43.
[3] Araújo J., Rodrigues J., Fraiha S., Lamarão F., Vijaykumar N., Cavalcante G. and Francês C., The planning approach for interference networks in QoS parameters in a WLAN 802.11g, Proceedings of The International Symposium on Performance Evaluation of Computer and Telecommunication Systems SPECTS 2007, 419-428.
[4] Araújo J., Rodrigues J., Fraiha S., Lamarão F., Vijaykumar N., Cavalcante G. and Francês C., The influence of interference networks in QoS parameters in a WLAN 802.11g, Proceedings of The Fifth International Symposium on Parallel and Distributed Processing and Applications ISPA 2007, v. 4742, 932-945.
[5] Araújo J., Rodrigues J., Fraiha S., Gomes H., Reis J., Vijaykumar N., Cavalcante G. and Francês C., The influence of interference networks in QoS parameters in a WLAN 802.11g: a Bayesian approach, Society of Photo-Optical Instrumentation Engineers SPIE 2007, Conference Broadband Access Communication Technologies II, v. 6776, 677604-1- 677604-12.
[6] Francês C. et al, Performance evaluation based on system modeling using Statecharts extensions, Simulation Modelling Practice and Theory 2005, v. 13, 584-618.
[7] Hills A., Large-scale wireless LAN design, IEEE Communications Magazine 2001, v. 39, 98-107.
[8] Wang Y., Cuthbert L., and Bigham J., Intelligent radio resource management for IEEE 802.11 WLAN, Proceedings of IEEE Wireless Communications and Networking Conference 2004, v. 3, 1365-1370.
[9] Lu J., Jaffres-Runser K., Gorce J., Valois F., Indoor WLAN Planning with a QoS Constraint Based on a Markovian Performance Evaluation Model, IEEE International Conference on Wireless and Mobile Computing, Networking and Communications 2006, 152-158.
[10]Lu J., Valois F., Performance evaluation of 802.11 WLAN in a real indoor environment, IEEE International Conference on Wireless and Mobile Computing, Networking and Communications 2006, 140-147.
[11]Gulliver S. and Ghinea G., The perceptual and attentive impact of delay and jitter in multimedia delivery, IEEE Transactions on Broadcasting 2007, v. 53, 449-458.
[12]Callgen Software. Available at: http://openh323.sourceforge.net/, 2012. [13]Performer Analyzer. Available at: http://www.radcom.com, 2012. [14]Iperf Software. Available at: http://dast.nlanr.net/Projects/Iperf, 2012. [15]NAVEGAPARA Program. Available at: http://www.prodepa.gov.br, 2012.
[16]Conceição A., Li J., Florêncio D., Kon F., Is IEEE 802.11 ready for VoIP?, 8th International Workshop on Multimedia Signal Processing 2006.
[17]Diaz L., Diaz J., A Model for Designing WLAN's 802.11 for VoIP, Proceedings of the Electronics. Electronics, Robotics and Automotive Mechanics Conference, IEEE Computer Society 2006, v. 2, 110-115.
[18]Network Stumbler. Available at: http://www.netstumbler.com, 2010.
[19]Cotanis I., Speaker bias in speech quality evaluation over end-to end communication links, Wireless Communications and Networking 2003, v. 2, 1107-1111.
[20]Santana A., et al. Strategies for improving the modeling and interpretability of Bayesian Networks. Data Knowl. Eng. 2006, doi:10.1016/j.datak.2006.10.005.