Horizontal projections of area 17 in
Cebus monkeys: metric features, and
modular and laminar distribution
Departamento de Fisiologia, Universidade Federal do Pará, Belém, PA, Brasil A.K.J. Amorim and
C.W. Picanço-Diniz
Abstract
Metric features and modular and laminar distributions of intrinsic projections of area 17 were studied in Cebus apella. Anterogradely and retrogradely labeled cell appendages were obtained using both saturated pellets and iontophoretic injections of biocytin into the operculum. Laminar and modular distributions of the labeled pro-cesses were analyzed using Nissl counterstaining, and/or cytochrome oxidase and/or NADPH-diaphorase histochemistry. We distinguished three labeled cell types: pyramidal, star pyramidal and stellate cells located in supragranular cortical layers (principally in layers IIIa, IIIb α, IIIb ß and IIIc). Three distinct axon terminal morphologies were found, i.e., Ia, Ib and II located in granular and supragranular layers. Both complete and partial segregation of group I axon terminals relative to the limits of the blobs of V1 were found. The results are compatible with recent evidence of incomplete segregation of visual information flow in V1 of Old and New World primates.
Correspondence
A.K.J. Amorim R. São Salvador, 30/310 Bairro Flamengo
22231-130 Rio de Janeiro, RJ Brasil
Received January 30, 1997 Accepted September 30, 1997
Key words
•V1 intracortical projections
•Neurons
•Axon terminals
•Visual cortex
•Primate
Introduction
Intrinsic connections in the primate vi-sual cortex have been the subject of a num-ber of recent studies on several visual areas (1-10). For reviews see also Lund et al. (11) and Casagrande and Kaas (12). These re-sults suggest different cell morphologies, laminar origins, targets and degrees of modular segregation for intrinsic connec-tions of the primate brain encouraging fur-ther investigation on the morphofunctional organization of those connections. Hori-zontal connections of particular interest to the present study have shown different de-grees of segregation linking different corti-cal compartments (1,3,5,7,11,13-15). Stud-ies using high resolution neurotracers such as peroxidase or biocytin in New World primates (2,4,14,16) emphasize the degree
of modular segregation for intrinsic connec-tions. However, so far there are no studies correlating metric features of intrinsic axon terminals with their laminar or modular dis-tribution in V1 of New World primates. Thus, the present study is the first detailed description of the intrinsic projections of V1 of Cebus apella attempting to address two questions, i.e., the morphometric fea-tures of the intrinsic projections as well as the modular and laminar distributions of the neuronal processes.
A partial description of some of these results has been presented elsewhere (17).
Material and Methods
(0.55 mg/kg) prior to surgery. Supplemen-tary doses were given as needed. Five to 15 iontophoretic injections of 5% biocytin di-luted in 0.1 M Tris/0.2 M KCl, pH 7.9, were made into the operculum of each hemisphere of two subjects. A 7-10-µA DC negative current was applied through pipette tips 20-50 µm in diameter (7 s on, 7 s off) to deliver the tracer for a period of 10-20 min. Three other animals received implants of saturated biocytin pellets in the operculum (18). Double or triple labeling with cytochrome oxidase (CYTOX) and/or NADPH-diaphorase (NADPH-d) and biocytin was perfomed on the same sections. Histochemical reactions for metabolic markers were carried out be-fore the biocytin reaction according to the protocols of Wong-Riley (19) for CYTOX and of Scherer-Singler et al. (20) for NADPH-d. Before the histochemical reaction for the visualization of biocytin-labeled terminals, sections were incubated in avidin-biotin com-plex (ABC) followed by histochemistry for horseradish peroxidase (HRP) using the glu-cose oxidase-diaminobenzidine (DAB)-nickel protocol of Shu et al. (21). After processing, the sections were mounted on gelatinized slides, dehydrated, cleared and coverslipped with DPX (a mixture of distyrene, tricresyl phosphate and xylene). In order to identify cortical lamination some sections were coun-terstained with cresyl violet.
For 3-D computer reconstruction each process was digitized directly from the slide using a 60X oil immersion objective (Nikon) on a Nikon microscope with a motor-driven Z-encoder which allowed the x, y and z coordinates of the points entered to be stored in a computer (Silicon Graphics Personal Iris, Mountain View, CA). For the purposes of the present investigation we only digitized processes that were included in just one 150-200-µm thick tangential or parasagittal sec-tion; they do not necessarily correspond to a complete reconstruction of the whole axonal or dendritic tree. For 3-D reconstruction we only sampled axon terminals and dendritic
trees that displayed true ends along the sec-tion. Smaller trees showing thicker cut ends were not included in the sample. All soft-ware for data entry and data analysis was developed in the Neurobiology Research Center Imaging Facility (Birmingham, AL, USA) by J. Gemmill. We measured a num-ber of metric features including densities of branching points, branches and boutons, com-bined with segment length analysis and branching angles. To assess the average den-sity of branching points, branches or boutons, we simply divided the total number of ap-pendages by the total length of the dendrite or axon terminal. The total length of the dendritic trees or axon terminals was ob-tained by adding the length of all segments. At all branching points we measured the angle (in degrees) between each pair of den-dritic or axon segments. Since shrinkage in the z axis would impose a distortion of the angle between branches the digitized images of neurons were “stretched” by the degree of tissue shrinkage assuming the shrinkage pro-cess to be linear. To compute the angle be-tween each pair of branches of the same parental segment we assumed that 3 sam-pling points away from the branching points were linked by a straight line. The angle between these straight lines was then meas-ured. The means were calculated for den-drites and for each group of axon terminals and the t-test (P<0.05) was applied in each case to evaluate the statistical significance of the differences.
Results
Cortical layers and blobs
text and in the figures. Blobs are indicated by arrows in layer III (Figure 1A). Note that layer IV (IVc according to Brodmann’s nomencla-ture) shows at least three distinct sublaminae with the lower third portion of the lamina being much darker than the more superficial two thirds. However, the upper two thirds can also be subdivided into sublaminae: the most superficial and thickest portion of layer IV showed poor NADPH-d activity. Layers V and VI are distinguished from each other by the more intense reactivity of layer VI for NADPH-d histochemistry (see also Figure 5A). This pattern of reactivity for NADPH-d for V1 of Cebus apella, with clear modular and laminar organizations illustrated in
Fig-Figure 1 - Parasagittal section reacted for NADPH-d (A) and counterstained with Nissl (B) to visualize the corti-cal layers. Layer numbers according to Hässler’s (22) nomenclature modified by Lachica et al. (4). Open ar-rows point to blobs. Scale bar 200 = µm.
Figure 2 - Low power photomicrograph of a tangential section through V1 double labeled for biocytin and cytochrome oxidase (CYTOX) illustrating a biocytin ion-tophoretic injection site (open arrow) relative to the CYTOX blobs. Filled arrows point to a row of blobs and arrowheads point to individual blobs. Scale bar = 400 µm.
Figure 3 - Photomicrographs of retrogradely labeled cells of V1
after implanting biocytin gels. A,
Low power photomicrograph il-lustrating two distinct rows of labeled neurons in the superfi-cial and deep portions of layer
III. Scale bar = 400 µm. B, High
power photomicrograph show-ing different size pyramidal cells in the superficial sublayers (IIIa
and IIIb). Scale bar = 100 µm. C,
Typical stellate cell from layer IIIc (IVb). Scale bar = 20 µm. I
II III
IIIb IIIc
IV V
Figure 4 - Camera lucida drawings of retrogradely labeled
cells of V1 after implanting biocytin gels. A, Star
pyrami-dal; B, pyramidal; C, stellate neurons. Arrowheads point to
axons. Insets illustrate the location of these cells relative to the cortical layers. SB, white matter.
I II III (IVa) IIIb ß
(IVb) IIIc (IVc) IV V VI SB
50 µm
I II III (IVa) IIIb ß
(IVb) IIIc (IVc) IV V VI SB
50 µm
I II III (IVa) IIIb ß
(IVb) IIIc (IVc) IV V VI SB
50 µm
A
B
ure 1, is similar to that previously described by Rosa et al. (24) using CYTOX histochem-istry. The borders of the major subdivisions between cortical layers, as revealed by NADPH-d histochemistry in the present study, are virtually the same as obtained by Nissl staining and they were more evident in a double-labeled section (Figure 1B). Figure 2 is a low power photomicrograph of a tangen-tial section of V1 to illustrate the size of a biocytin iontophoretic injection site (open ar-row) in relation to the blobs of cytochrome oxidase, after double labeling. We observed well-individualized blobs (arrowheads) or rows of confluent blobs (small filled arrows) forming beaded strips.
Cell morphology and laminar distribution
Figure 3 illustrates retrogradely labeled cells of V1 after implantation of biocytin gels. At low power (Figure 3A) at least two distinct horizontal rows of labeled neurons can be seen in the superficial (layers IIIa and IIIb) and deep portions of layer III (layer IIIc). At high power (Figure 3B) pyramidal cells of different sizes can be seen in the superficial layers (IIIa and IIIb) with long apical dendrites and basal lateral dendrite tufts. Figure 3C illustrates a typi-cal stellate cell from layer IIIc (IVb) show-ing the stellate pattern of dendritic branch-ing and no apical dendrite. Similar results were obtained after the iontophoretic injec-tions, except for the fact that in these cases retrograde transport was much less signifi-cant, precluding the possibility of clearly identifying neuron morphology. Figure 4A,B,C illustrates camera lucida drawings of pyramidal and stellate neurons. A par-ticular type of pyramidal cell, the star pyra-mid of layer IIIc (IVb), is shown in A; B and C represent pyramidal and stellate cells, respectively.
Thus, three different cell morphologies were found after retrograde transport of biocytin: pyramids, star pyramids and
stel-late cells. Pyramidal cells were mainly but not exclusively located in supragranular layers, predominantly in layers IIIa and IIIb, with highest density being observed in IIIa. Stellate cells and star pyramids were lo-cated particularly in layer IIIc (IVb). In register with the injection site (Figure 5A,B), we also found pyramidal cells in infragranular layers. However, no retro-grade labeling was observed beyond the limits of the injection site in infragranular layers (Figure 5A).
Figure 5 - A, Low power
photo-micrograph illustrating antero-grade and retroantero-grade transport near the injection site. Scale bar
= 500 µm. B, High power
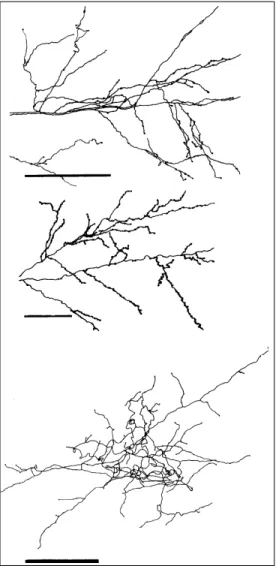
6). Each axonal tree displayed principal (thicker), intermediate and terminal (thin-ner) segments. The principal segment was identified nearest the injection site, isolated from the other branches. In type I axon terminals this segment ran larger distances than type II terminals before giving rise to new branches. Two groups of type I axon terminals were distinguished: type Ia (Figure 6, top) showed a number of interme-diate and terminal branches that organized themselves, forming small patches intercon-nected by long segments not covered with cell appendages; type Ib (Figure 6, middle) axon terminals, in contrast to type Ia, did not form patches, but gave rise to a number of intermediate branches along the principal segment. The principal segment became thin-ner as it diverged to give rise to new distal branches. Type II axon terminals (Figure 6, bottom) displayed a rather compact and com-plex arborization, with almost no variation in the thickness of their branches, rendering it very difficult to identify the principal seg-ment. They showed very short and thick intermediate segments branching in various directions. Figure 7 shows typical “en passant” and “terminaux” boutons for dif-ferent axon terminals. Table 1 summarizes the qualitative characteristics of these groups.
Laminar distribution
Iontophoretic injections including layers I to IV in the operculum of V1 were used to study the laminar distribution of intrinsic axon terminals (Figure 5A). The results are summarized in Tables 2 and 3. Using the criteria previously described for sampling axon terminals for reconstruction, 76% of all cases could be classified as belonging to group I. The identification of the principal segment of type II axon terminals was not as clear as for type I axon terminals.
All type I axon terminals were found in the supragranular layers, especially in layers
Figure 6 - Camera lucida drawing (top) and 3-D reconstructions (middle and bottom) of axon
ter-minals in V1. Top, Type Ia axon;
middle, type Ib axon; bottom,
type II axon. Scale bar = 100 µm.
Morphology and modular and laminar distributions of intrinsic axon terminals
III (IIIa, IIIb α (IIIb), IIIb ß (IVa) and IIIc (IVb)). Some type I terminals had their pri-mary branches in layers I, II and III (AXI4, AXI5, AXI7; Table 2) and tree in the same layers. Most of type I axon terminals had their primary segment restricted to a single layer, running along varying distances be-fore giving rise to end branches that, in general, were not restricted to a single layer. This fact may indicate that these axons could participate in interlaminar circuits within one cortical area. In the case of type II axon
Figure 7 - High power photomicrographs illustrating “en passant” and “terminaux” boutons for different
axon terminals. Top, Type Ia axon; middle, type Ib axon;
bottom, type II axon. Arrows point to “en passant”
boutons. Arrowhead points to “terminaux” bouton. Scale bars = 100 µm.
Table 1 - Qualitative analysis of intrinsic axon terminals
of V1 of Cebus apella.
Axon Patches Boutons Branching
terminal pattern
“En passant” “Terminaux”
Ia + + + sparse
Ib - + - sparse
II - + - dense
Table 3 - Laminar distribution of supragranular
type II axon terminals of V1 of Cebus apella.
Terminals Layers
AXII6 IIIb ß, IIIc
AXII9 IIIb α, IIIb ß, IIIc
AXII10 IIIc, IV α
AXII11 IIIb ß, IIIc
terminals, terminal arborizations did not ex-ceed the limits of one or two sublayers. Thus, it is possible that type II terminals play a role in regulating both inter- and intralami-nar activity through possible synaptic con-tacts with neurons located in the same layer.
Modular distribution
Figure 8 and Table 4 illustrate the differ-ent degrees of segregation as well as the spatial distribution of axon terminal
arboriza-Table 2 - Laminar distribution of type I axon terminals of
V1 of Cebus apella.
Axon Principal segment End segments
terminals
AXI1 IIIb ß II, IIIa, IIIb α, IIIb ß, IIIc
AXI3 IIIc/IV α II, III
AXI4 II/III I, II
AXI5 II/III I, II, III
AXI7 I I, II
AXI12 IIIc IIIa, IIIb, IIIc
tions in relation to the modular organization of V1. In order to correlate intrinsic axon terminals with the cortical modular organi-zation we used the procedures described in the Methods section. Quantitative analysis of the injection sites revealed diameters of 237 to 520 µm that in some cases were wider than the blob diameters (Figure 2). Ionto-phoretic injections produced a dense label-ing of fibers around the injection sites, with a radial pattern of distribution similar to that described by Livingstone and Hubel (13,14). Retrograde labeling around the injection site was less intense. Primary segments of axon terminals of type I could be followed to distances varying from 160 to 732 µm. Their patches, in extreme cases, covered cortical areas measuring 80 x 390 µm in tangential sections. Axon terminals were reconstructed from the borders of the injection sites to the end of their distal processes. Double label-ing for biocytin and CYTOX in tangential sections of the operculum permitted an easier definition in a single section of the limits of the blobs relative to the area covered by axon terminals. Only type I axon terminals were used for this analysis and the results are summarized in Table 4.
We found three groups of axon terminals with respect to the degree of modular segre-gation: 1) complete segregation of terminals inside (Figure 8A) or outside blobs (Figure 8B), and 2) incomplete segregation of termi-nals with indiscriminate innervation of both blob and interblob areas (Figure 8C).
Metric features of intrinsic axon terminals
Thirty axon terminals were analyzed us-ing 3-D automatic microscopy and 14 of them were used for statistical analysis. Four axon terminals from group II and 10 from group I were selected for quantitative analy-sis based on the criteria previously described. For quantitative analysis the following ana-tomical parameters were considered: total length of the axonal tree, branching angle
Figure 8 - 3-D reconstructions of axon terminals in relation to the
modular organization of V1. A,
Complete segregation inside
blobs. Scale bar = 400 µm. B,
Complete segregation outside
blobs. C, Incomplete
segrega-tion. Scale bars in B and C = 100 µm.
A
B
C
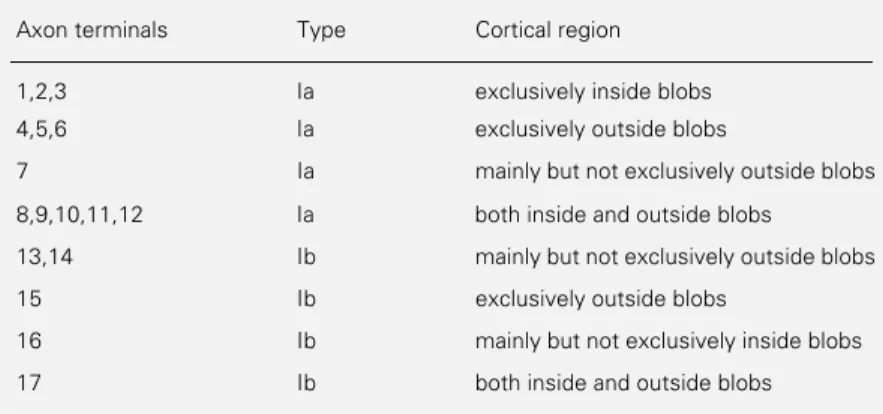
Table 4 - Segregation pattern of intrinsic axon terminals of V1 of Cebus apella.
Axon terminals Type Cortical region
1,2,3 Ia exclusively inside blobs
4,5,6 Ia exclusively outside blobs
7 Ia mainly but not exclusively outside blobs
8,9,10,11,12 Ia both inside and outside blobs
13,14 Ib mainly but not exclusively outside blobs
15 Ib exclusively outside blobs
16 Ib mainly but not exclusively inside blobs
B Normalized frequency Angle (degree) Normalized frequency Angle (degree) A
Figure 9 - Branching angles of individual axon terminals
of V1 of Cebus apella. A, Type I; B, type II.
Figure 10 - Metric features of intrinsic axon terminals of V1 comparing density values per
mm of axon length. A,
Branch-ing points; B, boutons; C,
seg-ments.
Figure 10 shows that group II axon termi-nals tended to present, on average, a more ramified and compact branching pattern (4.22 ± 1.5 branching points/mm, mean ± SD, N = 134) (Figure 10A), smaller cortical territory innervation with shorter (5.1-186 µm) and denser intermediate segments (8.43 ± 3.4 segments/mm, mean ± SD, N = 259) (Figure 9B) but higher density of potential synaptic sites (21.2 ± 8.1 boutons/mm, mean ± SD, N = 634) (Figure 9C) when compared with group I that showed 0.67 ± 0.3 branching points/mm, mean ± SD, N = 341; 1.43 ± 0.7 segments/mm, mean ± SD, N = 702, and 5.7 ± 3.9 boutons/mm, mean ± SD, N = 2518, and innervated a larger cortical area with longer intermediate segments (5.0-841 µm). In all cases, the t-test for evaluation of statis-tical differences was significant (P<0.05).
Discussion
Cortical lamination
In the present study we used the terminol-ogy of cortical lamination previously pub-lished by Lachica et al. (4), and modified by Hässler (22). Two aspects of our results made the use of this nomenclature more adequate: 1) supragranular layers in V1 of primate vi-sual cortex give rise to both extrinsic and intrinsic projections (12). Thus, layer IVb of Brodmann’s terminology which has been la-beled in Cebus apella, both intrinsically (pres-ent study) and by implanted saturated pellets of biocytin in V2 (Amorim AKJ and Picanço-Diniz CW, unpublished results), can be in-cluded as part of layer III. 2) Large intrinsi-cally and extrinsiintrinsi-cally labeled pyramidal cells and densities of branching points, branches,
and boutons. Analysis of these parameters revealed striking differences between groups I and II. Figure 9 illustrates the results of branching angle analysis for individual axon terminals of types I (Figure 9A) and II (Fig-ure 9B). Note the sharp distribution of branch-ing angles for type I axons (peak values between 45o and 90o) compared with the
distribution for type II which, although dis-playing a wider distribution, shows a higher frequency of values greater than 90o.
On average, group I tended to show acute branching angles (67.5 ± 29o, mean ± SD, N
= 338) when compared with group II, which displayed straight angles (91.2 ± 34.3o, mean
± SD, N = 120; P<0.05, t-test).
Branching points/mm 6 5 4 3 2 1 0 I A Boutons/mm 30 25 20 15 10 5 0 Segments/mm 12 10 8 6 4 2 0 B C I I
II II II
Axon terminals Axon terminals Axon terminals 100 90 80 70 60 50 40 30 20 10 0 45
90 135 >135
have been found in layer IVb (Brodmann’s terminology) of Cebus in the present study, an uncommon finding for layer IV of the primate brain, as reported by Casagrande and Kaas (12).
The present results confirm and extend previous data demonstrating that biocytin can be employed for high resolution retrograde and anterograde neurotracing (7,18,25-29) combined with cytochrome oxidase (26) and with NADPH-diaphorase with better results than those obtained with peroxidase in pri-mate visual cortex (11).
Anatomical reconstruction of dendritic trees or axon terminals in single thick sections assumes that part of the tree is lost in adjacent sections. Incomplete reconstructions require the use of only metric features that do not depend on the order of the segment for data comparison. This measure leads to both quali-tative and quantiquali-tative consistency of the data, which show, on average, the same tendency in each individual group. The quantitative differences observed between groups I and II were statistically significant, a fact that vali-dates the choice of the analytical approach.
We cannot assume that all labeled fibers represent intrinsic axon terminals of V1 in 100% of the cases, inasmuch as there exists the possibility of labeling passing fibers. How-ever, in most cases reported in previous stud-ies using biocytin as neurotracer (7,21,25,26, 28,29) the degree of labeling of passing fibers was related to the amount of tracer delivered as well as to the extent of the tissue damage. Iontophoretic injections such as those used in the present study produce minimal damage and small injection sites (100-200 µm). How-ever, it is important to consider that Chevalier et al. (30) disagree with this argument and report passing fibers labeled after ionto-phoretic injections, thereby reopening the question.
Cell morphology and laminar distribution
The present paper described retrogradely
labeled cells with different morphological characteristics and laminar distribution. We found pyramids, star pyramids and stellate cells in layers II, IIIa (III), IIIb α (IIIb), IIIb ß (IVa) and IIIc (IVb). These results are simi-lar to those reported by Rockland and Lund (16) and Yoshioka et al. (8) who used HRP pressure or biocytin iontophoretic injections, respectively. However, one of the most intri-guing questions that remains open is the complete absence of labeling of dendritic ar-bors of non-pyramidal local neurons that nonetheless had their axon terminals labeled (type II axon terminals).
Using intracellular HRP injections Ander-son et al. (6) have found similar spine cells participating in intrinsic projections of V1 in
Macaca nemestrina. In agreement with
Rockland and Lund (16), we found a number of clusters of pyramidal and stellate cells in the supragranular layers of V1 of Cebus apella
that deserve further investigation from a func-tional point of view. Similar to the results of Blasdel et al. (31), these projections were asymmetrical in relation to the injection site, with strong labeling on one side as compared to the other. In cases of iontophoretic injec-tions located in layers II and III the infra-granular labeled cells were found in layer V, similar to the results reported by Livingstone and Hubel (14). These labeled cells also ap-pear in layer VI when the injection site in-cludes layer IV in addition to layers II and III. This result may possibly indicate interlami-nar axonal projections from neurons of layers II and III or, as suggested by others (4,8,32), selective uptake by damaged axons or den-drites of infragranular pyramidal cells pass-ing through the granular or supragranular lay-ers, in register with the injection site.
project intrinsically to V1 also project to V2 by means of collateral axonal branching, or that the fibers which are crossing V1 to reach their targets in V2 have been labeled as a consequence of damage. In the latter case the possibility of uptake of biocytin by passing fibers remains open. Against this possibility is the fact that similar patterns of labeling are obtained irrespective of the amount of tissue damaged (8,16,31, and the present results). The first hypothesis, i.e., the same cells pro-jecting both intrinsically and extrinsically, is supported by the results obtained after iso-lated injections into layers II and III or IVb (31) which show retrogradely labeled pyra-midal cells and axon terminals forming patches in layers II and III. In the case of layer IVb injections these authors found pyramids, spiny stellate cells and axon terminals in the same layer. These data reinforce the results of intracellular injections by Anderson et al. (6) that revealed pyramidal, star pyramidal and stellate cells projecting both intrinsically and extrinsically.
Axon terminals
The morphological details of the axon terminals of groups I and II in V1 of Cebus monkey are similar to those previously de-scribed by Martin and Whitteridge (33) for the striate cortex of the cat. These authors correlated these two axonal types with excita-tory and inhibiexcita-tory functions, respectively. In addition, the fact that we found a higher pro-portion of type I axons may reflect the propor-tion of excitatory neurons vs inhibitory ones described. The use of different metric fea-tures in the analysis of the same group may suggest the existence of subgroups, as pointed out by a qualitative analysis of group I. How-ever, we have not yet perfomed significant sampling analyses to support this hypothesis, which remains open for future investigation. Whether or not there are subgroups of axon terminals in group I, they tend to innervate a larger extent of cortical territory and to
dis-play fewer potential synaptic sites (bouton densities/mm) when compared to group II. This hypothetically lower synaptic density could be compensated for by the higher fre-quency of occurrence of terminals of group I than of group II. We propose that spine rons are related to group I and smooth neu-rons to group II (34,35). A comparison of the present results in terms of pattern of arboriza-tion, size and morphology of boutons for axon terminals of type II with those reported by Lund (36) and Lund and Yoshioka (37) per-mits us to correlate these terminals with smooth neurons of inhibitory local circuits. Despite the fact that there are insufficient data to exclude the participation of smooth cells in long distance horizontal connections (38), intracellular studies (39) imply the pres-ence of basket cells in intrinsic connections covering 1.0-1.5 mm of the cortex, and sug-gest that these cells show target specificity, making synaptic contacts with dendritic spines of pyramidal cells. Thus, by restricting themselves to smaller cortical territories they would increase their densities per cortical volume, thereby compensating for their nu-merical inferiority. The quantitative data of the present study seem to support this hypoth-esis.
Modular and laminar distribution of axon terminals
A preliminary question to be considered here is the difficulty in defining the limits of blobs (4,8,16,40). In order to reduce errors we have taken some precautions: 1) we used low power objectives to reconstruct the bor-ders of the blobs because they permit a better visualization of their limits. 2) For the recon-struction of the terminals we used a high power objective which rendered impossible simultaneous visualization of the blobs. 3) These reconstructions were recorded by us-ing the x, y and z coordinates fed automati-cally to a computer system, thus removing interference from the researcher. Taking all of this into consideration, it was possible to observe irregularities in the shape and spatial distribution of the blobs that contradict with homogeneous aspects described in the litera-ture (1,13,14). This variability agrees with the results reported by others (7,8,16,40). It is important to emphasize, however, that on some occasions it was very difficult to delin-eate the limits of the blobs and to distinguish them from the background.
A particular type of dense and very small blobs observed in the vicinity of blood
ves-References
1. McGuire BA, Gilbert CD, Rivlin PK & Wiesel TN (1991). Targets of horizontal connections in macaque primary visual
cortex. Journal of Comparative Neurology,
305: 370-392.
2. Lachica EA, Beck PD & Casagrande VA (1992). Parallel pathways in macaque monkey striate cortex: anatomically
de-fined columns in layer III. Proceedings of
the National Academy of Sciences, USA,
89: 3566-3570.
3. Yoshioka T, Blasdel GG, Levitt JB & Lund JS (1992). Patterns of lateral connections in macaque visual area V1 revealed by biocytin histochemistry and functional
im-aging. Society for Neuroscience
Ab-stracts, 18: 299.
4. Lachica EA, Beck PD & Casagrande VA (1993). Intrinsic connections of layer III of striate cortex in squirrel monkey and bush baby: correlations with patterns of
cyto-chrome oxidase. Journal of Comparative
Neurology, 329: 163-187.
5. Amir Y, Harel M & Malach R (1993). Corti-cal hierarchy reflected in the organization of intrinsic connections in macaque
mon-key visual cortex. Journal of Comparative
Neurology, 334: 19-46.
6. Anderson JC, Martin KA & Whitteridge D (1993). Form, function and intracortical projections of neurons in the striate
cor-tex of the monkey Macacus nemestrinus.
Cerebral Cortex, 3: 412-420.
7. Lund JS, Yoshioka T & Levitt JB (1993). Comparison of intrinsic connectivity in dif-ferent areas of macaque monkey cerebral
cortex. Cerebral Cortex, 3: 148-162.
8. Yoshioka T, Levitt JB & Lund JS (1994). Independence and merger of thalamocor-tical channels within macaque monkey primary visual cortex: anatomy of
inter-laminar projections. Visual Neuroscience,
11: 467-489.
9. Callaway EM & Wiser AK (1996). Contri-butions of individual layer 2-5 spiny neu-rons to local circuits in macaque primary
visual cortex. Visual Neuroscience, 13:
907-922.
10. Yoshioka T, Blasdel GG, Levitt JB & Lund JS (1996). Relation between patterns of intrinsic lateral connectivity, ocular domi-nance, and cytochrome oxidase-reactive regions in macaque monkey striate
cor-tex. Cerebral Cortex, 6: 297-310.
11. Lund JS, Yoshioka T & Levitt JB (1994). Substrates for interlaminar connections in area V1 of macaque monkey cerebral cor-tex. In: Peters A & Rockland KS (Editors),
Cerebral Cortex. Vol. 10. Plenum Press,
New York.
12. Casagrande VA & Kaas JH (1994). The afferent, intrinsic, and efferent connec-tions of primary visual cortex in primates.
In: Peters A & Rockland KS (Editors),
Ce-rebral Cortex. Vol. 10. Plenum Press, New
York.
13. Livingstone MS & Hubel DH (1984). Ana-tomy and physiology of a color system in
the primate visual cortex. Journal of
Neu-roscience, 4: 309-356.
14. Livingstone MS & Hubel DH (1984). Speci-ficity of intrinsic connections in primate
primary visual cortex. Journal of
Neurosci-ence, 4: 2830-2835.
15. Malach R (1991). Relationship of biocytin labeled neuronal processes to the cyto-chrome oxidase (CO) rich blobs in
mon-key striate cortex. Society for
Neurosci-ence Abstracts, 17: 117.
16. Rockland KS & Lund JS (1983). Intrinsic laminar lattice connections in primate
vi-sual cortex. Journal of Comparative
Neu-rology, 216: 303-318.
17. Amorim AKJ & Picanço-Diniz CW (1996). Morphometric analysis of intrinsic axon
terminals of Cebus monkey area 17.
Bra-zilian Journal of Medical and Biological
Research, 29: 1363-1368.
18. Picanço-Diniz CW, Silveira LCL, Yamada ES & Martin KAC (1992). Biocytin as a retrograde tracer in the mammalian visual
system. Brazilian Journal of Medical and
BiologicalResearch, 25: 57-62.
19. Wong-Riley MTT (1979). Changes in the visual system of monocularly sutured or enucleated cats demonstrable with
cyto-chrome oxidase histochemistry. Brain
Re-search, 171: 11-28.
20. Scherer-Singler U, Vincent SR, Kimura H & McGeer EG (1983). Demonstration of a unique population of neurons with
NADPH-diaphorase histochemistry.
Jour-nal of Neuroscience Methods, 9: 229-234.
21. Shu S, Ju G & Fan L (1988). The glucose oxidase-DAB-nickel method in peroxidase histochemistry of the nervous system.
Neuroscience Letters, 85: 169-171.
22. Hässler R (1967). Comparative Anatomy
of Central Visual Systems in Day- and
Night-Active Primates. Plenum Press,
New York.
23. Brodmann K (1909). Vergleichende
Lokalisationslehre der Grosshimrinde.
Barth, Leipzig.
24. Rosa MGP, Gattass R & Soares JGM (1991). A quantitative analysis of cyto-chrome oxidase-rich patches in the pri-mary visual cortex of Cebus monkeys: to-pographic distribution and effects of late
monocular enucleation. Experimental
Brain Research, 84: 195-209.
25. King MA, Louis PM, Hunter BE & Walker DW (1989). Biocytin: a versatile antero-grade neuroanatomical tract-tracing
alter-native. Brain Research, 497: 361-367.
26. Lachica EA, Mavity-Hudson JA & Casagrande VA (1991). Morphological de-tails of primate axons and dendrites re-vealed by extracellular injection of biocy-tin: an economic and reliable alternative
to PHA-L. Brain Research, 564: 1-11.
27. Kenan-Vaknin G, Katz H & Malach R (1992). Golgi-like staining of visual cortex cells obtained by extracellular biocytin
ap-plication in vitro. Brain Research, 571:
338-341.
28. McDonald AJ (1992). Neuroanatomical
la-beling with biocytin: a review.
Neurore-port, 3: 821-827.
29. Sorensen JC, Tonder N & Zimmer J (1993). Biocytin pellets: an alternative technique for massive anterograde
label-ing of neuronal pathways in vivo and in
vitro. Brain Research, 608: 338-344.
30. Chevalier G, Deniau JM & Menetrey A (1992). Evidence that biocytin is taken up
by axons. Neuroscience Letters, 140:
197-199.
31. Blasdel GG, Lund JS & Fitzpatrick D (1985). Intrinsic connections of macaque striate cortex: axonal projections of cells
outside lamina 4c. Journal of
Neurosci-ence, 5: 3350-3369.
32. Fitzpatrick D, Lund JS & Blasdel GG (1985). Intrinsic connections of macaque striate cortex: afferent and efferent
con-nections of lamina 4c. Journal of
Neuro-science, 5: 3329-3349.
33. Martin KAC & Whitteridge D (1984). Form, function and intracortical projections of spiny neurons in the striate visual cortex
of the cat. Journal of Physiology, 353:
463-504.
34. Beaulieu C, Kisvarday Z, Somogyi P, Cynader M & Cowey A (1992). Quantita-tive distribution of GABA-immunoposiQuantita-tive and -immunonegative neurons and syn-apses in the monkey striate cortex (area
17). Cerebral Cortex, 2: 295-309.
35. Fitzpatrick D, Lund JS, Schmechel DE & Towles AC (1987). Distribution of GABAergic neurons and axon terminals in
the macaque striate cortex. Journal of
ComparativeNeurology, 264: 73-91.
36. Lund JS (1987). Local circuit neurons of macaque monkey striate cortex: I.
Neu-rons of laminae 4c and 5a. Journal of
Com-parative Neurology, 257: 60-92.
37. Lund JS & Yoshioka T (1991). Local circuit neurons of macaque monkey striate cor-tex: III. Neurons of laminae 4b, 4a, 3b.
Journal of Comparative Neurology, 311:
234-258.
38. Lund JS (1988). Anatomical organization of macaque monkey striate visual cortex.
Annual Review of Neuroscience, 11:
253-288.
39. Douglas RJ & Martin KAC (1991).
Neocor-tex. Oxford University Press, New York.
40. Horton JC (1984). Cytochrome oxidase patches: a new cytoarchitectonic feature
of monkey visual cortex. Philosophical
Transactions of the Royal Society of
Lon-don, Series B, 304: 199-253.
41. Franca JG (1993). NADPH-diaforase no
córtex visual do macaco-de-cheiro (Saimiri
sciureus): Atividade histoquímica nas
áreas 17 e 18. Master’s thesis, Instituto de Biofísica Carlos Chagas Filho, Universi-dade Federal do Rio de Janeiro, Rio de Janeiro.
42. Lachica EA & Casagrande VA (1993). The morphology of collicular and retinal axons ending on small relay (w-like) cells of the
primate lateral geniculate nucleus. Visual
Neuroscience, 10: 403-418.
43. Leventhal AG, Thompson KG, Liu D, Zhou Y & Ault ST (1995). Concomitant sensitiv-ity to orientation, direction, and color of cells in layers 2, 3, and 4 of monkey
stri-ate cortex. Journal of Neuroscience, 15:
1808-1818.
44. Hübener M & Bolz J (1992). Relationships between dendritic morphology and cyto-chrome oxidase compartments in
mon-key striate cortex. Journal of Comparative
Neurology, 324: 67-80.
45. Malach R (1992). Dendritic sampling across processing streams in monkey
stri-ate cortex. Journal of Comparative
Neu-rology, 315: 303-312.
46. Malach R, Amir Y, Harel M & Grinvald A (1993). Relationship between intrinsic connections and functional architecture
revealed by optical imaging and in vivo
targeted biocytin injections in primate
stri-ate cortex. Proceedings of the National
Academy of Sciences, USA, 90:
10469-10473.
47. Malach R (1994). Cortical columns as de-vices for maximizing neuronal diversity.