Socio-economic studies with social
accounting and socio-demographic
Matrices. An (attempted) application to
Mozambique.
Susana Santos
ISEG (School of Economics and Management) of the Technical
University of Lisbon, UECE (Research Unit on Complexity and
Economics) , DE (Department of Economics)
5. July 2013
Online at
http://mpra.ub.uni-muenchen.de/47999/
An (attempted) application to Mozambique
.Susana Santos1
ISEG (School of Economics and Management) of the Technical University of Lisbon
UECE (Research Unit on Complexity and Economics) and DE (Department of Economics).
Abstract
In looking for empirical evidence about the activity of countries, a proposal is made for studying (measuring and modelling) the activity of countries through the use of Social Accounting Matrices (SAMs) and Socio-Demographic Matrices (SDMs).
SAMs and SDMs are presented as tools that have specific features for conducting studies in several different areas, as well as for supporting policy decision processes.
Based on methodological principles that are derived mainly from the works of Richard Stone, emphasis is placed on the desirability of working in a matrix format, which includes not only people (SDM), but also, at the same time, activities, products, factors of production and institutions (SAM). This is considered to be a way of capturing the relevant network of linkages and the corresponding multiplier effects for the subsequent modelling of the activity of the countries studied.
A method will be proposed for the construction of these matrices. In the case of the SAMs, it is proposed that their design and construction should adopt, at least as their starting point, the latest version of the System of National Accounts (2008 SNA) and the corresponding results of its adoption/adaptation by different countries.
The exposition of this proposal is accompanied by an example applied to Mozambique, as well as by some considerations about the quality, suitability and completeness of the data used in the
construction of SAMs and SDMs.
Key words: Social Accounting Matrix; National Accounts, Socio-Demographic Matrices
JEL classification: C82;E16;E61; J11.
(July 2013)
Notes:
- The author gratefully acknowledges the financial support provided by FCT (Fundação para a Ciência e a Tecnologia)
Portugal for the research and writing of this article, which forms part of the Strategic Project for 2011-13 (PEst-OE/EGE/UI0436/2011).
- This paper was presented to the 5th European Conference on African Studies, held in Lisbon – Portugal on 27-29/6/
2013.
- Part of the description of the SAM-based approach adopted in this paper is also to be found in another article by the same author, which is published in the International Journal of Humanities and Social Science, Vol. 3 No. 10 [Special Issue – May 2013].
CONTENTS
1. Introduction ... 1
2. Looking for empirical evidence about the activity of countries ... 2
3. Approaches based on Social Accounting Matrices (SAMs) and Socio-Demographic Matrices (SDMs) ... 3
4. Constructing SAMs from the SNA. Application to Mozambique. ... 6
4.1.The SAM’s basic structure ... 7
4.2.Disaggregations and extensions ... 12
4.3.Aggregates, indicators and balancing items ... 19
5. Constructing SDMs. Application to Mozambique. ... 22
6. Example of socio-economic studies that can be addressed using SAMs and SDMs. The informal aspects of the activity of countries ... 27
7. Summary and Concluding remarks ... 29
References ... 32
Appendix A. Sources used in the construction of the numerical version of the SDMs for Mozambique in 2007 ... 35
- 1 -
1. Introduction
The Social Accounting Matrix (SAM) and the Socio-Demographic Matrix (SDM) are tools that have specific features intended for studying the activity of countries. Both matrices cover movements in time and space, which are expressed by the former matrix in units of currency and by the latter matrix in terms of human beings.
Such features allow for the reading and interpretation of the reality under study, leading to the production of an empirical work that is not only capable of highlighting specific aspects of that activity, but also offer the chance to experiment with different interventions in regard to its functioning.
A proposal will be made for the development both of a basic SAM and of a standard SDM. Together with an explanation of possible alternative taxonomies, this presentation will show how those matrices can be used as an alternative support for studies being undertaken in several areas, as well as for the work of those taking part in the policy decision process. Underlying the application that will be made in order to illustrate this presentation is a reality whose interpretation will not extend beyond a number of examples explaining how those matrices can be used in those cases.
By stating that our knowledge of the activity of countries involves the use of national and demographic accounts, Section 2 justifies the decision to use the national and the demographic accounts, as well as the matrix form for studying the empirical evidence of that same activity.
Section 3 adopts a methodological framework that is based on Richard Stone’s works outlining the main features of the SAM and SDM-based approaches. According to this methodological framework, SAMs and SDMs can describe the activity of countries either empirically or theoretically, depending on whether they are presented in a numerical or an algebraic version, respectively.
Adopting the above-mentioned methodological framework, and based on the latest version of the System of National Accounts (2008 SNA), Section 4 presents a proposal for a SAM structure, beginning with a basic structure and then showing its potentialities for further development. Firstly, Section 4.1 presents a basic structure and emphasises the need to ensure its consistency with the whole system. Such emphasis is then reinforced through the analysis of possible disaggregations and extensions to that basic structure (Section 4.2). Section 4.3 discusses the different forms of analysis made possible by the use of aggregates, indicators and balancing items that can be calculated from
- 2 -
In turn, following the methodological framework introduced by Section 3, Section 5 presents a SDM structure, beginning with a standard structure (as proposed by Richard Stone), and then showing possibilities for further developments. In keeping with what was done in Section 4, an attempt is made to construct a numerical SDM for Mozambique. Due to the unavailability and/or inaccessibility of data, too many assumptions and estimates are needed, so that this application should only be considered as a simulation, designed merely to illustrate the main features of the tool and the types of readings that can be made of the reality under study.
When addressing the informal aspects of the economic activity of countries, Section 6 can be understood as an example of socio-economic studies that can be undertaken using both SAMs and
SDMs.
Although both the SAM-based and SDM-based approaches make it possible to work with numerical versions and algebraic versions (models), greater attention will be paid to the construction of the numerical versions of both matrices – with the inclusion of more details and applications. Nonetheless, some works devoted to the modelling of those matrices will also be referred to. On the other hand, because the SDM is a very recent field of research for the author of this article, this matrix is not developed in so much detail as the SAM, despite the many common aspects that are shared between them both.
Section 7 systematises the main ideas of the other sections and makes some concluding remarks in an attempt to illustrate to what extent countries can use SAMs and SDMs to study (socio-) economic systems and support their policy decision processes.
2. Looking for empirical evidence about the activity of countries
- 3 -
plausible statistical base source of information for studying the part of the activity of a country that can be expressed in currency units ought to be its national accounts. But such activity also depends greatly on the population of that country, whose movements are expressed in terms of human beings. The base source for this latter information will therefore be the demographic accounts, more commonly known as demographic statistics. This methodology can also be applied to countries that are not normally considered to be developed, but which nonetheless seek to produce national accounts. However, although this is not so evident with the demographic accounts, we should bear in mind that underlying the national accounts is a system that defines which facts should be observed and how these same facts should be recorded. The existence of such a system will certainly influence
the challenge outlined above. Even so, we will adopt the national accounts as our starting point. On the other hand, working with the (national and demographic) accounts in a matrix format can be seen as a convenient way of considering the above-mentioned network of linkages existing between facts about the activity of countries, which will thus help us to achieve greater analytical content. The matrix format will also allow for the use of matrix algebra in possible mathematical treatments associated with the above-mentioned empirical work, enabling us to experiment with different interventions in regard to the functioning of reality. Some other advantages to be gained from the use of the matrix format will be identified below.
In looking for empirical evidence about the activity of countries, our proposal for a SAM will therefore make use of the specific hierarchy of the facts that are supposedly observed through the system of national accounts. In order to better achieve the same purpose, a SDM that makes use of the hierarchy of the facts observed through the demographic accounts will also be proposed. This will make it possible to identify networks of linkages that can be worked upon with different purposes in mind, always operating within a macro framework. Based upon that work, which exhaustively explores the features of the national accounts and their underlying system, as well as those of the demographic accounts, further work can be carried out, discovering alternative hierarchies of facts, identifying the existence and importance of the non-observed facts, and criticising the way in which the observed facts are recorded, etc.
As the behaviour of facts is explained by theories, our empirical work will also allow us to either test or better define these theories.
3. Approaches based on Social Accounting Matrices (SAMs) and Socio-Demographic Matrices (SDMs)
- 4 -
with that work, and due to their similarities, we will call the approach based on SAMs the SAM-based approach – the term that is normally adopted – and the approach based on SDMs the SDM-based approach – a term that is not normally adopted, but which will be used here.
Following the work of Richard Stone, Graham Pyatt and Jeffery Round in particular played a key role in the study and dissemination of the SAM-based approach.
In the foreword to the book that can now be regarded as a pioneering work in terms of the SAM-based approach, “Social Accounting for Development Planning with special reference to Sri Lanka”, Stone stated that the framework of the system of national accounts can be rearranged and “the entries in a set of accounts can be presented in a matrix in which, by convention (…), incomings are shown
in the rows and outgoings are shown in the columns; and in which, reflecting the fact that accounts balance, each row sum is equal to the corresponding column sum”. That matrix, with an equal number of rows and columns, is the SAM, in the construction of which “it may be possible to adopt a hierarchical approach, first adjusting the entries in a summary set of national accounts and then adjusting subsets of estimates to these controlling totals”. (Pyatt and Roe, 1977: xix, xxiii).
In turn, in the abstract to his article “A SAM approach to modeling”, Pyatt says: “Given that there is an accounting system corresponding to every economic model, it is useful to make the accounts explicit in the form of a SAM. Such a matrix can be used as the framework for a consistent dataset and for the representation of theory in what is called its transaction form”. In that transaction form (or TV (transaction value) form), the SAM can be seen “(…) as a framework for theory” and its cells “(…) can be filled instead with algebraic expressions, which describe in conceptual terms how the corresponding transaction values might be determined”. Thus, the SAM is used as “the basic framework for model presentation”. (Pyatt, 1988: 327; 337).
Looking at the question from the perspectives outlined above, it can be said that a SAM can have two versions: a numerical version, which describes the activity of a country empirically; and an algebraic version, which describes that same activity theoretically. In the former version, each cell has a specific numerical value, with the sums of the rows being equal to the sums of the columns. In the latter version, each cell is filled with algebraic expressions that, together with those of all the other cells, form a SAM-based model, the calibration of which involves a replication of the numerical version. In the words of Pyatt, “the essence of (...) the SAM approach to modelling is to use the same SAM
- 5 -
the Organisation for Economic Cooperation and Development and the Statistical Office of the European Communities (Eurostat). Together, they formed the Inter-Secretariat Working Group on National Accounts (ISWGA).
This system establishes the rules for measuring the activity of countries or groups of countries, which, in turn, have been adopted and adapted to specific realities by the corresponding statistical offices. The construction of algebraic versions (or SAM-based models) can be seen, among others, in Pyatt (2001; 1988), Pyatt and Roe (1977), Pyatt and Round (1985; 2012) and Santos (2010; 2009).
In their latest article, Pyatt and Round (2012) explore and derive conditions for a phenomenon that they identify as distributional invariance within a SAM-based model. That phenomenon, which they
also call “the Stone phenomenon”, is associated with the study of a component of the multiplier effects identified during research into the interrelationship between the structure of production and the distribution of income in the context of economic development. The implications of those conditions were identified by the authors in the design of SAMs and in the consequent quality of results generated via subsequent modelling. Consequently, they conclude by appealing for renewed efforts to be made in the design and construction of SAMs with a view to obtaining a more realistic starting point for subsequent modelling.
The SAMs used in the works of reference written about the SAM-based approach were constructed to deal with specific realities. They were created by teams with access to primary sources of information, and were designed according to each specific case. However, there are many cases in which the SAM-based approach is adequate for proceeding with certain studies, even when access to primary sources of information is not feasible and teams are not available. In view of these circumstances, special attention has been paid by the author to the construction of numerical versions of SAMs from the SNA, a subject which will be examined in Section 4.
Despite the potentialities of Stone’s work on SDMs, the SDM-based approach has not been followed by other authors as much as the SAM-based approach. Thus, the study of the SDM-based approach (which will be introduced by the author for the first time in this paper) will be based only on Stone’s works.
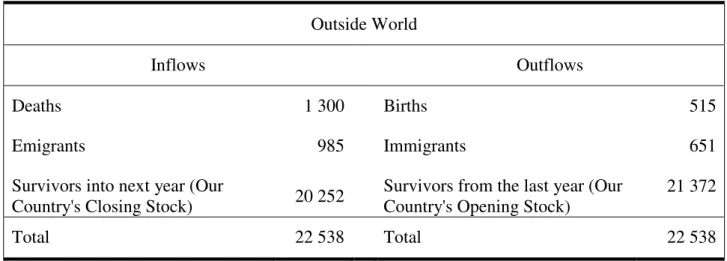
The population of a specific country in a specific year “flows in partly along time from last year, through survival, and partly along space from the outside world, through birth and immigration; and
- 6 -
By connecting “the opening and closing stocks of year with flows during year ” (Stone, 1982: 292), two types of versions will be identified for the SDM: numerical versions, in which each cell has a specific numerical value; and algebraic versions, in which each cell is filled with algebraic expressions that, together with those of all the other cells, form a SDM-based model, the calibration of which involves a replication of the numerical version.
Numerical versions of SDMs can thus be constructed from demographic statistics or they can be replicated by the running of SDM-based models. The former versions measure the reality under study and will be examined in Section 5. The latter versions measure scenarios resulting from experiments performed with those models, and can be seen in: Stone, 1966, 1971, 1973, 1975, 1981, 1982, 1985,
1986a.
SDM-based models and the combination of SAM and SDM-based approaches will be part of this author’s future research work.
4. Constructing SAMs from the SNA. Application to Mozambique.
The latest versions of the SNA have devoted a number of paragraphs to discussing the question of SAMs. The 2008 version mentions SAMs in Section D of its Chapter 28, entitled “Input-output and
other matrix-based analysis” (ISWGA, 2008: 519-522), in which a matrix representation is presented of the accounts identified and described in the whole SNA. This representation is not, however, to be identified with the SAM presented in this paper, although they both cover practically all the flows recorded by those accounts.
The SAM that will be presented below results from the work that the author has undertaken within the methodological framework presented in Section 3, based especially on the works of Graham Pyatt and his associates (Pyatt, 1988 and 1991; Pyatt and Roe, 1977; Pyatt and Round, 1985 and 2012), as well as from the efforts made to reconcile that framework with what has been defined by (the successive versions of) the SNA (Pyatt, 1985 and 1991a; Round, 2003; Santos, 2009). Thus, the author will propose a version of the SAM that seeks to be as exhaustive as possible regarding the flows observed by the SNA. Pyatt (1999) and Round (2003) also approach this same issue with the use of their own versions.
- 7 -
differences between the accounts identified in those applications and described in the 1993 and 2008 versions of the SNA are not significant, they will be used to illustrate the following exposition. Thus, returning to the description provided in Section 3, a square matrix will be worked upon, in which the sum of the rows is equal to the corresponding sum of the columns. In keeping with what is conventionally accepted, and after some adjustments have been made to adapt this to the SNA, resources, incomes, receipts or changes in liabilities and net worth will be represented in the entries made in the rows, while uses, outlays, expenditures or changes in assets will be represented in the entries made in the columns. Each flow will therefore be recorded only once, in a cell of its own. The following description will be made in accordance with the 2008 SNA.
The starting point for the construction of a numerical SAM should be its design, i.e. the classification or taxonomy of its accounts. That taxonomy and the levels of disaggregation adopted will depend on the purposes for which the SAM is to be used, as well as on the way that the available information is organised. Adopting the national accounts as the base source of information, a basic structure is proposed below, which takes into account the underlying SNA and highlights the consistency of the whole system. The flexibility of that basic structure will be shown, together with the possibilities that it presents for characterising problems and for achieving specific purposes. These will also be seen as possibilities for going beyond the SNA, which is considered as a starting point, as mentioned in Section 2.
In this respect, we are aware of the dangers associated with the adoption of international standards and systems of classification and their failure to recognise important issues and realities. This problem is also mentioned by Pyatt and Round when they consider the choice of taxonomies within a SAM framework and the strategic influence that these can have on the potential usefulness of subsequent applications. According to those authors: “the taxonomies that are embedded within [the SAM framework] predetermine what any subsequent modelling exercise might have to say in response to specific distributional questions” (Pyatt and Round, 2012: 270). Furthermore, the author would also like to stress the need for certain types of manuals to be made available about sources and methodologies, describing the methods that were used and explaining how and where the data were collected. On the one hand, this would allow users to judge the quality and the exact scope of the data they are working with, and thus decide whether or not to use other sources of information. On the
other hand, this could also be a way of ensuring that the compilers of the accounts are committed to the work that they do and the results that they produce.
4.1.The SAM’s basic structure
- 8 -
and the controlling totals for the other levels of disaggregation, which will later be analysed in Section 4.2. Thus, in keeping with the conventions and nomenclatures defined by the SNA, besides a rest of the world account, the proposed SAM will also include both production and institutional accounts.
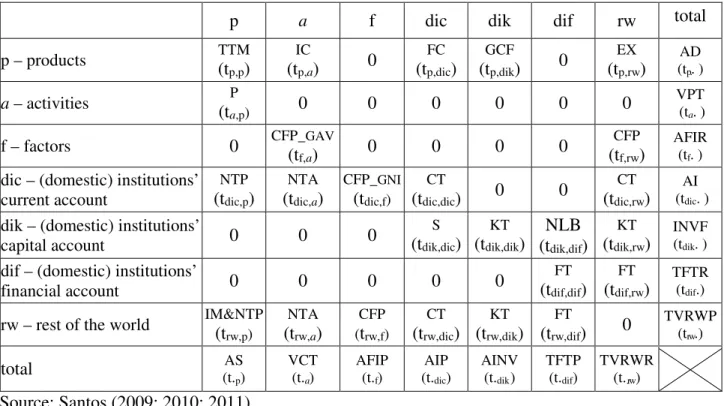
Table 1 shows the above-mentioned basic structure, representing the nominal transactions (“t”) with which two indexes are associated. The location of these transactions within the matrix framework is described by those indexes, the first of which represents the row account while the second represents the column account. Each cell of this matrix will be converted into a submatrix, with the number of rows and columns corresponding to the level of disaggregation of the row and column accounts. This same table also identifies blocks, which are submatrices or sets of submatrices with common
characteristics. The specification of these blocks will be made below and involves an identification of the flows of the National Accounts, which will continue to be the same even if some disaggregation is performed – thereby preserving the consistency of the whole system.
Table 1. The Basic SAM by blocks
p a f dic dik dif rw total
p – products TTM (t
p,p)
IC
(tp,a) 0
FC (tp,dic)
GCF
(tp,dik) 0
EX (tp,rw)
AD (tp.. )
a – activities (tP
a,p) 0 0 0 0 0 0
VPT (ta . )
f – factors 0 CFP_(t GAV
f,a) 0 0 0 0
CFP (tf,rw)
AFIR (tf . )
dic – (domestic) institutions’ current account
NTP (tdic,p)
NTA (tdic,a)
CFP_GNI
(tdic,f)
CT
(tdic,dic) 0 0
CT (tdic,rw)
AI (tdic. )
dik – (domestic) institutions’
capital account 0 0 0
S (tdik,dic)
KT (tdik,dik)
NLB (tdik,dif)
KT (tdik,rw)
INVF (tdik. )
dif – (domestic) institutions’
financial account 0 0 0 0 0
FT (tdif,dif)
FT (tdif,rw)
TFTR (tdif.)
rw – rest of the world IM&NTP (t
rw,p)
NTA (trw,a)
CFP (trw,f)
CT (trw,dic)
KT (trw,dik)
FT
(trw,dif) 0
TVRWP (trw.)
total (t.AS
p)
VCT (t.a )
AFIP (t.f )
AIP (t.dic)
AINV (t.dik )
TFTP (t.dif)
TVRWR (t..rw )
Source: Santos (2009; 2010; 2011)
Note: The first three accounts (p = products (or goods and services), a = activities (or industries) and f = factors (of production)) are the production accounts of the economy and the next three accounts (dic = current; dik = capital; dif = financial) are the accounts of the (domestic) institutions. The last account (rw = rest of the world) represents the “outside” part of the (domestic) economy.
- 9 -
a) Production – P (cell: ta,p; basic prices) – represents the output of goods and services (P1).
b) Domestic Trade is represented by the value of domestically transacted products, which can be either domestically produced or imported.
b.1)Intermediate Consumption – IC (cell: tp,a; purchasers’ prices) – consists of the value of the
goods and services consumed as inputs by a process of production, excluding those fixed assets whose consumption is recorded as consumption of fixed capital (P2).
b.2)Final Consumption – FC (cell: tp,dic; purchasers’ prices) – consists of the expenditure incurred
by resident institutional units on goods or services that are used for the direct satisfaction of individual needs or wants, or the collective needs of members of the community (P3).
b.3)Gross Capital Formation – GCF (cell: tp,dik; purchasers’ prices) – includes gross fixed capital
formation, changes in inventories, and acquisitions less disposals of valuables (P5).
c) External Trade includes the transactions in goods and services from non-residents to residents, also known as imports (P7), or IM (cell: trw,p; purchasers’ prices), and the transactions in goods
and services from residents to non-residents, also known as exports (P6), or EX (cell: tp,rw;
purchasers’ prices).
d) Trade and Transport Margins – TTM (cell: tp,p) – amounts to zero and, when it is disaggregated
and takes the form of a submatrix, it allocates the output of the trade and transport services used in the domestic trade to the supplied products.
e) Net taxes on production and imports
e.1)Net Taxes on Production – NTA (cells: tdic,a; trw,a) – represents the (other) taxes on production
(D29) minus the (other) subsidies to production (D39).
e.2)Net Taxes on Products – NTP (cells: tdic,p; trw,p) – represents the taxes on products (D21)
minus the subsidies on products (D31).
f) Compensation of Factors of Production – CFP(cells: tf,a; tdic,f; tf,rw; trw,f) – consists of the income
of the institutional sectors originating from the compensation of employees (D1) and the compensation of employers and own-account (or self-employed) workers, and the compensation of capital, including property income (D4; B2g-B3g). The functional distribution is represented by the Gross Added Value – GAV (cell: tf,a), whereas the institutional distribution is represented
by the Gross National Income – GNI (cell: tdic,f).
g) Current Transactions – CT (cells: tdic,dic; tdic,rw; trw,dic) – includes: current taxes on income, wealth,
- 10 -
h) Capital Transactions – KT (cells: tdik,dik; tdik,rw; trw,dik) – includes: capital taxes (D91); investment
grants (D92); other capital transfers (D99); and acquisitions less disposals of financial non-produced assets (NP1-3).
i) Financial Transactions – FT (cells: tdif,dif; tdif,rw; trw,dif) – includes: monetary gold and special
drawing rights (F1); currency and deposits (F2); debt securities (F3); loans (F4); equity and investment fund shares (F5); insurance, pension and standardised guarantee schemes (F6); financial derivatives and employee stock options (F7); and other accounts receivable/payable (F8).
j) Gross Saving – S (cell: tdik,dic) – measures the portion of aggregate income that is not used for
final consumption expenditure and current transfers to domestic institutions or to the rest of the world (B9g).
k) Net Borrowing/Lending – NLB (cell: tdik,dif)
The net lending or borrowing of the total economy is the sum of the net lending or borrowing of the institutional sectors. It represents, respectively, the net resources that the total economy makes available to the rest of the world or the net resources that it receives from the rest of the world to finance the corresponding needs of investment funds (B9).
Here, those amounts are recorded in the row(s) of the capital account, i.e. as changes in liabilities and net worth, and in the column(s) of the financial account, i.e. as changes in assets. This is why the mathematical signs of this item have been changed in relation to the SNA.
The construction of a SAM is easier when it is performed by blocks.
The totals of each account represent the corresponding sums of the cells in rows and in columns, with the following description:
I. Products account (p): Aggregate Demand – AD, the row sum (cell: tp.); Aggregate Supply – AS,
the column sum (cell: t.p).
II. Activities account (a): Production Value – VPT, the row sum (cell: ta.); Total Costs – VCT, the
column sum (cell: t.a).
III. Factors of Production (f): Aggregate Factors Income (Received) – AFIR, the row sum (cell: tf.);
Aggregate Factors Income (Paid) – AFIP, the column sum (cell: t.f).
IV. Current account of (domestic) institutions (dic): Aggregate Income (received) – AI, the row sum (cell: tdic.); Aggregate Income (Paid) – AIP, the column sum (cell: t.dic).
- 11 -
VI. Financial account of (domestic) institutions (dif): Total Financial Transactions (Received) – TFTR, the row sum (cell: tdif.); Total Financial Transactions (Paid) – TFTP, the column sum (cell:
t.dif).
VII. Rest of the world account (rw): Value of Transactions to the Rest of the World (Paid) – TVRWP, the row sum (cell: trw.); Value of Transactions from the Rest of the World (Received) – TVRWR,
the column sum (cell: t.rw).
From the above description, two further advantages of the matrix presentation of the national accounts can be highlighted: each transaction represents a single entry and can be characterised by its position; each account is represented by a row and a column, whose balance is ensured by the equality of their sums.
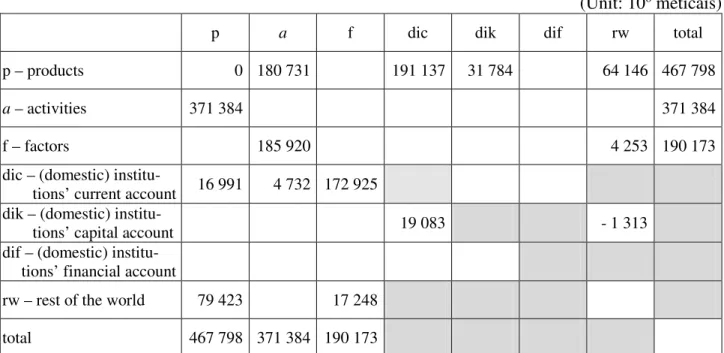
The Integrated Economic Accounts Table is equivalent to a summary of what is observed by the SNA. According to the 2008 SNA: “The integrated economic accounts use (…) three of the conceptual elements of the SNA (...) [institutional units and sectors, transactions, and assets and liabilities] together with the concept of the rest of the world to form a wide range of accounts. These include the full sequence of accounts for institutional sectors, separately or collectively, the rest of the world and the total economy…. This table shows, simultaneously, the general accounting structure of the SNA and presents a set of data for the institutional sectors, the economy as a whole and the rest of the world” (ISWGNA, 2009: 23; 29). No integrated economic accounts table was found for Mozambique in 2007 and, with the information that was accessed, it was only possible to fill in the non- shaded
cells of the basic SAM, as shown in Table 2.
Table 2. Basic SAM of Mozambique in 2007
(Unit: 106 meticais)
p a f dic dik dif rw total
p – products 0 180 731 191 137 31 784 64 146 467 798
a – activities 371 384 371 384
f – factors 185 920 4 253 190 173
dic – (domestic)
institu-tions’ current account 16 991 4 732 172 925 dik – (domestic)
institu-tions’ capital account 19 083 - 1 313
dif – (domestic) institu-tions’ financial account
rw – rest of the world 79 423 17 248 total 467 798 371 384 190 173
- 12 -
Considering the description given about Table 1, and based on the reading of the products account in Mozambique in 2007, represented in Table 2 – row and column p, the main components of the aggregate demand and supply of the goods and services transacted in the market and captured by the Mozambican National Accounts, can be identified in millions of meticais. Thus, reading in rows, the total aggregate demand of 467,798 million meticais was composed of 180,731 million meticais of intermediate consumption, 191,137 million meticais of final consumption, 31,784 million meticais of gross capital formation and 64,146 million meticais of exports. Reading in columns, the total aggregate supply of 467,798 million meticais (equal to the total aggregate demand) was composed of 371,384 million meticais from the output of goods and services, 16,991 million meticais of net taxes
on products and 79,423 million meticais of imports. A similar reading can be made for each of the other columns and rows of Table 2 for Mozambique. In the case of aggregate income, aggregate investment, investment funds, financial transactions and transactions with the rest of the world, however, no composition can be identified because the corresponding rows and columns are incomplete.
Therefore, as mentioned above, and again using the words of Stone, the basic SAM that has just been described can be considered as the most aggregate “summary set of national accounts”, representing a first level of the intended hierarchical method, with all the controlling totals for the next level of that hierarchy. From here the consistency of the whole (supposedly) observed system can be ensured. However, it should be noted that, this is not true for Mozambique, whose national accounts adoption/adaptation to the SNA is not complete, providing few possibilities for work, particularly in the case of institutional sectors. This means that at least some of us are still faced with the problem already identified by Lury in 1964, in his article “National Accounts in Africa”2, when he emphasised
the usefulness of having, in addition to the estimation of “the value of the stream of goods and services available to the community…”, “.. extra tables of government revenue and expenditure, and details of sources of savings from which investment is financed” (Lury, 1964: 99-100). Although some of that information is in fact produced nowadays (at least for Mozambique), it tends to be dispersed in nature and is either difficult or impossible to access.
4.2.Disaggregations and extensions
Since the national accounts cover all the details covered by the basic structure presented above, some
other levels of the above mentioned-hierarchical method can be identified within the national accounts, providing other controlling totals for greater levels of disaggregation. As will be seen
2 Following on from a Conference held in January 1961, organised by the United Nations Economic Commission for
- 13 -
below, this disaggregation can be made at the levels of the production, institutional and rest of the world accounts, either within the scope of the SNA conventions or not. Reverse reasoning can be applied to the case of aggregation. Therefore, in addition to the already-mentioned advantages of presenting the national accounts in the form of a matrix, it is also possible to make an easier aggregation and disaggregation of the accounts, in accordance with the specific requirements of the exercise and the available information, without losing the consistency of the system.
In the words of Round, in his Foreword to Santos (2009): “The key to constructing a useful SAM and developing an effective SAM-based model is the SAM design. A SAM need not be dimensionally large as long as it represents the most significant features of economy-wide interdependence. More
precisely, this means designing the SAM so that the key sectors, markets and institutions are as fully represented as is practicable. Estimation of the transactions between accounts is obviously also important but this needs to go in tandem with the SAM design” (Santos, 2009: xiv).
It is also worth mentioning that, although the quarterly national accounts are not as complete as the annual ones, it will nonetheless be possible to make some further disaggregations from these accounts in terms of time.
Furthermore, disaggregations can be made in terms of space, since regional accounts are also considered. In that case, it is possible to work with regions and countries, either individually or as a group. Round (1994; 1991), for example, experimented with the case of Europe. It would even be possible to think in world terms, if the SNA could be adopted worldwide.
Extensions are also possible, either from the national accounts or from other sources of information, with the convenient adjustment to, or connection with, the whole system in order to maintain its consistency.
The 2008 SNA dedicates its Chapter 29 to “Satellite accounts and other extensions” (ISWGNA, 2009: 523-544), where the main idea is to serve specific analytical purposes, in a way that is consistent with the central framework, although not fully integrated into it (ISWGNA, 2009: 37-38). In this respect, the author would like to support Steven Keuning and Willem Ruijter’s idea of a “complete data set” which “could be tentatively labelled: a System of Socio-economic Accounts” (Keuning and Ruijter, 1988: 73).
4.2.1. Production accounts
- 14 -
the incomes resulting from that process and the ownership of assets are distributed among institutions and activities.
The SNA uses the Central Product Classification (CPC) Version 2 (completed in December 2008) to classify products (ISWGNA, 2009: 19), which are organised into 10 sections, with it being possible to go as far as the fifth level of disaggregation within each of these.
In turn, the International Standard Industrial Classification of All Economic Activities (ISIC) Revision 4 (officially released in August 2008) is used to classify activities (ISWGNA, 2009: 20), organised into 23 sections, the disaggregation of which is perfectly consonant with that of the product classification. The Supply and Use Table provides this information, usually at an intermediate level
of disaggregation.
As described above, in the characterisation of the block representing the compensation of the factors of production, the disaggregation that can be made from the already mentioned tables of the national accounts is between labour (or the compensation of employees) and what has been referred to as the compensation of other factors, which includes the compensation of employers and own-account (or self-employed) workers, and the compensation of capital, namely property income. Such information can only be derived from the Integrated Economic Accounts Table if the products and activities accounts are not disaggregated, or from the Supply and Use Table if those same accounts are disaggregated. Table 3 shows everything that could be done in the above-mentioned application to Mozambique, where Integrated Economic Accounts are not available.
Regarding the design of SAMs and in order to establish a connection between the taxonomies dealt with in this section and in the next, it should be mentioned that in their latest work, besides a rest of the world account, Pyatt and Round identify accounts for goods and non-factor services and factor services, as well as, accounts for institutions. In the latter, they identify private and public sector current accounts and combined capital accounts. About this classification, they say the following: “taxonomies for goods and services serve to distinguish different markets and should therefore be constructed in ways that recognise significant market failures and segmentation. In contrast, the institutions within the private sector are differentiated by the assets they own (or do not own…) and the productive activities they are responsible for…. Factors of production and the assets that provide them are therefore the defining feature of institutions.” (Pyatt and Round, 2012: 268).
4.2.2. Institutions and Rest of the World accounts
- 15 -
available, the current accounts show how the national income is transformed into disposable income through the receipt and payment of current transfers, and how the latter is distributed between final consumption and saving. In turn, the capital account records the transactions linked to acquisitions of non-financial assets and capital transfers involving the redistribution of wealth, whereas the financial account records the transactions in financial assets and liabilities between institutional units, and between these and the rest of the world.
All the linkages between the domestic economy and the rest of the world, i.e. all the transactions between resident and non-resident units, are recorded both in the SAM and in the SNA through the rest of the world account.
Chapter 4 of the 2008 SNA specifies the institutional sectors, including the rest of the world, and their possible disaggregation, which in some cases can be taken as far as the third level (ISWGNA, 2009: 61-85), although normally it cannot be taken beyond the first level. In the case of the rest of the world, such disaggregation will certainly depend on the country, or group of countries, that adopt and adapt this system.
At the first level of disaggregation, the accounts of the institutions, as well as the rest of the world account, are part of the Integrated Economic Accounts Table. Higher levels of disaggregation, whenever these are possible, are usually published in the separate accounts of institutions. Even at the first level of disaggregation, any work conducted with the institutional sectors when there are transactions involving more than one row or column of the SAM also requires the so-called “from whom to whom matrices”. These matrices make it possible to fill in the cells of the submatrices of transactions taking place within domestic institutions and between institutions and the rest of the world, recorded in the above-described blocks of current, capital, and financial transactions (Section 4.1 g-i).
The disaggregation of specific institutional sectors makes it possible to analyse the most diverse aspects of the corresponding roles in the activity of countries (Santos (2004) and (2007) are examples of studies on the role of the general government and its subsectors – central government, local government and social security funds). Section 6 outlines an exercise that it was possible to carry out with households in order to identify the informal aspects of the economic activity of countries. The detailed study of the specific accounts of domestic institutions and their corresponding
- 16 -
In turn, the rest of the world account can provide many possibilities for studying the international economic relations of the domestic economy.
As can be seen in Table 3, it was almost completely impossible to make the application of this part to Mozambique, due to the already mentioned unavailability of integrated economic accounts tables, as well as the absence of “from whom to whom matrices” (the cells shaded in grey could not be filled in due to a lack of information).
This means that, from Table 3, we can discover only a little more about the reality under study –
Mozambique in 2007. This is the case with the aggregate factors income – the so-called primary
distribution of income, to the amount of 190,173 million meticais, in which it can now be seen that 51,325
million meticais account for the compensation of employees – row and column 3, and 138,849 million meticais account for the compensation of other factors of production, such as employers and own-account
(or self-employed) workers, land and capital (including property income) – row and column 4.
Through row 3 we can see that 49,820 million meticais represent the part of the gross added value,
generated in the domestic economy by residents and non-residents, which is attributed to the compensation of employees, to which are added 1,505 million meticais generated abroad by residents. In
turn, row 4 shows that 136,101 million meticais represent the part of the gross added value, generated in
the domestic economy by residents and non-residents, that is attributed to the above-mentioned other
factors of production, to which are added 2,748 million meticais generated abroad by residents. Rows 3 and 4 allow for the study of aspects related with the functional distribution of income.
Through column 3, we can see that 50,331 million meticais represent the part of the gross national income, generated in the domestic economy and abroad by residents, that is attributed to the compensation of employees, to which are added 994 million meticais generated in the domestic economy by non-residents and sent abroad. In column 4, which is not completely filled in, we can see that 122,595 million meticais is the part of the gross national income, generated in the domestic economy and abroad by residents, that is attributed to the compensation of other factors, to which are added 16,254 million meticaisgenerated in the domestic economy by non-residents and sent abroad.
If there were no shaded cells in columns 3 and 4, it would be possible to study aspects related with the institutional distribution of income.
- 17 -
Table 3. SAM of Mozambique in 2007, with disaggregated factors of production and a part of the (domestic) institutions’ current account
(Unit: 106 meticais)
Outlays (expenditures)
Incomes (receipts)
PRODUCTION INSTITUTIONS
PRODUCTS ACTIVITIES
FACTORS CURRENT ACCOUNT
Labour
(employees) Other Total Households
Nonfinancial corporations
Financial
corporations Government NPISH Total
1 2 3 4 5 6 7 8 9
P R O D U C T IO
N PRODUCTS 1 0 180 731 0 0 0 166 398 0 0 24 738 0 191 137
ACTIVITIES 2 371 384 0 0 0 0 0 0 0 0 0 0
F A C T O R
S Labour (employees) 3 0 49 820 0 0 0 0 0 0 0 0 0
Other 4 0 136 101 0 0 0 0 0 0 0 0 0
Total 0 185 920 0 0 0 0 0 0 0 0 0
IN S T IT U T IO N S C U R R E N T A C C O U N T
Households 5 0 0 50 331
Nonfinancial corporations 6 0 0 0
Financial corporations 7 0 0 0
Government 8 16 991 4 732 0
NonProfitInstitutionsServing
Households(NPISH) 9 0 0 0
Total 16 991 4 732 50 331 122 595 172 925
C A P IT A L A C C O U N T
Households 10 0 0 0 0 0 0 0 0 0
Nonfinancial corporations 11 0 0 0 0 0 0 0 0 0
Financial corporations 12 0 0 0 0 0 0 0 0 0
Government 13 0 0 0 0 0 0 0 0 0
NonProfitInstitutionsServing
Households(NPISH) 14 0 0 0 0 0 0 0
0 0
Total 0 0 0 0 0 19 083
FINANCIAL ACCOUNT 15 0 0 0 0 0 0 0 0 0 0 0
REST OF THE WORLD 16 79 423 0 994 16 254 17 248
TOTAL 467 798 371 384 51 325 138 849 190 173
- 18 -
Table 3 (continued). SAM of Mozambique in 2007, with disaggregated factors of production and a part of the (domestic) institutions’ current account
(Unit: 106 meticais)
Outlays (expenditures)
Incomes (receipts)
INSTITUIÇÕES
REST OF THE
WORLD TOTAL
CAPITAL ACCOUNT
FINANCIAL ACCOUNT
Households Nonfinancial corporations corporations Financial Government NPISH
Total
10 11 12 13 14 15 16
P R O D U C T IO N
PRODUCTS 1 31 784 0 64 146 467 798
ACTIVITIES 2 0 0 0 0 0 0 0 0 371 384
F A C T O R
S Labour (employees) 3 0 0 0 0 0 0 0 1 505 51 325
Other 4 0 0 0 0 0 0 0 2 748 138 849
Total 0 0 0 0 0 0 0 4 253 190 173
IN S T IT U T IO N S C U R R E N T A C C O U N
T Households 5 0 0 0 0 0 0 0
Nonfinancial corporations 6 0 0 0 0 0 0 0
Financial corporations 7 0 0 0 0 0 0 0
Government 8 0 0 0 0 0 0 0
NonProfitInstitutionsServing
Households(NPISH) 9 0 0 0 0 0 0 0
Total 0 0 0 0 0 0 0
C A P IT A L A C C O U N T
Households 10
Nonfinancial corporations 11
Financial corporations 12
Government 13
NonProfitInstitutionsServing
Households(NPISH) 14
Total - 1 313
FINANCIAL ACCOUNT 15 0 0 0 0 0 0
REST OF THE WORLD 16
TOTAL
- 19 -
4.3.Aggregates, indicators and balancing items
As was seen above, practically all the transactions of the national accounts are covered by the SAM, so that macroeconomic aggregates, indicators and balancing items can be identified from it (see the description of the cells or blocks in Table 1, as well as Tables 2 and 3 for the application to Mozambique).
Gross Domestic Product at market prices (GDPpm), which is usually considered the main
macroeconomic aggregate, can be calculated in the three known approaches: - Production approach: GDPpm = P – IC + NTP = ta,p – tp,a + tdic,p;
- Expenditure approach: GDPpm = FC + GCF + Ex – IM = tp,dic + tp,dik + tp,rw;
- Income approach: GDPpm = GAV + NTP + NTA = tf,a + tdic,p + tdic,a.
The Mozambican GDPpm in 2007 was 207 644 * 106 meticais, which can be calculated from those
same three approaches as follows:
- Production approach: GDPpm = 371 384 – 180 731 + 16 991;
- Expenditure approach: GDPpm = 191 137 + 31 784 + 64 146 – 79 423;
- Income approach: GDPpm = 185 920 + 16 991 + 4 732.
Domestic Product can be converted into National Product by adding the compensation of factors received from the rest of the world and deducting the compensation of factors and the net indirect taxes (on both products and production) sent to the rest of the world, when these exist. Thus, from the described cells of the basic SAM, GDPpm can be converted into Gross National Product at market
prices (GNPpm) or Gross National Income (GNIpm), as follows: GDPpm + tf,rw – trw,f – trw,a– (part of)
trw,p. On the other hand, as the SAM directly provides Gross National Income, this can also be
calculated just by adding the net indirect taxes (on both products and production) received by domestic institutions: tdic,f + tdic,p + tdic,a. The corresponding amount for Mozambique in 2007 is 194
648 * 106 meticais, for which the underlying calculations are as follows: GNP
pm= 207 644 + 4 253 –
17 248; GNIpm= 172 925 + 16 991 + 4 732.
Disposable Income (Domestic or National) is also very important and can be calculated by adding to GNIpm the net current transactions received by domestic institutions: GNIpm + ((received)tdic,dic+
tdic,rw) – ((paid) tdic,dic+ trw,dic). In our application to Mozambique, although it was not possible to work
on the current transactions block, since for this level of disaggregation the current transactions received by domestic institutions from domestic institutions ((received)tdic,dic) and the current
transactions paid by domestic institutions to domestic institutions ((paid) tdic,dic) are equal, an
approximate amount can be calculated using net current transactions (tdic,rw – trw,dic): 194 648 + 15
- 20 -
In turn, gross aggregates can be converted into net aggregates (and balancing items) by deducting the consumption of fixed capital, which lies outside the basic SAM but is part of the integrated economic accounts.
Attention should be paid here to the fact that, especially in the case of Mozambique, where a considerable activity of all kinds is either not sold for cash or is not declared (an aspect that is partly discussed once more in Section 6), the above-mentioned amounts of income “may tell us much less than it appears” – to use the words of Seers (1952-1953: 160). Merely as an example in relation to this subject, an OECD study of the treatment of subsistence activities in national accounts concluded that “among the 48 developing countries covered, the share of non-monetary value added in total
GDP ranges from over 40% for the poorer countries of Africa to 5% or less for the more advanced countries of Latin America and Southern Europe” (Blades, 1975: 391).
Gross Saving (S) and Net Lending or Borrowing (NLB) are given directly by the SAM, through tdik,dic
and tdik,dif, respectively, which in the case of Mozambique in 2007 are: 19 083 and 1 313 * 106
meticais. As explained in Subsection 4.1 - k), the latter amount represents Net Borrowing.
It is also possible to calculate structural indicators of the functional and institutional distribution of generated income, as well as indicators of the use of disposable income.
In the functional distribution of generated income, the distribution of gross added value – GAV – among the factors of production is given by the structure of the submatrix in cell tf,a of the basic
structure, with its level of detail depending on the disaggregation of the activities (column account) and of the factors of production (row account). Table 4 shows the results for the applications to Mozambique.
Table 4. Mozambican functional distribution of the income generated in 2007 (in percentage terms)
% Factors of Production
(generated income = gross added value or gross domestic product) Labour
(employees) 26.7
Other
(employers and own-account workers; capital) 73.3
Total 100.0
Source: Table 3
In the institutional distribution of generated income, the distribution of gross national income – GNI – is given by the structure of the submatrix in cell tdic,f of the basic structure. In this case, the level of
- 21 -
is not available and consequently, as mentioned earlier, it was not possible to include this part in the application that was made.
As described above for the whole economy, the disposable income of the institutional sectors can be calculated in the same way, and then its distribution and use can also be studied. Due to the lack of available information by institutional sectors in our application to Mozambique in 2007, it is only possible for us to know that, of the total amount of disposable income, 90.9% represents final consumption expenditure, with the remaining 9.1% representing saving.
Some additional data would enable us to study other details, for instance per capita indicators with SDM information, despite the uncertainty of population estimates, especially for Mozambique (as
will be seen in the next section), and the dangers of per capita estimates.
The main items in the revenue and expenditure of the institutional sectors and of the rest of the world can be calculated from the respective rows and columns of the SAM. In the case of institutional sectors, the total balancing item is the net lending/borrowing (NLB) of the respective institutional sector, with an opposite mathematical sign to the one registered in the SAM; the current balancing item is the respective gross saving (S); and the capital balancing item is the difference between the first and the second. Table 5 illustrates the rest of the world’s revenue and expenditure for Mozambique in 2007, with the non-shaded cells filled in with the information that was accessed; the revenue and expenditure of the institutional sectors could not be calculated due to a lack of information.
Table 5. Rest of the world’s revenue and expenditure for Mozambique in 2007
(Unit: 106 meticais)
Resourcesor Revenue (SAM row)
Uses or Expenditure (SAM column)
Balancing item
1. Current Account -12 700
- Goods & Services Exports 64 146 Imports 79 423 -15 277 - Income Compensation of factors from the RW 4 253 Compensation of factors to the RW 17 248 -12 995 - Current Transfers Current transactions from the RW Current transactions to the RW 15 572 2. Capital Account Capital transactions from
the RW
Capital transactions to
the RW 14 013
3 = 1 + 2 (Balancing item =
Net Lending) 1 313
4. Financial Account (Balancing item = - Net Lending)
Financial transactions from the RW
Financial transactions
to the RW -1 313
5 = 3 + 4 = Total 0
- 22 -
5. Constructing SDMs. An application to Mozambique.
From what was stated in Section 3, just as in any SAM, time and space dimensions can also be identified in any SDM. With an equal number of rows and columns, in each SDM “in any period, the equality of inflows and outflows implies that the difference between the opening and the closing stocks is equal to the net inflow from the outside world” (Stone, 1986: 21). Thus, the SDM connects the opening and the closing stocks of year with the flows during the year .
In the standard stock-flow SDM, presented in Table 6, the state at New Year or +1 refers to the position on the 1st of January each year.
Table 6: The standard SDM
(Unit: number of individuals) State at New Year
State at New Year +1 Outside World
Our Country: Opening States
Closing Stocks Outside World
Our Country: Closing States b S n
Opening Stocks n’
Source: Stone (1986, 1982, 1981) Key:
(scalar) = individuals who both enter and leave our country during year and so are not recorded in either the opening or the closing stock of that year (babies born in our country during year who die in our country or emigrate before the end of it; immigrants into our country during year who died in our country or emigrate before the end of it).
(row vector) = individuals who leave our country during year and so are recorded in the opening stock but are not included in the closing stock (deaths and emigrants of year ).
b (column vector) = individuals who enter our country during year and so are recorded in the closing stock but are not included in the opening stock (births and immigrants of year ).
S (square matrix) = individuals who survive in our country through year and so are recorded in both the opening and the closing stocks (classified by their opening states in the columns and by their closing states in the rows).
n (column vector) = closing stock in each state. n’ (row vector) = opening stock in each state.
- 23 -
As seen above, besides the opening and closing stocks, the SDM also quantifies (for each year) the flows of individuals, which are recorded under “our country: (opening or closing) states”, defined in accordance with the taxonomic framework adopted. As far as those flows are concerned, adopting the words of Stone, “Each year individuals can enter a state in several ways: by survival in that same state from last year, by moving into it from a different state in the course of the year, by birth or by immigration; and they may leave it by survival into the year, by moving into another state during the year, by emigration or by death” (Stone, 1986: 22).
Active or passive sequences can be adopted within this framework. In the case of active sequences, different population groups can be identified, including those who are learning – schoolchildren and
students; those who are earning – members of the labour force, who participate in the market; and the rest – all the educationally and economically inactive (in the sense that they do not participate in the labour market and do not produce goods and services transacted in the market). Passive sequences cover socio-economic groups, which may include such considerations as income, social class, family size, etc.
The identification of different age groups can be regarded as the necessary step to be taken before working with an active or a passive sequence.
In the following application to Mozambique in 2007, in order to better deal with the above-mentioned complexity and to study the so-called economic activity of the population, two levels of disaggregation were identified. At the first level, the population was organised by age groups; at the second level of disaggregation, within each age group, the population was classified as either active or inactive, considering their participation both in the labour market and in the supply side of the goods and services market. With this process of organisation, the difficulty of obtaining data led, in some cases, to the adoption of estimates and assumptions in order to be able to complete the matrices. The hierarchical method, adopted in the previous section (for the construction of the SAM), was adopted. According to this method, each level of disaggregation has all the controlling totals for the next level of that hierarchy.
- 24 -
Table 7: SDM for Mozambique in 2007 – first level of disaggregation: by age group.
(Unit: 103 individuals)
Outside World
Population in Mozambique by age group
Closing Stock
0-14 15-24 25-64 65&more
Outside World 471 275 775 764 20 252
Population in
Mozambique by age group
0-14 637 8 867 9 504
15-24 213 139 3 322 3 674
25-64 312 540 5 599 6 451
65&more 3 614 4 623
Opening Stock 21 372 9 478 4 137 6 988 769
Source: Table B.1.
In the first age group of the population in Mozambique in 2007, represented in Table 7 – column and row 0-14, we can see the stocks and the flows of children aged 0 to 14, measured in thousands of individuals. Thus, reading by columns, the opening stock of children was 9,478; of these, 471 died or emigrated, 8,867 remained in that age group throughout the year and 139 moved to the 15-24 age group. Reading by rows, the closing stock was 9,504, which is composed of 637 children surviving births and immigrants and 8,867 children who have not changed state. A similar reading can be made for each of the other columns and rows.
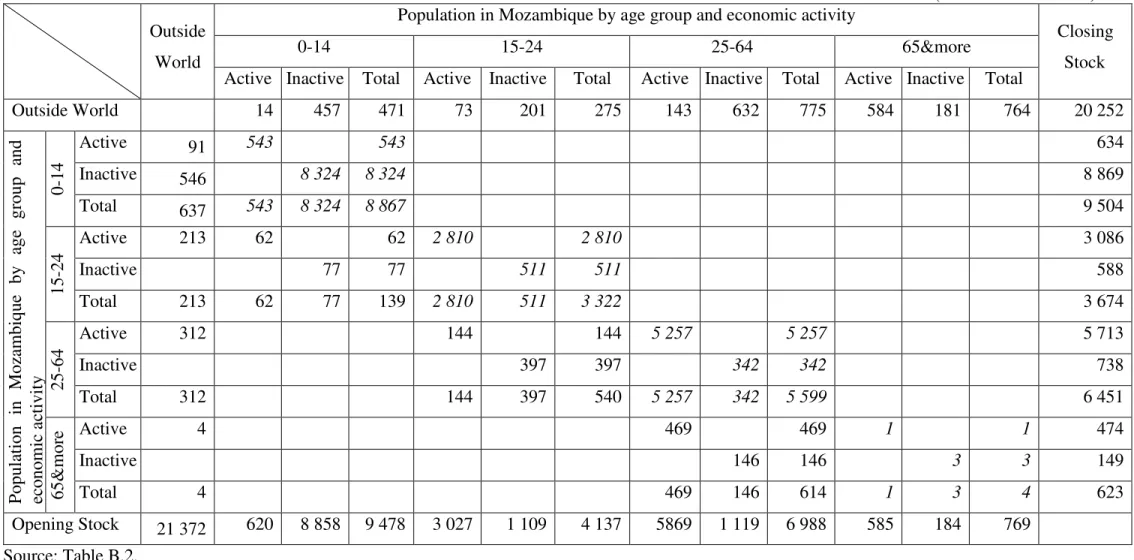
The next level of disaggregation will look at the economic activity (as described above) of the population in Mozambique in 2007, within each age group and as represented in Table 8. From the disaggregation of the columns and rows of the 0-14 and 65&more age groups, we can see that a part of the population under 14 years of age is already active and that a part of the population over 65 years old is still active. As was seen above, the economically active population amounts to those people that participate in the labour market and/or produce goods and services transacted in the market. Reading the column of the active 15-24 age group, we can see that the opening stock of the active population aged 15 to 24, measured in thousands of individuals, was 3,027; of these, 73 died or emigrated, 2,810 remained in the same situation throughout the year and 144 moved to the active 25-64 age group. Reading the row for the same age group, the closing stock was 3,086, which is composed of 213 immigrants, 62 entrants from the 0-14 age group, and 2,810 who have not changed
state. As was stated for the previous level of disaggregation, a similar reading can be made for each of the other columns and rows.
- 25 -
application to Mozambique in 2007 due to the inaccessibility of such information, even to support acceptable estimates.
- 26 -
Table 8: SDM for Mozambique in 2007 - second level of disaggregation: by age group and economic activity.
(Unit: 103 individuals)
Outside World
Population in Mozambique by age group and economic activity
Closing Stock
0-14 15-24 25-64 65&more
Active Inactive Total Active Inactive Total Active Inactive Total Active Inactive Total
Outside World 14 457 471 73 201 275 143 632 775 584 181 764 20 252
P op ul at io n in M oz am bi qu e by ag e gr ou p an d ec on om ic a ct iv it y 0-14
Active 91 543 543 634
Inactive 546 8 324 8 324 8 869
Total 637 543 8 324 8 867 9 504
15
-2
4 Active 213 62 62 2 810 2 810 3 086
Inactive 77 77 511 511 588
Total 213 62 77 139 2 810 511 3 322 3 674
25
-6
4 Active 312 144 144 5 257 5 257 5 713
Inactive 397 397 342 342 738
Total 312 144 397 540 5 257 342 5 599 6 451
65
&
m
or
e Active 4 469 469 1 1 474
Inactive 146 146 3 3 149
Total 4 469 146 614 1 3 4 623
Opening Stock 21 372 620 8 858 9 478 3 027 1 109 4 137 5869 1 119 6 988 585 184 769
- 27 -
6. Examples of socio-economic studies that can be addressed using SAMs and SDMs. The informal aspects of the activity of countries.
Chapter 25 of the 2008 SNA identifies in the activity of countries a part “that reflects the effort of people without formal jobs to engage in some form of monetary economic activity” (ISWGNA, 2009: 471), in which the household unincorporated enterprises, operating within the production boundary of the SNA3, sell or barter on the market most or all of their output; in other words, they have market
output. Because they operate on a small scale, at a low level of organisation, with little or no division between factors of production, the income that is generated by their activity is the so-called mixed income. Thus, as is mentioned in Chapters 7 and 24 of the 2008 SNA, the mixed income is the
compensation of the owner(s) of an unincorporated enterprise or members of the same household that may contribute with unpaid labour inputs of a similar kind to those that could be provided by paid employees. Since the household unincorporated enterprises may operate with or without paid employees, the distinction can be established between employers’ mixed income and own-account (or self-employed) workers’ mixed income, respectively.
Within the framework of the proposed SAM, this compensation of employers and own-account workers can be added to the compensation of employees to complete the compensation of labour in the gross added value of the activity of countries, together with the corresponding contribution to the functional distribution of the generated income, as was seen in Section 4.3. In turn, when we think of the institutional distribution of the income generated, the disaggregation of the households may follow what is defined in Chapter 4-G of the 2008 SNA, in other words in accordance with their main source of income (ISWGNA, 2008: 82-84), and the following groups could be worked upon: employees; employers and own-account workers; recipients of property and transfer income. But, after it is generated, this income follows a path in which it is distributed among institutions and accumulated by institutions, and this factor should not be neglected, otherwise an important part of the network of linkages underlying the activity of countries would be missed.
In this respect, we should bear in mind the two general principles recommended by Pyatt and Round regarding the taxonomy to be adopted in the SAMs’ design: “the classifications adopted for factors, for goods and non-factor services, and also for institutions need to be developed jointly” (the activities would certainly be included here if they had been included in the SAM used in the article4); and the
“classification system should be designed in such a way that any underlying duality is apparent” (Pyatt and Round, 2012: 267). Respecting these principles avoids overlooking important parts (which may even be crucial) of the network of linkages, which we have been mentioning.
3 As defined in Chapter 6 of the 2008 SNA (ISWGNA, 2009: 98-101)
4 The inclusion of separate accounts for production activities was not considered important in the context of the article