Availableonlineatwww.sciencedirect.com
http://www.revistas.usp.br/rai RAIRevistadeAdministraçãoeInovação13(2016)135–144
Change
and
innovation:
an
observable
relationship
in
services?
夽
Marina
Figueiredo
Moreira
∗,
Tomas
de
Aquino
Guimarães,
Jean
Philippe
UniversidadedeBrasília(UnB),Brasília,DF,BrazilReceived8July2015;accepted18March2016 Availableonline13May2016
Abstract
Theconnectionbetweenchangeandinnovationisnotalwayslinearandtherearenotmanystudiesonthesubjectintheareaofservices.This studyaimstoexplainthelinkbetweenwillingnesstochangeandinnovationinservices.TheconstructsWillingnesstoChangeinServicesand InnovationinServiceshavebeenanalyzed.Twoscaleswereappliedinordertomeasuretheseconstructsinasampleof351companiesdeveloping softwareservicesinBrazil.Twoindicesweregenerated:theWillingnesstoChangeCoefficient–derivedfromtheperceptionoftechnicalstaffand managersinrelationtothevariablesofeachfactorontheWillingnesstoChangeinServicesscale–andtheInnovationinServicesCoefficient– derivedfrommeasuresconcerningtheintroductionofneworsubstantiallyimprovedsoftwarebycompaniesandtheirimpact.Linearregression analysisshowednosignificantcorrelationbetweenWillingnesstoChangeinServicesandInnovationinServices.Thesefindingscanbeexplained byfactorssuchasthedissonancebetweentheconstitutivelogicoftheWillingnesstoChangeinServicesandISscales,sincetheformerapplies fullytotheanalysisofserviceswhilethelatterderivesfromindustrialindicators;theomissionofphenomenathatmayactasmediatorsinthe relationship;thenatureofChangeinServices,whichcouldberelatedtootherprocessesthanthosedirectlyrelatedtocustomerandprovider,so thattheagentsofchangearenotconsideredininnovationmeasuresand,therefore,notmeasurableontheInnovationinServicesscale.
©2016DepartamentodeAdministrac¸ão,FaculdadedeEconomia,Administrac¸ãoeContabilidadedaUniversidadedeSãoPaulo-FEA/USP. PublishedbyElsevierEditoraLtda.ThisisanopenaccessarticleundertheCCBYlicense(http://creativecommons.org/licenses/by/4.0/). Keywords:Change;Innovation;Services;Software
Introduction
In the area of innovation, a number of studies aiming to identifyinnovationvectorsstandout,suchasBeckerandDietz (2004),exploringResearchandDevelopment(R&D)asan inno-vationvector,Gu,Zhang,andKang(2006),testingtheimpactof R&DoninnovationgenerationandpatentregistrationinChina, andSimioni,Hoff,andBinotto(2015),exploringfactorsthat driveinnovationinthewoodsectorinBrazil.Oneofthedrivers traditionallyassociatedwithinnovationischange.The assump-tionis that change isanecessary condition for innovation to
∗Correspondingauthor.
E-mails:marinamoreira@unb.br(M.F.Moreira),tomas@unb.br (T.deAquinoGuimarães),jean.philippe@univ-amu.fr(J.Philippe).
PeerReviewundertheresponsibilityofDepartamentodeAdministrac¸ão, Fac-uldadedeEconomia,Administrac¸ãoeContabilidadedaUniversidadedeSão Paulo–FEA/USP.
夽 ResearchfundedbytheHigherEducationPersonnelImprovement
Coor-dination–CAPESunderCAPES/COFECUB(Brazil –France)cooperation agreement.
takeplace.Changeisthuscharacterizedasastagepriorto inno-vation. The two phenomena havebecome widelyrecognized theoreticallyaspartners(Poole&VandeVen,2004)andhave beenexploredinstudiesthattestthelimitsoftheirrelationship. Twocampshaveemerged:thosewhoexploretherelationship betweentechnicalchangeandinnovation,suchasMoweryand Rosenberg(2000),JamisonandHård(2003)andHekkert,Suurs, Negro,Kuhlmann,andSmits(2007),andthosewhoinvestigate theconstructofinnovation-relatedorganizationalchange,such asEdwards(2000)andDooley(2004).
The wide application of these studiesto different sectors, activitiesandbusinesssegmentsindicatesthattherelationship betweenchangeandinnovationisnotlimitedtospecificsectors. Thisreasoningleadsustoproposeacentralresearchhypothesis: inservices,aswellasinindustrialactivities,changebehavesas apredictorofinnovation.Inordertotestthishypothesis,some questionsneedtobeanswered:howshouldthephenomenaof changeandinnovationbeaddressedinordertodevelop measure-mentscalesthatarevalidforservices?Howshouldthepredictive linkbetweenthesephenomenabetested?
http://dx.doi.org/10.1016/j.rai.2016.03.001
1809-2039/©2016DepartamentodeAdministrac¸ão,FaculdadedeEconomia,Administrac¸ãoeContabilidadedaUniversidadedeSãoPaulo-FEA/USP.Published byElsevierEditoraLtda.ThisisanopenaccessarticleundertheCCBYlicense(http://creativecommons.org/licenses/by/4.0/).
Toanswerthesequestions,thefirsttaskistostudythetwo phenomena(acceptedhereasconstructs)ofchangeand innova-tioninthecontextofserviceactivities. Whilemuchhasbeen published on innovation in services since 2010, a period of timeaccountingfor70%ofthestudiesonthesubject(Moreira, Guimarães,&Philippe,2013),littlehasbeensaidonthe phe-nomenon of change in services over recentdecades. This is notamatterofchance,butacharacteristicinherenttothe ser-vicesthemselves,forwhichchangeisessentialtotheiroperation (Delaunay&Gadrey,1987;Hill,1977).Ifeveryserviceentailsa change,howcanoneidentifychangeinservices?Answeringthis dilemmaseemstostemfromneo-Schumpeteriantheory(Nelson &Winter,2005)forinvestigatingthenatureoftheinnovation process.
Amongtheapproacheshistoricallyusedininnovation stud-ies,thedemand-pullapproachhasbeenparticularlyprominent inthecontextofservices.Thisisexplainedbyitsassumption thatthecustomer–inthecontextoftheconsumermarket–is asourceofinnovation.Theapplicationofthisapproachto ser-vicesexplainswhythecustomerplaysadirectroleingenerating innovation.Knowingthattheprovisionofaservicedependson the coexistence of andinteractionbetween provider and cus-tomer(Gadrey,2000;Gallouj,2002;Kon,2004;Miles,2005; Rubalcaba,2007),twoagentsemergewhocaninterveneinthe innovationprocessand,beforethat,intheprocessofchangein aservice.
Moreira etal. (2013)understand that the service provider plays an active role in accepting or imposing barriers tothe assimilationofinputsforchangeinservicethatcustomers sug-gest.Theyarguethatchangeinservicescorrespondstorequests for changes in the features previously agreed for a service during its delivery. Customers make dynamic requests dur-ingservice delivery– requestsforalterations, scopechanges, project reviews, andso on – and it is upto the providers to accept,revise orreject suchrequests.Theauthors outlinethe conditions for a provider to accept suggested changes tothe originalprojectof aservice.ThisisWillingnesstoChangein Services (WiCS), understood here as representing change in services.
Withthemeasurementofchangeinservicesestablished,the nexttaskistoadoptcriteriatomeasureinnovationinservices. Wechoose,inthisstudy,toadoptameasurementscaleappliedin theTechnologicalInnovationSurvey–PINTEC(IBGE,2010) –that,inturn,isderivedfrominternationalmeasurements sug-gested by the Oslo Manual (OECD & Eurostat, 2005). We attempttoaddressthesecond questionthatemergesfromthis study:howshouldtherelationshipbetweenchangeand innova-tioninservicesbetested?Inordertoanswerthisquestion,this paperaims toexplaintherelationshipbetweenwillingnessto changeandinnovationinservices.
Changeandinnovation:closenessandboundaries
betweenthetwoconcepts
Changecanbebroadlyunderstood as alterationovertime. The recognition of this alteration of reality – and therefore change–islinkedtoindividualperception(Lau&Woodman,
1995). The concept of innovation can be understood in the present techno-economic paradigm (Perez, 2002)in the light of the neo-Schumpeterian or evolutionary school (Nelson & Winter,2005).Schumpeter’s(1982,p.93)concept of innova-tion as “the carrying out of new combinations of resources” capable of generating new goods, production methods, mar-kets, raw materials and forms of organization is a starting pointfor theadvancesproposedbyevolutionaryauthors.The neo-Schumpeterianschoolaimstodeveloptheoriginal Schum-peterianconcept–proposedattheheightoftheFordisteconomic period – into a concept of the innovation phenomenon capa-ble of encompassing newforms inan economy in transition toaservice economy(Rubalcaba,2007).Neo-Schumpeterian authorsemphasizeinnovationasameanstoobtaincompetitive advantagefromtheappropriationofcostandqualityadvantages (Kon,2004).Thus,innovationisdefinedasaphenomenonthat canimpactthecompetitivenessoforganizations.
Changeandinnovationareclose,whichiswhytheycanbe considered“partners” (Poole&VandeVen, 2004).The joint analysisofsomeoftheconceptsattributedtochangeand innova-tion–assumingtherearenouniversallyacceptedanddefinitive concepts for either of them – makes it possible to establish boundariesbetweenthe phenomena.The conceptsof change, whenreferringtoalterationofacurrentsituation,directattention totheactofchangeratherthantoitseffects.
The innovation phenomenon, inaddition toorganizational change, enablesalteration ofthecurrent situationthrough the introductionofanewcombinationofresources.Innovationalso entails the assumptionthat improved resultswill be obtained and will generate value – originally described as economic valueintheSchumpeteriananalysis,althoughlatertheoretical developments acceptinnovations capableof generatingsocial value,providingthebases fortheories ofsocial entrepreneur-ship. This approach makes it possible to establish two key dimensions forinnovation analysisanddiagnosis:the dimen-sionofaction(implyingtheintroductionofanewcombination of resources), and the dimension of qualitatively improved results (implying that innovation necessarily generates quali-tative improvement in relation to the prior situation) (IBGE, 2010).
The breakdownof thetwophenomenarevealsthat change andinnovationsharethedimension ofaction,giventhatboth refer toagreater or lesserextent toalterations inthe current situation. Just as change refers toa situation of alteration of apreviousreality,innovation canalsobeassociated withthis understanding.Changeswouldthusgeneratealterationsin orga-nizations,productsorservices,andalsoforinnovations,which wouldlinkthetwophenomena.Whileforchangethedefining focusisontheparametersalteredbythechange(Poole&Van deVen,2004),forinnovation,thefocusshiftstothequalitative results obtained (Nelson & Winter, 2005),withoutany judg-mentaboutthealteredparameters–whichcreates aspacefor the emergence of multiple models,categories and typologies aimedatunderstandingthedifferentmanifestationsof innova-tion.Therefore,interpretinginnovationinservicesrequiresan understandingofthewillingnesstochange,whichisaddressed below.
WillingnesstoChangeinServices–WiCS
Moreiraetal.(2013,p.55) describechange inservicesas “any alteration in the characteristics foreseen for a service, regardlessofqualitativemerit,whichoccurredduringits deliv-erywithaviewtoalteringthe finalservice”andattributeits generationto“alterationsintheexpectationsofcustomersand providers, which are consecutively reconfigured through the stagesofproviding aservice.Thus,the authorsdefineWiCS asthe “willingnessof anindividual or organizationtoaccept alterationsinthecharacteristicsforeseenforafinalservice”.
To investigate the explanatory dimensions of WiCS, the authorsstudiedsoftwareservices.Theseservicesrepresent“a variety of services directly or indirectly related to software, rangingfromtraining,maintenanceandsupporttofull made-to-orderdevelopment”,coveringalsothe“meetingpointbetween theproductmodelandtheservicemodel”,whichiscustomizable software(Petit,Janssen,&Leitão,2007,pp.13–14).Software serviceshaveclearcharacteristicsofservicedeliveryduetothe highlyindividualized nature of the finalproduct. In addition, theseservicesvaryinintensityofinteractionbetweencustomer andprovider,makingitpossibletoisolatethedesiredlevelof interaction.
In order toidentify the explanatory dimensions of WiCS, Moreiraetal.(2013)conductedasurveywithexpertsinsoftware servicesthrough a seriesof semi-structuredinterviews inten citiesinBrazil.Usingcontentanalysistechniques,theauthors constructed seven explanatory dimensions for WiCS: Cus-tomerRelationshipManagement;SoftwareCharacteristicsand SoftwareDevelopment;OrganizationalConditionsforChange; TeamConditions;AdministrativeProceduresandConditionsfor DecisionMaking;EnterprisingBehavior;andInteractionwith SupportingOrganizations. Sincethisisthefirst efforttomap WiCS,thedimensionspresentedbytheauthorsareconsidered exploratory.
Subsequently,thesesevendimensionswereusedasabasis for choosingthe itemsthat comprised thefirst versionof the measurementscaleproposedforWiCS.Aftersemanticand the-oreticalvalidationofthescalebyjudges,Moreiraetal.(2013) appliedthescaletoasampleof351companiesthatprovide soft-wareservices.UsingExploratoryStructuralEquationModeling for theresults obtained fromthe applicationof the scale,the authorsvalidatedameasurementscaleforWiCSconsistingof threeexplanatoryfactors:OrganizationalRoutinesandValues (Cronbach’sAlpha0.8); OrganizationalStructure for Change (Cronbach’sAlpha0.65)andServiceSpecificities(Cronbach’s Alpha0.69).Fig.1showsthefactorsandtherespectiveitems thatcomprisethestructureoftheWiCSconstruct.
InnovationinServices–IS
Inordertotestthe relationshipbetweenchange and inno-vation inservices, and having defined WiCS as representing changeinservices,theremainingtaskistoselectindicatorsfor innovationinservices.Theframeworkforproposinginnovation indicators – understood as measures of results in terms of developmentofinnovationsbyfirms,sectorsandcountries–is
theOECDInnovationManualknownastheOsloManual.This Manual is based on the technology-push approach – which establishesmeasurementsforresearchanddevelopmentefforts byfirmsasaninnovationindicator–anddemand-pullapproach –whichusesmeasuresforinteractionswithconsumers. Addi-tionally,itispossibletorecognizeindicatorsaimedatmeasuring cooperationandpartnershipbetweenfirms,whichprovide the theoreticalbasisforasystemicapproachtoinnovation.
InBrazil,theOsloManual(OECD&Eurostat,2005)serves asthebasisfortheTechnologicalInnovationSurvey–PINTEC (IBGE,2010).ThePINTECeditionforthe2006–2008period usesthe2005editionoftheOsloManualasabasisforthe for-mulation ofits indicatorsandincludesservicesectors among the surveyed companies (considering only IT and computer-relatedservices).In PINTEC, thereare nospecificindicators forservices,butthemeasurementsareextendedtothese compa-nies.Aquestionclearlyemerges:whatisthelimitforextending indicatorsfrom industrytothe measurementofinnovation in services?
Evangelista andSirilli (1998)explorethe results of a sur-vey conducted on the theoretical basis of the Oslo Manual withItalianservicecompanies.Theresultsshowedtheneedto adaptindustrymeasurementstomeasureinnovationinservices. Notingthat “accumulatedexperienceinmeasuringinnovation in industrial sectors is an excellentstarting point tomeasure innovation in services”,the authors characterize the original measurements–derivedfromtheOsloManual–asinputsfor thedevelopmentofspecificmeasurementstomeasure innova-tion services, emphasizing that it is necessary todiscuss the limitsofapplicationofthesemeasurementstoservicesectors.
Although the Oslo Manual andPINTEC can be extended toservicesectors,itisknownfromempiricalresultsthatthese applicationsarelimited.Thus,theconstructionofmeasurements for innovationinservicesis indicatedbyGalloujandSavona (2009,2010,p.40)asaresearchagendaforthefieldof inno-vationinservices.Historically,theauthorsdemonstratethatthe useoflarge-scalesurveysinservicesprovestobeproblematic foranumberofreasons,suchasmethodologicaldifficultiesin defininginnovationoutputsofservices,measurementsandscope of data collection, andtheysuggest that “different andmore comprehensivemeasurementsneedtobeincorporatedintothe innovativeactivitiesoffirmstostudythenatureofinnovation inservicesanditseffectsontheeconomicperformanceofthe services”.
Withaviewtoaddressthelackofindicatorsforinnovation in services,attention should be drawn tothe recentproposal of the SSII – Service Sector Innovation Index, a composite innovationindexbasedon23original indicatorsof theISC-4 – Community Innovation Statistics.Thisindex,supported by a European survey and similarto PINTEC, is also based on the Oslo Manual for proposing indicators,grouped into nine themes: humanresources,demandfor innovation,public sup-port for innovation, product and process innovation, product innovationoutputsandprocess,non-technologicalinnovations, outputsof non-technologicalinnovation, marketingand intel-lectualproperty. Theindicators areselectedinordertocover themaincomponentsofperformanceintermsofinnovationfor
There are different ways to describe system prototypes to incorporate customer inputs. The priority is to ensure that the developed software complies with the original specification. There is freedom for the customer to suggest changes during the software generic phase.
It is believed that cooperation with other companies makes my company more open to accept changes in software suggested by customers. Customer participation in software development improves project execution.
There is openness to accept changes in software suggested by customers.
Management supports changes suggested by customers in relation to the original software project. It is believed that the changes incorporated in the software will make a difference in the future. An attempt is made to reduce customer participation that alters the original software projects. It is believed that customer suggestions help improve the quality of the software developed. Risks of changing the original design of a software are accepted.
Staff members support each other to incorporate changes in software suggested by customers.
There are rewards for staff more willing to accept changes in software suggested by customers.
Staff members are encouraged to accept changes proposed by customers in relation to the original software project.
Accumulation of functions by the staff responsible for software development hinders acceptance of changes suggested by customers in relation to the original project.
Staff members have autonomy to accept changes suggested by customers in relation to the original software project. Customer participation in software development occurs in other phases besides the specification phase. Staff members are willing to incorporate software alterations suggested by customers.
Customer suggestions that alter the original software project are incorporated, regardless of development deadlines. Customer suggestions that alter the original project are more easily accepted in software with potential to generate advances in the existing technology.
Customer suggestions that alter the original project are more easily accepted in software that has greater potential to be marketed to other customers.
Customer suggestions that alter the original project are more easily accepted in software with a greater profit margin. Software alterations suggested by big customers are more frequently accepted if compared to those made by other customers. Customer suggestions that alter the original software project are incorporated regardless of the software’s development stage.
Organizational structure for change Willingness to change in services Service specificities Organizational routines and values
Fig.1.FactorstructureforWiCS.Source:Moreiraetal.(2013). servicefirms(Arundel,Kanerva,VanCruysen,&Hollanders,
2007).
Asasubset ofindicatorsderived fromtheISC-4, theSSII certainlycontributestotheselectionofindicatorsthataremore sensitivetothedynamicsof innovationinservices. Neverthe-less,itdoesnot,onitsown,fulfillresearchneeds.Itisapartial response to the task of establishing indicators for innovation inservices,sincethetaskofdevelopingindicatorsspecifically aimedatmeasuringthepeculiardynamicsofinnovationinthe servicesectorhasyettobeaddressed(Gallouj&Savona,2009, 2010)(Fig.2).
In thisstudy,the measurementof the resultsgenerated by innovationinthecompaniessurveyedwascarriedoutthrough
Innovation in services – New or substantially improved software – Degree of novelty of software – New or substantially improved processes, methods or development tools – Degree of novelty in processes, methods or development tools
Fig.2.Indicatorsofinnovationinsoftwareservices.Source:Preparedbythe authors.
data collection using ameasuring instrument developed as a result ofselection andadaptation offoursubindicatorsof the 2008PINTEC.Theindicatorsadoptedconsiderinnovationsin products–understood,forsoftwareservices,astheintroduction ofneworsubstantiallyimprovedsoftware–andinnovationsin processes–understoodastheadoptionofnewprocesses, meth-odsanddevelopmenttools.Inaddition,theimpactofsoftware andprocesses adoptedismeasured bycharacterizingthemas “newtoBrazil”and“newtotheworld”.Thus,themeasurement structurefortheconstructInnovationinServicesiscreated,with afocusonsoftware.
Method
TotesttherelationshipbetweenWiCSandtheresultsinterms ofInnovationinservices,werecoveredthedatafromthe appli-cationofthe WiCSscalecarried outbyMoreiraetal.(2013) andappliedthe scaleproposedinthisstudyfor the measure-mentofInnovationinServices,consistingoffouritems,tothe same group of companies originally selected by the authors. Thus, both scales were applied to a random sample of 351 companies that develop software services in Brazil, focusing on services entailing high interaction between customer and provider,i.e.developmenttoorderandcustomization.The sam-plewasobtainedfromapopulationof2300Braziliancompanies. We had access to one representative with a systems analyst profile orequivalentposition percompany.The appliedscale measured theresultsintermsofInnovationinServicesinthe
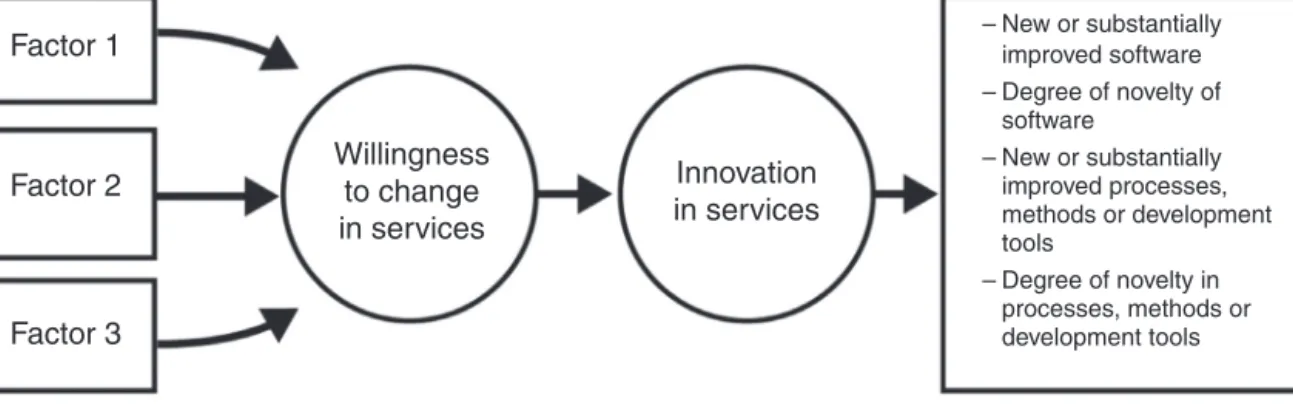
Willingness to change in services Factor 1 Factor 2 Factor 3 Innovation in services – New or substantially improved software – Degree of novelty of software – New or substantially improved processes, methods or development tools – Degree of novelty in processes, methods or development tools
Fig.3.Theoreticalmodelof“WillingnesstoChangeinServices”and“InnovationinServices”incompaniesthatdevelopsoftwareservices.Source:Preparedby theauthors.
companiesstudied and,consideringthe fouritems, measured innovationsinproductsandprocesses,aswellastheirdegreeof novelty.BothscalesareLikert-typescaleswith10positionsfor themeasurements.
Basedondataobtainedfromthescales,twoindicesderived from the variablesoriginally measured were calculated. The firstistheWillingnesstoChangeCoefficient(WCC),avariable derivedfromtheindividualvaluesobservedforeachrespondent, forthevariablesofeachexplanatoryfactoroftheWiCS.WCC indicatesthegrossscoreobtainedbyeachrespondentinrelation totherespondent’swillingnesstochange.
ThesecondcalculatedindexwastheInnovationinServices Coefficient(ISC),whichisderivedfrommeasurementsobtained bycompaniesparticipatinginthesurveyinrelationto introduc-tionofneworsubstantiallyimprovedsoftwareanditsimpact. NewsoftwareforBrazilwasgivenaweightingofone,whilenew softwarefortheworldwasgivenaweightingoftwo.Thesame logicwasappliedtoinnovationsinnewprocesses,methodsand developmenttools.
ISC was calculated by ISC=ISof +IProc, in
which N (|SofnM∗2 )NsofnB+ISof =Nsof∗ and
N (|ProcnM∗2 )NprocnB+IProc=Nproc∗ . ISof refers to the number of innovations generated by launching new softwareproductsinthemarket;Nsof indicatesthenumberof
newsoftwareproductsintroduced;NsofnBreferstothenumber
ofnewsoftware productsforBrazil, andNsofnMindicatesthe
number of new software products for the world. Similarly,
Nprocindicatesthenumberofnewprocessesintroducedintothe
market;NprocnBreferstothenumberofprocessesforBraziland NprocnM referstothe numberof newprocessesfor theworld.
Basedonthecalculationoftheindicators,thetheoreticalmodel testedinthisstudyandshowninFig.3wasdesigned.
Themodeltobetestedisbasedonhypothesis(H1): “Will-ingnesstoChangeinServicesdirectlypredicts Innovation in Software Services, confirming that Willingness to Changeis aninputfor Innovation inServices”. In ordertotestthe pre-dictedrelationships,linearregressionanalyses(Hair,Anderson, Tatham,&Black,2010)wereconductedbetweentheWiCSand IS constructswiththe aid of the SPSS program. In addition, we testedthe relationshipbetween WiCSandthree variables measured in the software development companies: region of operation,companysizeandnumberofemployees.
Resultsanddiscussion
Thefirstlinearregressionanalysisperformedtesteddirectly therelationshipbetweentheWCCandtheISC.
Theresultsofthisanalysisindicatethatthereisno signifi-cantrelationshipbetweenthevariables.Thevaluesofr=0.092 andr2=0.008indicatevirtuallynoprediction.Thisresultdoes notsupportthepredictedrelationship,inviewoftheabsenceof sharedvariancebetweentheWCCandISCvariables.In addi-tion, we tested the significance of the variables representing the WiCSfactorsinrelationtothe ISC. Wedidnot findany significant values at the threshold of p<0.05 for analysis of significanceat95percentconfidenceinterval.
Given the non-significant result for the first relationship tested, we decided to extend the analyses to relationships between WCC and the individual indicators that make up the ISC: ISofandIProc.Further analysisof linear regression betweenWCCandISofwasconducted.Thevalueobservedfor
r=0.069 andr2=0.005again indicated nearzeroprediction. Asin theprevious analysis, significant p valuesfor the vari-ablesstudied werenot recorded.The regression testbetween WCC andIProc yielded resultssimilar tothe previous ones, withvaluesof r=0.02andr2=0.0004.In thiscase,the vari-ablesassociatedwiththeWCCwereresponsiblefor2%ofthe varianceinISC.Table1showstheresultsofthelinearregression betweenWCCandISC,betweenWCCandISof,andbetween WCCandIProc.
Table1
LinearregressionsbetweenWCCandISC;betweenWCCandISof;andbetween WCCandIProc.
Regressions
Coefficient WCC ISof IProc
F1 0.086 0.047 0.126 F2 −0.044 0.016 −0.92 F3 −0.028 −0.063 −0.002 R 0.092 0.069 0.02 R2 0.008 0.005 0.0004 R2adjusted −0.001 −0.004 0.011
Source:Researchdata. *p<0.05and**p<0.01.
In addition to the linear regression tests between the coefficients, Analyses of Variance (ANOVA) were also per-formedbetweentheWCCvaluesandthe variablesfor region ofoperation, timeinthemarket andnumberofemployeesof companies.Originally,the“Unitsfederation”variablewas mea-sured,whichcorrespondedtotheBrazilianstatesinwhichthe companiesoperate.Theseunits weregroupedinto regionsof operation.WechosetogrouptheNorthandNortheastregions duetothesmallnumberofcompaniesintheNorthRegion,with onlytwoparticipatingcompanies.Thedatashowthatthereare 195companiesintheSoutheastRegion,85intheSouthRegion, 41intheNorthandNortheastRegionsand27intheCenter-West Region.TheANOVAtestsofthemeandifferencebetweenWiCS scoresofcompaniesoperatingindifferentregions,theirlength oftimeinoperationandnumberofemployeeswereconducted. ThefirstANOVAtestedthemeandifferenceinWCCbetween thedifferentregionsofBrazil.TheresultsshowthattheWCC scoresremainedstableacrossthedifferentregionsofBrazil,in viewoftheclose-to-meanvaluesrecorded.Thelowestmeanwas observedintheSoutheastRegion,with172.72,andthehighest intheCenter-WestRegion,with182.92.Thestandarddeviation also remains relativelyconstant across regions,ranging from 18.59(North/Northeast Region)to27.10(Southeast Region). The significance testshowsp=0.216, indicatingthat there is no significant relationshipbetween the WCC scores andthe variablesassociatedwiththefederationunitswherecompanies operateatthe95%confidenceinterval.The pairwise compar-isonbetweenregionswasperformedwiththeBonferronipost hoctest,butproducednop<0.05values,indicatingthatthere isnosignificantdifferenceinthecomparisonofmeansbetween regions.Table2showstheseanalyses.
ANOVAanalyseswerealsoperformedtotestthedifferences inWCCmeansinrelationtovariablesrepresentingcompanies’ timeinthemarketandnumberofemployees.Theresultsdidnot indicatesignificantrelationships,withnop<0.05values. There-fore,thatlengthoftimeinoperationandnumberofemployees, aswellasregionofoperation,donothaveasignificantimpact ontheWiCSscoresamongthecompaniesinthesample.
Theresultsobtainedfromtheanalysisperformedinthisstudy indicatethatthereisnopredictiverelationshipbetween Willing-nesstoChangeandInnovationinServices.Thesignificanceof thisresultmeritsdiscussions.Farfrombeingcharacterizedasan unknownrelationship,theconnectionbetweenchangeand inno-vationiswidelyassumed instudiesoncreativity,change and innovation. Traditionally, change is accepted as astage prior toinnovation and,therefore,as itsexplanation, causeor vec-tor.What explains, then, the fact that thisrelationship isnot confirmedinthepresentstudy?
Thenon-significantresultwasrepeatedinthreelinear regres-sions,whichstronglyindicatesthatthepossibilityoferrorinthe statisticalanalysiscanbeexcluded,leavingotherelementstobe addressed.Whentakingintoaccountthesignificantnumberof casesanalyzed(351participatingcompanies)andthevariability ofscoresobtainedforWCCandtheISC,thereareindications thatthedatadonotpresentassociatedmeasurementerrors,and haveappropriatevariabilityandnationaldistribution.Therefore, themeasurementsemployedneedtobeaddressed.
The WCC, basedon the variablestested andvalidated by Moreiraetal.(2013)forWiCS,hasagoodrecordwithrespect toreliabilityof itsmeasurements.The authorsindicatethat it is arobustconstruct,albeitanewone,andithassatisfactory measurements associated withfactorloadingsof itsvariables andwithCronbach’sAlphasofitsfactors.Butwhatcanbesaid inrelationtothemeasurementsforIS?
Thereisacharacteristicthatdissociatestheconstitutivelogic oftheWiCSandISscales:theirapplicabilitytotheanalysisof serviceactivities.WhiletheWiCSscaleisbuiltonthebasisof theinteractionallogicofservicesandseekstoconsidertheroles of providersandcustomers,theIS scaleisderivedfrom PIN-TEC measurements(IBGE,2010)that,inturn,aredeveloped fromtheOsloManual(OECD&Eurostat,2005).Thus,theIS scaleresultsfromasubsetofindicatorstypicallydevelopedfor industrialsectors.
The discussion about the limits toapply the OsloManual indicators–traditionalinnovationindicators–toservice activ-itiesisnotnew.IntheirsurveyoninnovationinItalianservice companies,EvangelistaandSirilli(1998,p.253)recognizethe valueofmeasurementsfromtheindustrialsectors,andthat“the accumulatedexperience inmeasuringinnovation inindustrial sectors isanexcellentstartingpointtomeasureinnovationin services”, but stressed the limitations to their application. In particular,theauthorswarnaboutthechallengesinmeasuring researchanddevelopmentactivitiesinservices,considered tra-ditionalinnovation indicatorsinindustrial sectors,alongwith patentregistrationanddatafromscientificpublicationsand cita-tions,whichindicatedisseminationofknowledge(Smith,2005). In line withtheseauthors,Kanerva,Hollanders, andArundel (2006) indicate thepartial appropriateness of indicatorsfrom the manufacturingindustriestomeasureinnovationinservice activities.
A detailed analysis of the PINTEC innovation indicators reveals the limitsof their application to services.Eight main sets ofindicatorsaredescribed:Innovativeactivities,Funding sourcesforinnovativeactivities,InternalR&Dactivities,Impact ofinnovations,Informationsources,Cooperationforinnovation, Government support and Patents and other protection meth-ods.Inthegroupofinnovativeactivities,theimportancegiven to industrial design, introduction of innovations in the mar-ket, internal andexternal R&D, training andprocurement of machineryandequipment,softwareandexternalknowledgeare measured.GiventhelimitationsofconsideringR&Dactivitiesin servicesandtheobviouslimitsassociatedwithconsiderationof industrialprojects,whatremainsformeasurementsinservicesis limitedtoprocurementofmachineryandequipment,software and externalknowledge, training andintroduction of techno-logicalinnovationsinthemarket.Inpracticalterms,thismeans consideringinnovativeactivitiesthatdonottakeintoaccountthe relationalnatureofservices.Asimilaranalysiscouldbemade regardingtheothersevensetsofindicators.
Giventhelimitsofapplicationofindustrialindicatorstothe analysis ofinnovationinservices,whatisobservedinthe lit-erature is the decision to adopt indicators that are presumed applicable andextendthem tothe sector.That was the logic used toselect the variablesassociated withthe ISscale used
Table2
ANOVAbetweenWCCandFederationUnits.
Between-subjectsfactors
Valuelabel N
Unitsfederation 2.00 North/Northeast 41
3.00 Center-West 27
4.00 Southeast 195
5.00 South 85
Descriptivestatistics Dependentvariable:WiCSNEW
Units federation Mean Std.deviation N
North/Northeast 176.1463 18.59914 41
Center-West 182.9259 21.27101 27
Southeast 172.7282 27.10295 195
South 172.9294 22.65570 85
Total 173.9713 24.83233 348
Source TypeIIIsumofsquares df Meansquare F Sig. Partialetasquared Noncent.Parameter
CorrectedModel 2752.567a 3 917.522 1.494 0.216 0.013 4.483 Intercept 6,341,202.664 1 6,341,202.664 10,327.342 0.000 0.968 10,327.342 States 2752.567 3 917.522 1.494 0.216 0.013 4.483 Error 211,223.145 344 614.021 Total 10,746,544.000 348 Correctedtotal 213,975.713 347 Estimates
Dependentvariable:PMSNOVO
Unitsfederation Mean Std.error 95%confidenceinterval
Lowerbound Upperbound
North/Northeast 176.146 3.870 168.535 183.758
Center-West 182.926 4.769 173.546 192.306
Southeast 172.728 1.774 169.238 176.218
South 172.929 2.688 167.643 178.216
Pairwisecomparisons Dependentvariable:WiCSNEW
(I)Unitsfederation (J)Unitsfederation Meandifference(I−J) Std.error Sig.a 95%confidenceintervalfordifferencea
Lowerbound Upperbound
North/Northeast Center-West −6.78 6.141 1 −23.077 9.517 Southeast 3.418 4.257 1 −7.879 14.715 South 3.217 4.712 1 −9.286 15.72 Center-West Southeast 10.198 5.088 0.275 −3.304 23.7 South 9.997 5.474 0.412 −4.529 24.522 Southeast South −0.201 3.221 1 −8.748 8.345
Source:Researchdata.
Basedonestimatedmarginalmeans.
a Adjustmentformultiplecomparisons:Bonferroni.
in this study. This option, the only current option to mea-sureinnovationinservices,facestwoproblems:first,itentails workingwithareducednumberofindicators,whichlimitsthe measurementof the phenomenon, andsecond, it implies not measuringaspectsoftherelationalperspective,whichtypifies
theservices.Whilethefirstproblemleadstoreducedmeasures, thesecondresultsinmethodologicalinconsistency.Ifthe rela-tionalperspectiveisthemainelementinthecreationofservices andprovidestherationaleforthem,istherereallya measure-ment of innovation in services when this perspective is not
includedintheindicators?Theresultsindicatethattheansweris negative.
Despitethe limitationsof applyingindustrial indicators to measurementsofinnovationinservices,itisprudenttopointout otherfactorsthatmightexplainthelackofpredictionbetween change and innovation in services. The analyses conducted in this study examined the existence of a direct relationship betweentheconstructs,whichwasnotconfirmed,butdidnot testfortheexistenceof possibleindirectrelations.Theremay beintermediatephenomenaorprocesses betweenchangeand innovationinservicesthathavenotbeenmappedyet.In addi-tion,itispossiblethatchangeinservicesisdirectlyrelatedto otherphenomenalinkedtothecustomerandtheserviceprovider, suchasqualityinservices(measuredfromtheprovider’s per-ception).Therefore,achallenge tofuturestudiesemerges, to testtheWiCSandISconstructstogetherwithotherexplanatory variables,suchascreativity,forexample.
Moreover,becauseitisaphenomenonthatoccursduringthe delivery of service, inanalytical terms, change inservices is dissociatedfrominnovation,whichcanonlybediagnosedwith theuseoftheindicatorsselectedinthisstudy,namelythrough itsactualresultsintermsoflaunchingofnewsoftwareor adop-tionofnewmarketprocesses.Thisdistinctionbetweenthetwo phenomenageneratesanotherpossibleexplanation.Changein servicescouldberelatedtootherprocessesthatdirectly mobi-lizethecustomerandtheserviceprovider–agentsofchange– butnotconsideredininnovationmeasurements.Whilechangein servicesoccursatthelocusofinteractionandisdefinedaround changes incustomers’expectations, innovation needs market validationinordertotakeplace.Thus,acrucialepistemological differenceemergesbetweentheconstructs.
Conclusions
Thisstudyaimedtoexplaintherelationshipbetween willing-nesstochangeandinnovationinservices.Theresultsshowno directpredictabilitybetweentheconstructs,acharacteristicthat remainedandwasconfirmedinsubsequenttestsperformedwith intermediatecomponentsofinnovationinservices(indexesfor newsoftwareandprocesses).Becauseitisarelationshipwidely assumedandexploredintheliterature,wesoughttoinvestigate possibleexplanationsfortheresults.
Aspossibleexplanatorydimensionsrelatedtotheseresults, wehighlighttheepistemologicalcharacteristicsassociatedwith changeinservicesandinnovation.Changeinservicesis char-acterizedasaphenomenonwithamicroscope,occurringinthe locusoftheservicerelationshipandcausingalterationsinthe provider’s and customer’sexpectations. Innovation is subject tomarket forces, whichrequiresmacro-analysis of new soft-wareandprocesses incompanies.Thus,it isunderstood that changeandinnovationcanrepresentstagesofthesameprocess inservices,althoughtheymobilizedifferentactorsandmanifest themselvesatdifferentlevelsofanalysis.
Attentionisdrawntoalimitationofthisstudy,theselection of innovation indicatorsprivileging variables associated with results andnotconsidering innovativeefforts made byfirms. This choice was made because it is impossible to measure
indicators of innovation in services with the same analytical tools used for industry. In addition, there is the exploratory nature of the study, inwhichthescaleswere appliedtoonly onesampleofrespondents.
Asaresearchagendaforfuturestudies,theperformanceof tests isindicatedtoexplain therelationshipbetween willing-nesstochangeinservicesandotherphenomenaassociatedwith customers and service providers, such as quality in services and creativity.Above all, it is necessaryto addressthe chal-lenge of building, rather thanadapting, innovation indicators genuinelycapableofmeasuringinnovationinservicesandthe phenomena associated withit andits possiblevectors.These indicators shouldtakeinto accountthe relational perspective, mobilizationofskillsandchangesinexpectationsduringservice delivery.
Conflictsofinterest
Theauthorsdeclarenoconflictsofinterest.
AppendixA. Scaleofinnovationsinsoftwareservices
Aninnovationinthesoftwareindustryoccurswhenthereis
introductionintothemarketof:
• Neworsubstantiallyimprovedsoftware
◦ Software whose fundamental characteristics (techni-cal specifications, codes, user-friendliness, functions or intendeduses)differsubstantiallyfromprevioussoftware.
• Aneworsubstantiallyimprovedprocess,methodornew
developmenttool
◦ Softwarethatexistedbefore,butwhoseperformancehas beensubstantiallyincreasedorimprovedwithsignificant improvementinitsefficiency,speed,easeofuse,etc. *Innovationcanrefertoneworsubstantiallyimprovedsoftware, method,processortoolproducedbyone’sowncompanyorby others.
1. Between 2010and2012,didyourcompanyintroduce any
neworsubstantiallyimprovedsoftwareproductsinthe mar-ket?Howmany?
• None. • 1. • Between2and3. • Between4and5. • Between6and7. • Between8and9. • Between10and15. • Between15and20. • Morethan20.
2. Indicateinapproximatepercentageterms,howmanyofthe
neworsubstantiallyimprovedsoftwareproductslaunchedby yourcompanywere:
• New for the company, but already available in Brazil. %
• Newin Brazil, butalready available inother countries. %
• Newtotheworld. %
Innovations in processes, methods and development
toolscorrespondtotheadoptionof:
• Neworsubstantiallyimprovedproductiontechnologies; • Neworsubstantiallyimprovedinterfacesorplatforms; • Neworsubstantiallyimprovedsoftwaredevelopment
pro-cesses(agileprocesses,RUP,cascade,etc.);
• New or substantially improved languages and systems usedinsoftwaredevelopment;
• Neworsubstantiallyimprovedopenframeworks(suchas PHP);
• New or substantially improved storage and processing methods(suchascloudcomputing).
*Smallandroutinechanges,suchasversionupgrades,are notincluded.
3. Between2010and2012,didyourcompanyintroduce any neworsubstantiallyimprovedprocess,method,or develop-menttoolinitsproduction?Howmany?
• None. • 1. • Between2and3. • Between4and5. • Between6and7. • Between8and9. • Between10and15. • Between16and20. • Morethan21.
4. Indicateinapproximatepercentagetermshowmanyofthe
neworsubstantiallyimprovedprocesses,methodsor devel-opmenttoolsadoptedbyyourcompanywere:
• Newtothecompanybutalreadyadoptedbyother
compa-niesinBrazil. %
• New in Brazil but already adopted in other countries. %
• Newtotheworld.
AppendixB. ResultsoffactorsadjustedforWiCS
(Moreiraetal.,2013):
AdjustedfactorstructureforWiCSinESEManalysis.
Items FactorI FactorII FactorIII
Cronbach’sAlpha 0.8 0.57 0.69 V1 0.434 −0.035 −0.294 V2 0.318 −0.225 −0.156 V3 0.527 0.273 −0.168 V4 0.056 0.349 0.205 V5 0.378 0.020 0.411 V6 0.622 −0.015 0.089 V8 0.013 0.553 0.343 V9 0.369 0.621 −0.007 V10 0.033 0.165 0.816 V11 0.244 −0.309 0.235 V12 −0.051 0.564 0.286 V13 0.651 −0.080 0.027 V14 0.119 −0.046 0.746 V15 0.876 0.018 −0.089 AppendixB(Continued)
Items FactorI FactorII FactorIII
Cronbach’sAlpha 0.8 0.57 0.69 V16 0.711 0.163 0.014 V17 −0.097 −0.091 0.575 V18 0.686 −0.113 0.195 V19 0.202 0.484 −0.120 V20 −0.544 0.002 0.414 V21 0.219 0.470 0.024 V22 0.749 −0.034 0.026 V23 0.437 0.043 −0.176 V24 −0.035 0.430 0.339 V26 0.512 0.084 0.202
Source:Researchdata.
References
Arundel,A.,Kanerva,A.,VanCruysen,A.,&Hollanders,H.(2007).Innovation statisticsfortheEuropeanservicesector.Pro-InnoEurope:InnoMetrics. Becker,W.,&Dietz,J.(2004).R&Dcooperationandinnovationactivitiesof
firms—EvidencefortheGermanmanufacturingindustry.ResearchPolicy, 33(2),209–223.
Delaunay,C.,&Gadrey,J.(1987).Lesenjeuxdelasocietédeservice.Paris: PressesdelaFondationNationaledesSciencesPolitiques.
Dooley, K.J.(2004). Complexityscience modelsof organizationalchange andinnovation.InHandbookoforganizationalchangeandinnovation.pp. 354–373.
Edwards, T. (2000). Innovation and organizational change: Developments towardsaninteractiveprocessperspective.TechnologyAnalysis&Strategic Management,12(4),445–464.
Evangelista,R.,&Sirilli,G.(1998).Innovationintheservicesector:Results from theItalianStatistical Survey. TechnologicalForecasting & Social Change,58(1),251–269.
Gadrey,J.(2000).Thecharacterizationofgoods&services:Analternative approach.ReviewofIncome&Wealth,46(3),369–387.
Gallouj,F.(2002).Innovationintheserviceeconomy:Thenewwealthofnations.
Cheltenham:EdwardElgarPublishing.
Gallouj,F.,&Savona,M.(2009).Innovationinservices:Areviewofthedebate andaresearchagenda.JournalofEvolutionaryEconomics,19(2),149–172. Gallouj,F.,&Savona,M.(2010).Towardsatheoryofinnovationinservices:A stateoftheart.InF.Gallouj,&F.Djellal(Eds.),Thehandbookof innova-tion&services:Amulti-disciplinaryperspective(pp.27–48).Cheltenham: EdwaldElgarPublishing.
Gu, P., Zhang, Y., & Kang, J. (2006). Patent and R&D resources: The input–outputanalysisofChinainnovation.JournalofIndustrialEngineering andEngineeringManagement,1,030.
Hair,J.,Anderson,R.,Tatham,R.,&Black,W.(2010).Análisemultivariada dedados.PortoAlegre:Bookman.
Hekkert,M.P.,Suurs,R.A.,Negro,S.O.,Kuhlmann,S.,&Smits,R.E.H. M.(2007).Functionsofinnovationsystems:Anewapproachforanalysing technologicalchange.TechnologicalForecastingandSocialChange,74(4),
413–432.
Hill,T.P.(1977).Ongoods&services.ReviewofIncome&Wealth,23(4),
315–338.
IBGE–InstitutoBrasileiro deGeografiae Estatística.(2010).Pesquisade inova¸cãotecnológica–2008.RiodeJaneiro:IBGE.
Jamison,A.,&Hård,M.(2003).Thestory-linesoftechnologicalchange: Inno-vation,constructionandappropriation. TechnologyAnalysis&Strategic Management,15(1),81–91.
Kanerva,M.,Hollanders,H.,&Arundel,A.(2006).Canwemeasure&compare innovationinservices?MERIT–MaastrichtEconomicResearchInstitute onInnovation&TechnologyfortheEuropeanTrendChartonInnovation. Kon,A.(2004).Economia deservi¸cos:teoriaeevolu¸cãonoBrasil.Riode
Lau, C., & Woodman, R. (1995). Understanding organizational change: Aschematicperspective. TheAcademyof ManagementJournal, 38(2),
537–554.
Miles,I.(2005).Innovationinservices.InJ.Fagerberg,D.C.Mowery,&R. Nelson(Eds.),TheOxfordhandbookofinnovation(pp.433–458).Oxford: OxfordUniversityPress.
Moreira,M.,Guimarães,T.,&Philippe,J.(2013).WillingnesstoChangein Services:Themappingofaconstruct.InProceedingsofXXIIIinternational RESERconference–Findinggrowththroughserviceactivitiesinbarren times.
Mowery,D.C.,&Rosenberg,N.(2000).Pathsofinnovation.CambridgeBooks. Nelson, R., & Winter, S. (2005). Uma teoria evolucionária da mudan¸ca
econômica.Campinas:EditoraUnicamp.
OECD–OrganisationforEconomicCo-operation&Development&Eurostat –StatisticalOfficeoftheEuropeanCommunities.(2005).OsloManual: Guidelinesforcollecting&interpretinginnovationdata.Paris:OECD Pub-lications.
Perez,C.(2002).Technologicalrevolution&financialcapital.Cheltenham: EdwardElgarPublishing.
Petit, D., Janssen, R., & Leitão, C. (2007). Exporta¸cão de software e servi¸cosdeTecnologiadaInforma¸cão–ConceitosBásicos.Florianopolis: SEBRAE/SC.
Poole,M.S.,&VandeVen,A.H.(2004).Handbookoforganizationalchange &innovation.USA:OxfordPress.
Rubalcaba,L.(2007).Thenewserviceeconomy:Challenges&policy implica-tionsforEurope.Cheltenham:EdwardElgarPublishing.
Schumpeter,J.A.(1982).Teoriadodesenvolvimentoeconômico.RiodeJaneiro: FundodeCultura.
Simioni,F.J.,Hoff,D.N.,&Binotto,E.(2015).FatoresIndutoresàInovac¸ão TecnológicadaIndústriaMadeireira daRegiãodeLages/SC.Revistade Administra¸cãoeInova¸cão–RAI,12(1),248.
Smith,K.(2005).Measuringinnovation.InJ.Fagerberg,D.C.Mowery,&R. Nelson(Eds.),TheOxfordhandbookofinnovation(pp.148–177).Oxford: OxfordUniversityPress.