M
ASTER IN
FINANCE
M
ASTERS
F
INAL
W
ORK
PROJECT
EQUITY RESEARCH
:
S
KECHERS
U.S.A.
I
NC
.
N
ICKY
S
ALGADO
M
ASTER IN
FINANCE
M
ASTERS
F
INAL
W
ORK
PROJECT
EQUITY RESEARCH
:
S
KECHERS
U.S.A.
I
NC
.
N
ICKY
S
ALGADO
S
UPERVISOR
:
Ana Venâncio
O
CTOBER
2019
i
Abstract
The elaborated work consists on an Equity Research of Skechers U.S.A. Inc. for the
end of 2019F, according to ISEG’s master’s in finance final work project. This report
was based on the assumptions that I consider to be available for the next five years
based on the historical performance of the last three years, industry’s trends and
macroeconomic projections. The entire study is done through the CFA Institute format.
The decision to evaluate Skecher’s came for personal relish and for my personal
interest to know more about the industry and trends associated. The price target was
obtained through an absolute valuation method, the Discounted cash Flow, more
specifically the Free Cash Flow to the Firm. In addition, to support our
recommendation, we performed the Adjusted Present Value method. We used a
relative valuation method, the Comparable multiples, using EV/EBITDA and
EV/SALES. A sensitivity analysis and a Monte Carlo simulation were performed to
complement the analysis. Our final recommendation for Skechers U.S.A. Inc. is to
STRONG BUY, with a price target of 43.38 dollars per share, representing an upside
potential of 27.01%, in comparison with the closing price of 31.66 dollars per share in
August 30
st, 2019. Our risk assessment estimates a medium risk for the company. For
this recommendation, we consider that the mains risks are related to perpetual growth
rate, tax rate, risk-free rate and market risk premium.
Keywords: Skechers USA, Inc.; Equity Research; Valuation; Discounted Cash Flow
method; Free Cash Flow to the Firm; Adjusted Present Value; Relative Valuation
method; Footwear Industry; Internationalization.
ii
Resumo
O trabalho elaborado consiste numa avaliação do preço por ação da Skechers U.S.A.
Inc. para o final de 2019FY, de acordo com o projeto final do Mestrado em Finanças
do ISEG. Este relatório tem por base pressupostos que considero futuramente viáveis
para os próximos cinco anos de atividade e que baseiam no histórico da performance
dos últimos três anos, das tendências da indústria e de projeções macroeconómicas.
Todo o estudo é feito através do formato CFA Institute. A decisão de avaliar a empresa
adveio do gosto pessoal e do interesse associado à indústria e às tendências
associadas. O preço-alvo foi obtido através de um método de avaliação absoluto do
Discounted Cash Flow, especificamente Free Cash Flow to the Firm. Adicionalmente,
para complementar a nossa recomendação, foi utilizado o método do Adjusted
Present Value. Foi utlizado o método de avaliação relativa, o método dos Múltiplos
Comparáveis, foram usados o EV/EBITDA e o EV/SALES. A análise de sensibilidade
e uma simulação de Monte Carlo foi realizada para complementar a análise. A
recomendação final para a Skechers U.S.A. Inc é de STRONG BUY, com um preço
alvo de 43.38 dólares por ação, representando um potencial de valorização de
27.01%, face ao valor atual de 31.66 dólares por ação no dia 30 de Agosto de 2019.
A nossa avaliação de risco estima um risco médio para a empresa. Para esta
recomendação, considero que os principais riscos vão para a taxa de crescimento
perpétua, a taxa de imposto, a taxa de retorno sem risco e para o prémio de risco de
mercado.
Palavras-Chave: Skechers USA, Inc.; Equity Research; Avaliação de Empresas;
Discounted Cash Flow method; Free Cash Flow to the Firm; Relative Valuation
method; Indústria do Calçado; Internacionalização.
iii
Acknowledgements
Since this project represent the end of a long and hard journey, this space will be used
to thank all those who directly or indirectly help me to complete the final master’s thesis
and who support me throughout my academic journey.
A first mention of gratefulness to my tutor, Professor Ana Venâncio for the time and
patience during the realization of this project.
Second, to my friends for the flexibility and for all of the amazing moments during this
long journey.
Finally, the biggest thank to my parents and my sister: António Salgado, Esmeraldina
Salgado and Kelly Salgado, for all of the support and flexibility.
iv
Index
Abstract
i
Acknowledgements
iii
Index
iv
List of Figures
v
List of Tables
vi
SKECHERS U.S.A. Inc.
1
1. Research Snapshot 1
2. Business Description 2
Company strategy 3
Management and Corporate Governance 4
Society Responsibility 5
Historical Financial Analysis 6
3. Core Countries Outlook 10
Global Economic Outlook 10
US Economic Outlook 10
European Union 10
Canada Economic Outlook 10
China Economic Outlook 11
India Economic Outlook 11
Japan Economic Outlook 12
4. Industry Overview 12
Main competitors and Peer Group 14
Competitive Position: 16
5. Investment Summary 17
6. Valuation 18
Valuation Methodology 18
Key Valuation Drivers 18
Discounted Cash Flow Valuation 21
Adjusted Present Value 22
Market Multiples Approach 23
Financial Statements Forecast Analysis 24
7. Investment Risks 25
Economic and Market Risks 25
Political and Regulatory Risk 26
Operational Risks 26
Risk to Price Target 27
Sensitivity Analysis 27
Appendices
29
Abbreviations
40
v
List of Figures
Figure 1: Historical Share Price 1
Figure 2: Skecher’s logo 2
Figure 3: Institutional Ownership 4
Figure 4: BOBS for Dogs from Skechers logo 5
Figure 5: BOBS for Dogs from Skechers logo 5
Figure 6: Proportion of sales by region 2016-2018 (in percentage) 7
Figure 7: Proportion of sales by distribution channel 2018 (in percentage) 7
Figure 8: Historical Operating Income ($M) 7
Figure 9: Historical Revenue, Cost of Revenue and Gross Profit ($M) 7
Figure 10: Historical Selling, General & Admin, Selling & Marketing and General & Administrative ($M) 8
Figure 11: Historical Net Income ($M) 8
Figure 12: Historical Capital Expenditure ($M) 9
Figure 13: Historical Total Liabilities, Other Non-current Liabilities and Accrued Expenses ($M) 9
Figure 14: World’s GDP Growth (%) 10
Figure 15: World vs US: real GDP growth (%) 10
Figure 16: World vs US: Inflation rate and Unemployment rate (%) 10
Figure 17: European Union: Inflation rate (%) 11
Figure 18: Canada: Inflation rate (%) 11
Figure 19: China- Share of Each Sector in Household Total Consumption by Segment in China 2019 (%) 12
Figure 20: Retail Ecommerce Sales Growth Worldwide, by Region 2019 (% change) 12
Figure 21: Retail Ecommerce Sales Worldwide ($T) 13
Figure 22: Historical and Forecasted Female Participation at Olympic Games 13
Figure 23: Puma logo 14
Figure 24: Puma Sales by segment 2018 14
Figure 25: Adidas logo 14
Figure 26: Nike logo 15
Figure 27: Nike Sales by segment 2018 15
Figure 28: Under Amour logo 15
Figure 29: Under Amour Sales by region 2018 (%) 16
Figure 30: Porter’s 5 forces 16
Figure 31: Forecasted Gross Margin, EBITDA Margin and Net Profit Margin (%) 17
Figure 32: Monte Carlo Price Simulation Distribution 18
Figure 33: Forecasted Total Revenue ($M) 19
Figure 34: Forecasted Operating Expenses, Selling & Marketing, General & Administrative ($M) 20
Figure 35: Forecasted Sales by region ($M) 24
Figure 36: ROA and ROE Forecasted (%) 24
Figure 37: Risk Matrix 25
Figure 38: Monte Carlo Statistics 28
vi
List of Tables
Table 1: Analyst’s Risk Assessment 1
Table 2: Investment Grade and Risk Classification Matrix 1
Table 3: Market Profile 1
Table 4: Skecher’s Governance 4
Table 5: Historical Sales by region ($M) 7
Table 6: Historical Sales by distribution channel 7
Table 7: Historical Working Capital and Net Working Capital ($M) 9
Table 8: India- Share of Each Sector in Household Total Consumption by Segment in China 2019 (%) 11
Table 9: Adidas Sales by segment 2018 (%) 14
Table 10: Valuation Summary 17
Table 11: Historical revenue by region ($M) 19
Table 12: Historical and Forecasted revenue by region ($M) 19
Table 13: Historical and Forecasted revenue by region ($M) 20
Table 14: Historical and Forecasted PP&E ($M) 21
Table 15: Market Risk Premium assumption (%) 21
Table 16: Cost of Debt assumption 21
Table 17: Growth Rate assumption 22
Table 18: Free Cash Flow Calculation ($M) 22
Table 19: Price Target FCFF 22
Table 20: Price Target APV 22
Table 21: Interest Tax Shield Calculation ($M) 23
Table 22: Price Target EV/EBITDA method 23
Table 23: Peers Multiples 23
Table 24: Price Target EV/SALES method 23
1
SKECHERS U.S.A. Inc.
(YE 2019 Price target of $43.38; 27.01% Upside Potential; Medium Risk; Financial Recommendation: STRONG BUY)
Skechers U.S.A. Inc. (SKX) is headquartered in Manhattan, California, and it is listed on The New York Stock Exchange (NYSE: SKX). The company is organized into three big geographic markets: United States (US), Canada and Other international. The company performed strong investments over the last years to penetrate new markets, and expands its markets share internationally.
Our recommendation for SKX, using the Free Cash Flow to the Firm (FCFF) and taking into consideration our risk assessment, stands for STRONG BUY,with a price target of $43.38 per share, representing an upside potential of 27.01% in comparison with the closing price of $31.66 on August 30st, 2019. Using the relative
valuation through the multiples, our STRONG BUY recommendation is supported, with a price target of $62.21, representing an upside potential of 49.11%. According to the risk assessment, we concluded that SKX had a medium risk of investment, due to the fact that the company operates into a highly competitive industry. For the next years we expected and increase in sales, from $5 013.4 millions in 2019F to $6 820.7 millions in 2023F, representing a CAGR of 8%. We predict that EBIT/Sales will remain constant over the years, with a value around 10%. We expect an increase in net income from $361.2 millions to $486.0 millions, due to an increase in revenues and also a constant percentage of cost of goods sold over sales.
1.
Research Snapshot
Low Medium High
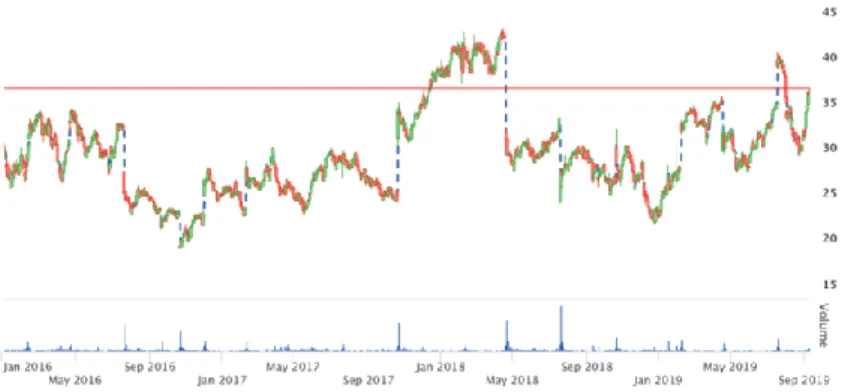
Low risk Medium Risk High Risk Strong Buy >20% >30% >45% Buy >10% & >20% >15% & <=30% >20% & <=45% Neutral >0% <=10% >5% & <=15% >10% & <=20% Reduce <=-10% & 0% >-5% & <=15% > 0% & <=10% Sell <=-10% <-5% <0% Market Profile Ticker Bloomberg SKX Shares outstanding (M) 150 Open price $31.64 Close price $31.66 52-wk High $40.50 52-wk Low $21.45 Market capitalization (B) $5.756
Skechers
U.S.A. Inc.
STRONG BUY
Medium risk
October 2019Portugal
Figure 1: Historical Share Price
Table 1: Analyst’s Risk Assessment
Source: Author
Table 2: Investment Grade and Risk Classification Matrix
Source: BPI Rating Scheme
Source: Bloomberg, Author Table 3: Market Profile Source: Author; Company Data
2
SKX was founded in 1992 and is headquartered in Manhattan Beach, California. SKX’s a global footwear and apparel brand. The company designs develop and markets more than 3,000 lifestyle and athletic footwear styles. SKX offers to the consumers a stylish and comfortable footwear that satisfies the consumers active, casual, dress casual and athletic footwear needs. In the US, the company owns and manage 113 concept stores, 170 factory outlet stores and 187 warehouse outlet stores. In the rest of the word, the company owns and manage 134 concept stores, 78 factory outlet stores and 10 warehouse outlet stores. SKX have approximately 12,600 employees. The company reputation is due to style, quality, comfort, innovation, and affordability.
SKX revenue is divided into athletic shoes (including international wholesale, direct subsidiary and distributors), retail, domestic wholesale and e-commerce. SKX sales are also measure by geography: other international, United States and Canada.
Skechers Lines include footwear lines designed for men, women and children. Sales and costs not specified by product. Skechers Lines are divided by Lifestyle Brands, Performance Brands, Skechers Kids and Skechers Work. Lifestyle Brands includes Skechers USA, Skechers Sport, Skechers Active and Skechers Sport Active, Skecher Street, BOBS from Skechers and Mark Nason. Performance Brands focus on technical footwear with the goal of maximizing performance and promote natural motion. Skechers GOrun, Skechers Gowalk, Skechers Gotrain, Skechers Gotrail, Skechers Go Golf and YOU by SkechersTM are included on Skechers Performance
section. Skechers Kids line includes Skechers Kids, Skechers athletic-inspired sneakers, Twinkle Toes and Lighted footwear. Skechers Work line offers a line of men’s and women’s casuals, hikers and athletic shoes.
Distribution Channels are divided into three segments: domestic wholesale, international wholesales, and retail sales, including e-commerce sales. SKX’s have 19 different products lines and are available in more than 170 countries. The SKX’s distribution of footwear is made through the following domestic channels: department stores, specialty stores, athletic specialty shoe stores, independent retailers and internet retailers. Is a defined for each distribution channel, growth strategies and personalized service to the customers.
Retail stores and e-commerce are made through concept stores, factory outlet stores and warehouse outlet stores. Skechers strategies is to open 70 to 80 new stores in 2019F around of the world. E-commerce business is available in the US, Canada, United Kingdom, Germany, Spain, Chile and China.
2.
Business Description
Figure 2: Skecher’s logo
Source: Author, Company data
3 International Wholesale is one of the SKX’s source to generate revenue outside
the US. It is done through the following main source: direct sales to department stores and retail stores through the joint ventures in Asia and the Middle East, as well as through the subsidiaries in the America, Europe and Japan; sales to foreign distributors across Asia, South America, Africa, the Middle East and Australia. Distributors and Licensees
Footwear is distributed through athletic department stores and specialty stores through 22 distributors, which is not sold directly through international subsidiaries and joint ventures. In 2018, SKX had 48 licenses considering 700 distributed-owned and 1,813 licensee-owned SKX retail stores.
Company strategy
Reinvestment to increase operational capabilities, high-return investments in the current markets/partnerships, and in new and adjacent markets and shareholders direct return, are the strategic brand objectives.
Product for specific segments is SKX’s principal goal by constantly renewing and innovating its footwear SKX’s lines. Footwear SKX’S targets to market segment’s 4 targets: between 5 to 50 years old consumer, infants and toddlers, and professionals and recreational athletes. A young, comfort and stylish footwear is directed to consumer between 12 to 24 years old. A broader style encompasses the age between 5 to 50 years. SKX’s has an exclusive section for infants and toddlers. Footwear for professionals and recreational athletes are the technical fitness shoes. One of the strategies of the company is to continue to recognize the trends in the footwear industry beforehand and to design them before their competitors through product differentiated style and quality, and at the same time the latest fashion trends. Regarding the product, the company wants to focus on innovation, technology, design and also develop a unique collection for children.
Pricing strategy: the company offers products with quality at affordable prices competitors, such as Adidas’s AG and Nike Inc. For the same type of products SKX’s sneakers are lower than Adidas’s AG and Nike Inc.
Advertising and Marketing Strategy: the marketing philosophy is “Unseen, Untold, Unsold”. SKX intends to improve the marketing approach: social media and promotions. In order to influence consumer purchases SKX intends to sign more contracts with celebrities. In order to inspire consumers to make a purchase, through athletes such as: Sugar Ray Leonard, Howie Long, David Ortiz and Tony Romo; actor Rob Lowe; television personalities Brooke Burke-Charvet and Kelly
4
Brook; and global singers Meghan Trainor and Camila Cabello. In the future, SKX’s wants to increase this type of contracts for Asia region.
Geographical diversification: SKX pretends to continue with their internationalization process, by increasing the company’s market share in China, Japan, India and Europe. In other words, the company intends to sell their footwear to foreign distributors and opening retail stores. The globalizations and global consumers allow the brand to expand their geographic segments and increase their sales. The company improved their supply chain, their distribution and also open and operate new stores, in regions that they currently have few or no stores.
Costs: SKX intends to minimize cost per sale and maximize profit margins.
Intellectual Proprieties Rights: The company pretends to increase the number of patents and trademarks in order to protect its valuable intellectual property. SKX has trademark registrations and trademark applications in approximately 139 foreign countries. For design patents, pending designs and utility patent applications the company have approximately 21 in foreign countries.
Management and Corporate Governance
Skechers governance system is operated through an Anglo-Saxon Model which is based in a board of directors, compensation committee, executive committee, corporate governance committee and audit committee.
The committee members meet the independence requirements and other eligibility requirements imposed by the listing standards of the NYSE: SKX. SKX has become public on June 9st, 1999 at an initial public offering (IPO) of $11 per share. The
company does not currently pay any dividend. At the end of June 2019, institutional investors purchased a net $715 thousand shares of SKX, and now own 92.11% of the total float. The institutional ownership is owned 52.86% by Mutual fund holders, 39.26% by other institutional and 2.11% by individual stakeholders (see figure 3). At the beginning of the year (2019), SKX have 88 holders of record of Class A Common Stock (with an undetermined number of beneficial owners) and 36 holders of record of Class B Common Stocks (is not publicly traded). The SKX’S Class B Common Stocks is convertible into one share of Class A Common Stocks. According to SKX Share Repurchase Program, in 2018 the repurchase price cannot exceed to $150 millions with a par value $0.001 per share. The difference between the two classes of common stock is the voting rights, Class A Common Stocks have the right of one vote per share though holders of Class B Common Stocks have the right of ten votes per share. According to SKX annual report (2018), in February 15, 2019 the company had 133,460,317 of shares of Class A Common Stock and 23,983,312 of shares of Class B Common Stock.
Board
Members Audit Compensation
Nominating and Governance Robert Greenberg Michael Greenberg David Weinberg Jeffrey Greenberg Katherine Blair Morton Erlich Geyer Kosinski Richard Rappaport Richard Siskind Thomas Walsh 56% 42% 2%
Mutual Fund Holders Other Institutional Individual Stakeholders Figure 3: Institutional Ownership
Source: Author; Company data Table 4: Skecher’s Governance
5
The Executive Management team is composed by four members: Robert Greenberg, Michael Greenberg, David Weinberg and John Vandermore.
Robert Greenberg is the Chairman of the Board and Chief Executive Officer (CEO) of the company since October 1993. He was the Chairman of the Board and President of L.A Gear, Inc, an apparel and casual footwear company from 1979 to 1992.
Michael Greenberg was the National Sales Manager of L.A. Gear Inc. for the West Coast from 1989 to 1992. Since 1993, Mr. Michael Greenberg is the SKX’s director. Since July 1998, David Weinberg has been a member of board of directors and since January 2016, he has served as Chief Operating Officer (COO) of the Company.
In 2017, John Vandermore was appointed the Chief Financial Officer (CFO). Before in 2004, Mr.Vandermore was the CFO at Walt Disney Imagineering .
The SKX’s Board of Directors are composed by ten members Robert Greenberg, Michael Greenberg, David Weinberg, Jefferey Greenberg, Katherine Blair, Morton Erlich, Geyer Kosinski, Richard Rappaport, Richard Siskind and Thomas Walsh. Jeffrey Greenberg was previously the Senior Vice President at Active Electronic Media of the company. Since 2000, he is a member of Board of Directors.
Katherine Blair is member of SKX’s Board of Directors. Previously, she was lawyer over 20 years, specialized in corporate and transactional matters as well as mergers and acquisitions.
Morton Erlich worked for 34 years at KPMG LLP and 24 years as an audit partner in the same company. Recently, Mr. Erlich is member of SKX’s board of directors since January 2006.
Geyer Kosinski was Chairman and CEO of Media Talent Group. Nowadays, Mr. Kosinski is a member of the Board of Directors of the company.
Since May 1999, Richard Rappaport has been the CEO of WestPark Capital. He is a member of SKX’s Board of Directors since September 2010.
Richard Siskind, in 1991, founded R. Siskind & Company. Since 1999, he is a SKX’s member of the board of directors.
The Audit Committee has the purpose to assist the Board of Directors. It is composed by Morton Erlich, Geyer Kosinski and Richard Siskind. The Compensation Committee includes the following “non-employee directors”: Richard Siskind, Morton Erlich and Thomas Walsh. The purpose of Compensation Committee is to produce reports of the executive compensation and supervise the SKX’s executive compensation plans. The Nominating and Governance Committee reviews and proposes changes in the Board of Directors, and it is composed by the following directors: Thomas Walsh, Morton Erlich and Richard Siskind.
Society Responsibility
“94%
Of Skechers-branded shoeboxes are fully recyclable”
“85%
Reduction on the plastic used in footwear packaging. The remaining plastic is 100%
recyclable”
“100%
Of the packaging materials are printed with soy-or
water-based”
“99% Of Skechers-branded footwear is packaged in shoeboxes that meet the
FSCR standard for responsible sources” Source: Company data Source: Company data
Source: Company data Source: Company data
Source: Company data Figure 5: BOBS for Dogs from Skechers logo Figure 4: BOBS for Dogs from Skechers logo
6
SKX’s aware that sustainability and charity are crucial for the company strategy. In 2015, BOBS from Skechers, a partnership with the Petco Foundation donated 3.9 million dollars to Best Friends Animals Society, saving the lives of more than 241.000 animals. In addition, Skechers donates children’s shoes to various US institutions, such as Delivering Good. In 2018, SKX donated more than 395,000 pairs of shoes through the BOBS program. Skechers Foundation donates funds to more than 50 charities. The foundation’s main objective is to help family’s trough job training, fitness and nutrition, scholarship programs and educational opportunities. Skechers Pier to Pier Friendship Walk program is the country’s largest for children with special needs and education. Since its inception they have raised more than $11 million.
SKX has received from the U.S Green Building Council the LEED-Gold certified facility. The U.S Green Building Council is a program for buildings and green communities around the world. Its main goal through LEED is to use resources for a sustainable future. All of the four SKX’s buildings have been designed to receive LEED Gold certification upon completion, thus showing that the company remains focused on the incorporation of an environmentally friendly philosophy. The company also focus on improvement/reduce waste and water resources.
Historical Financial Analysis
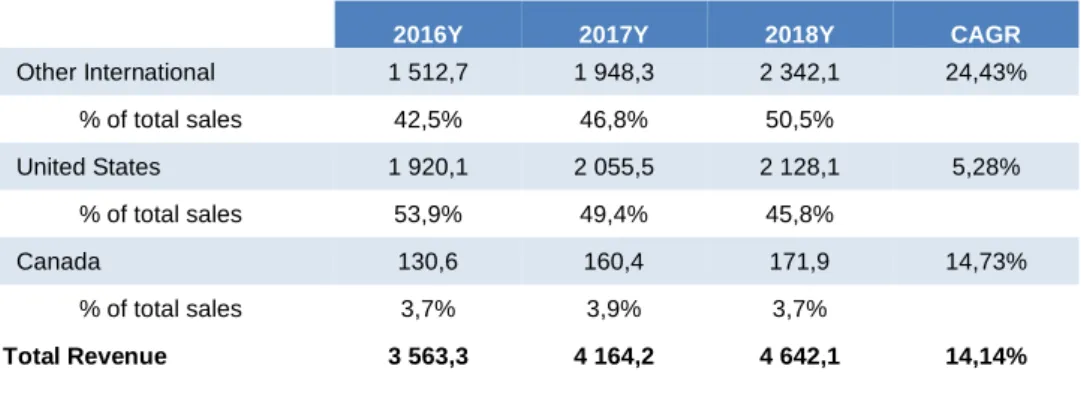
As previously mentioned, SKX’s revenue is divided into athletic shoes (including international wholesale, direct subsidiary and distributors), retail, domestic wholesale and e-commerce. Or, measured by geography: other international, United States and Canada. In the last years, total revenue increased from $3 563.3 millions in 2016Y to $ 4 642.1 million in 2018Y. This represents a CAGR of 14.14%. The main region that generates sales is other international market. Between 2016Y and 2018Y, the market share of other international markets has increased (see figure 6), from 42.5% to 50.5%. In 2016Y, the US accounted for the majority of market share with 53.9% and in 2018Y did not exceed 45.8%. The US sales increased from 2016Y to 2018Y ($1920.1 million to $2128.1 million). SKX has headquarter in Canada, between 2016Y to 2018Y its market share remains constant at 4%. However, in term of sales volume, the US and Canada have not decreased (see table 5).
“As the third largest worldwide athletic lifestyle footwear brand I’m proud of the ongoing efforts we are making to reduce our footprint as we’ve increased our
global presence”- Michael Greenberg, president of Skechers, September 2019 42% 47% 50% 54% 49% 46% 04% 04% 04% 2016 2017 2018 Other International United States Canada
Source: Company data
Source: Author; Bloomberg source
Figure 6: Proportion of sales by region 2016-2018 (in percentage)
7
2016Y 2017Y 2018Y CAGR
Other International 1 512,7 1 948,3 2 342,1 24,43% % of total sales 42,5% 46,8% 50,5% United States 1 920,1 2 055,5 2 128,1 5,28% % of total sales 53,9% 49,4% 45,8% Canada 130,6 160,4 171,9 14,73% % of total sales 3,7% 3,9% 3,7% Total Revenue 3 563,3 4 164,2 4 642,1 14,14%
The main distribution channel is International Wholesale, this segment generates revenues (see figure 7). In 2018Y, generates $ 2054.8 millions (+ 6.1% then the previous year). Retail segment and domestic wholesales, in 2018Y, generated $1 327.7 and $1 259.6 million, respectively. In 2018Y, the international wholesale accounted for 44.3% of the revenue whereby 37.1% to direct subsidiary and only 7.2% from distributors. 28.6% of the revenue was for retail and 27.1% was for domestic wholesale. Between 2017Y to 2018Y, the international wholesale grew by 18.80%, direct subsidiary grew 23%, distributors grew 0.80%, retail grew 12% and the domestic wholesale grow 7.70% (see table 6).
2016Y 2017Y 2018Y
International Wholesale 1 391,2 39,0% 1 729,9 41,5% 2 054,8 44,3% Direct Subsidiary 1 090,0 30,6% 1 399,0 33,6% 1 722,0 37,1% Distributors 303,2 8,5% 330,6 7,9% 333,3 7,2% Retail 972,2 27,3% 1 185,0 28,5% 1 327,7 28,6% Domestic Wholesale 1 199,8 33,7% 1 249,3 30,0% 1 259,6 27,1% E-commerce − − − Athletic Shoes 3 563,3 100% 4 164,2 100% 4 642,1 100%
Regarding gross profit margin, it increases in period between 2016Y to 2018Y. In 2016Y, the gross profit margin equaled 45.87% of the sales and in 2018Y increase to 47.90% of sales ($1 634,6 million in 2016Y to $2 2418,5 million in 2018Y). This trend is explained by the increase of sales and by the reduction of the cost of sales.
44% 29% 27% International Wholesale Retail Domestic Wholesale 3,563 4,164 4,642 1,929 2,225 2,418 1,635 1,939 2,224 00 500 1,000 1,500 2,000 2,500 3,000 3,500 4,000 4,500 5,000 2016 2017 2018 Revenue Cost of Revenue Gross Profit 371 383 438 2016 2017 2018
Source: Bloomberg source Figure 7: Proportion of sales by distribution channel 2018 (in percentage)
Source: Author; Bloomberg source Table 5: Historical Sales by region ($M)
Source: Author; Bloomberg source
Table 6: Historical Sales by distribution channel ($M)
Source: Author; Bloomberg source Figure 9: Historical Revenue, Cost of Revenue and Gross Profit ($M)
Source: Bloomberg source Figure 8: Historical Operating Income ($M)
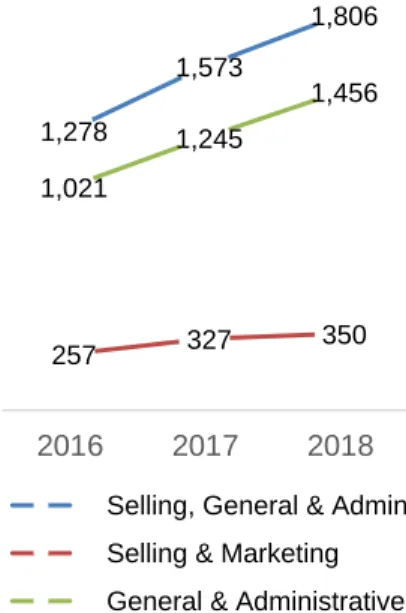
8 General and administrative expenses increased by 42.63% ($1 020,8 million in
2016Y to $1 456 million in 2018Y). General and administrative expenses accounted for 31.37% and 28.65% of sales, in 2018Y and 2016Y respectively. This increase was primarily related to the growing international operating in China and Japan. The other operational cost includes selling & marketing and selling expenses. Selling & marketing increased between 2016Y and 2018Y from $257.1 million to $350.4 million, representing 31.4% of sales. The increase in selling expenses, are due primarily the result of the higher adverting of $17.6 million, and an increase in sales commissions (see figure 10).
Operating income increased from $370,5 million in 2016Y to $437,8 millions in 2018Y. As a percentage of sales, EBIT remained constant at 10% (see figure 8). On December 2017, the U.S. government authorized comprehensive tax legislation commonly referred to as the Tax Cuts and Jobs Act. This legislation reduces the corporate tax rate from 35% to 21%. Due to this, SKX’s effective income tax rate and income tax expense could have a significant impact on the domestic and foreign earnings. SKX have operations in the non- US jurisdictions, the statutory rate is lower than U.S. ranging from 0% to 34%. According to historical data, SKX’s effective tax rate for 2018, 2017 and 2016 was 14%, 38.8% and 20.06%, respectively.
For the reasons mentioned above, net income had been increased from $243.5 million in 2016 to $301.3 million in 2018 (see figure 11).
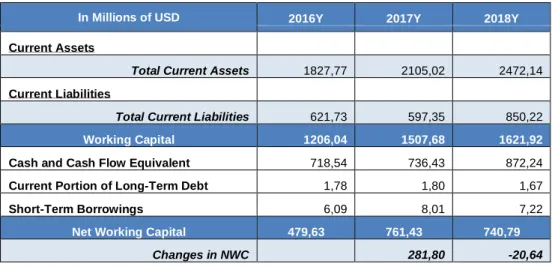
SKX working capital had also increasing between 2016Y to 2018Y (sse table 7). This increase is mainly explained by the increase in total current assets ($1827.77 millions in 2016Y to $2472.14 millions in 2018Y) in relation to the total current liabilities ($621.73 millions in 2016Y to $850.22 millions in 2018Y). SKX net working capital (NWC) had increased from $479.63 million in 2016 to $740.79 million in 2018, due to an increase in cash and cash flow equivalent ($718. millions in 2017Y to $872.2 millions in 2018Y).
1,278 1,573 1,806 257 327 350 1,021 1,245 1,456 2016 2017 2018
Selling, General & Admin Selling & Marketing General & Administrative
243 179 301 00 50 100 150 200 250 300 350 2016 2017 2018
Source: Author; Bloomberg source Figure 10: Historical Selling, General & Admin, Selling & Marketing and General & Administrative ($M)
9
In Millions of USD 2016Y 2017Y 2018Y
Current Assets
Total Current Assets 1827,77 2105,02 2472,14
Current Liabilities
Total Current Liabilities 621,73 597,35 850,22
Working Capital 1206,04 1507,68 1621,92
Cash and Cash Flow Equivalent 718,54 736,43 872,24
Current Portion of Long-Term Debt 1,78 1,80 1,67
Short-Term Borrowings 6,09 8,01 7,22
Net Working Capital 479,63 761,43 740,79
Changes in NWC 281,80 -20,64
The investing activities increased 2016Y and 2018Y from ($145.6 million to $319.4 million) was due to an increase in capital expenditure (see figure 12). In 2018Y Capital Expenditures were approximately $143.0 million and for 2016Y capital expenditures was $136.0 million. This increase is primarily due to increase of the number of retail shops and remodeling, such as in China, supported by the international wholesale operations and to domestic distribution center.
Total liabilities (see figure 13) increase significantly between 2016Y and 2018Y from ($708.2 millions in 2016Y to $1 039.0 millions in 2018Y) due to an increase in other non-current liabilities ($18,9 millions in 2016Y to $100.2 millions in 2018Y), and in the other hand, an increase in accrued expenses ($93.4 million in 2016Y to $161.8 million in 2018Y). - 119 - 136 - 143 - 145 - 140 - 135 - 130 - 125 - 120 - 115 - 110 - 105 2016 2017 2018
Source: Author; Bloomberg source Figure 12: Historical Capital Expenditure ($M)
Source: Author; Bloomberg source
Table 7: Historical Working Capital and Net Working Capital ($M)
Figure 13: Historical Total Liabilities, Other Non-current Liabilities and Accrued Expenses ($M) 00 500 1,000 1,500 2016 2017 2018 Total Liabilities Other Noncurrent Liabilities Accrued Expenses
10 Global Economic Outlook
In this section, we will review briefly the macro-economic setting where the company operates. SKX sales are divided into the following geographies: the US, Canada and other International markets. The company will continue its internationalization process, across all the world with a strong focus more in the Asia region. From 2016Y to 2018Y, the World Gross Domestic Product (GDP) increased from 3.4% to 3.6% (see figure 14). Nevertheless, in 2019, the International Monetary Funds (IMF, 2019) expected a decrease to in world GDP at 3.3%. Then, it is expected to increase and remain constant from 2020F until 2023F at 3.6%. Regarding the inflation rate, it is expected to remain constant from 2018Y until 2020F at 3.6%. After 2021F it is expected to decrease to 3.5% and reduce further to 3.4% in 2013F.
US Economic Outlook
The US is one of the main regions where company operates. The real GDP growth rate increased from 1.6% to 2.9% between 2016Y to 2018Y (see figure 15). According to IMF (2019), the country expects an economic slowdown between 2019F to 2023F from 2.3% to 1.6%. The inflation rate has been inconstant in the past years, and it is predicted to increase between 2019F to 2020F from 2% to 2.7% (see figure 16). Afterwards, it is predicted a decrease in 2021F (2.3%), and after than it is predicted to remain constant until 2023F (2.2%). Following the 2008 economic crisis, the employment has improved. According to IMF (2019), unemployment rate seems to follow the same upward trend along of the years, it is expected to shift slowly between 2019F to 2023F from 3.8% to 4%.
The U.S population is growing steadily every year. Between 2016Y to 2017Y, the U.S population grew by 0.7% percent.
For all the above, the U.S economic outlook for the next years is in favor to SKX business.
European Union
The Euro is the second largest reserve currency as well the second most traded currency in the world after dollar. According to IMF (2019), real GDP growth will decline between 2018Y to 2019F from 2.1% to 1.6%, then will increase slowly to 1.7% until 2021F. After 2021F, real GDP growth will decline to 1.6%. The inflation rate has been inconstant in the past years, slowing in 2018 to 1.9% and it is expected to keep growing in the next years, reaching to 2% in 2023F (see figure 17). In the future, according to IMF (2019), between 2018 to 2023F, is expected that European union population grew by 1.034%. Afterall, European economic outlook for the next years is favorable to SKX business.
Canada Economic Outlook
3.
Core Countries Outlook
0 2 4 6 8 10 Canada
China, People's Republic of India
United States Asia and Pacific European Union World Japan 0 2 4 6 2 0 1 6 2 0 1 7 2 0 1 8 2 0 1 9 2 0 2 0 2 0 2 1 2 0 2 2 2 0 2 3 Inflation rate
Unemployment rate (Percent) Source: Author; IFM, World Economic Outlook Database, April 2019
Figure 14: World’s GDP Growth (%)
Figure 15: World vs US: real GDP growth (%) 0 1 2 3 4
United States World
Source: Author; IFM, World Economic Outlook Database, April 2019
Source: Author; IFM, World Economic Outlook Database, April 2019
Figure 16: World vs US: Inflation rate and Unemployment rate (%)
11
The company is based on Canada. Over the years there has been a gradual increase in population. In 2017 to 2023F, it is predicted to grow by 7.8% of the Canadian population, according to IFM (2019). Between 2017Y to 2018Y, the real GDP growths, drastically drop, from 3% to 1.8%. From 2019F to 2023F, the real growth rate is expected to be close to 2%. The inflation rate is expected to oscillate near to 2% by 2023F (see figure 18).
For all of the above, Canada economic outlook for the next years is in favor to SKX business.
China Economic Outlook
China is the strategic region where SKX is strongly invested. The SKX products are manufactured in China. Over the decades China, has moved from one of the world’s poorest countries to the world’s second largest economy, and it is expected that China economy while continues to perform strongly. The real GDP growth rate of China is predicted to decrease slowly between 2019F, (6.3%), and 2023F (5.6%). The country is focused on high-quality growth, and despite the gradual slowdown along the years of the economy, China might surpass the US, becoming the world’s largest economy by 2030F. According to World Bank (2019), China is the second largest country ranked in terms of their GDP based on purchasing power parities (PPP). The inflation rate follows the same down trend as the GDP growth rate. In 2018 the inflation rate was 2.1% and in 2023F, it is predicted to increase to 3%. Although the real GDP growth rate is decelerating the unemployment rate is expected to remain constant by 2013F at 3.8%. According to World Bank (2019), China is accounted for 9.8% annual consumption in clothing and footwear sector. China prefers to spend more in clothing and footwear sector than education (7.03%), health (7.32%), energy (5.19%) and transport sectors (6.10%) (see figure 19). Afterall, China economic outlook for the next years is strongly favorable to SKX business.
India Economic Outlook
According to IFM (2019), India is the world’s seventh-largest economy by nominal GDP and the third largest by GDP based on PPP. India is the second largest consumer of footwear, reflecting its strong economic trends and demographic aspects. India has surpassed China, as the world’s fastest growing economy. According to IMF (2019), real GDP growth is expected to increase between 2018Y to 2023F from 7.1% to 7.7%. The Inflation rate is expected to increase between 2018Y and 2019F from 3.5% to 3.9%, then it is expected to remain constant over the years at 4.2%. The long-term growth perspective of India’s population is to increase by 6.8% between 2018Y to 2013F from 1334.221 million to 1424.063 million of people. More than half of India population are under 25 years old. According to World Bank (2019), 5.98% of India’s household total consumption is for clothing and footwear goods (see table 8). India expends more in clothing and footwear than in education (3.8%), health (4.53%) and transportation (5.22%).
Food and Beverages 44,63% Clothing and Footwear 5,98% Housing 12,47% Energy 8,01% Transport 5,22% Water Utility 0,24% Education 3,54% Health 4,53% Personal Care 2,39% ICT 3,27% Financial Services 0,04% Others 9,66% 0 0.5 1 1.5 2 2.5 0 0.5 1 1.5 2 2.5
Figure 17: European Union: Inflation rate (%)
Source: Author; IFM, World Economic Outlook Database, April 2019
Figure 18: Canada: Inflation rate (%)
Source: Author; IFM, World Economic Outlook Database, April 2019
Source: Author; World Bank 2019 Table 8: India- Share of Each Sector in Household Total Consumption by Segment in China 2019 (%)
12
Afterall, India economic outlook for the next years is strongly favorable to Skechers business.
Japan Economic Outlook
The Japanese major economic indicators have decelerated in 2018, including investment, exports and consumer spending. According to IMF (2019), an increase in the real GDP growth although not significant, is envisaged, for the period between 2018Y and 2019F from 0.8% to 1%. The real GDP growth rate is expected to drop to 0.5% in 2023F. Japanese inflation is expected to remain positive with slow fluctuations by 2023F, 1.3%. Afterall, Japan economic outlook for the next years is less favorable to SKX business compared with the other Asian countries.
The global footwear market is part of the clothing and apparel industry comprised of luxury footwear, athletic footwear, shoes, sneakers, sporting shoes as well as other related goods. Shoes have turned from simple goods into a status icon for consumers. The market is segmented based on type of products, mode of sale and materials. By type, the segments could be divided into athletic and non-athletic footwear. According to material type, the markets can be subdivided into leather and non-leather footwear. SKX operates in the athletic and non-athletic footwear industry. The key drivers of footwear industry are the economic drivers, social media, ecommerce and athleisure trend. According to Statistics (2019), the US had the largest footwear market in relations of revenue, 79.86 billion U.S dollars, flowed by China with 58.31 billion U.S dollars of revenue in 2017. China is the leading footwear producer with approximately 13.1 billion pairs of shoes. Athletic footwear market was value at USD 64.30 billion in 2017.
Nowadays, fashion retailers see their products as having a short life cycle. The consumers feel the need to look for differentiated products to stay in fashion. This “need” for demand is largely due to what the consumer sees on social networks of friends or celebrities to publish. According to Adweek (2017), 81% of people are influenced by friends posts and 85% of people are influenced by celebrity, when making a buying decision. One of the strategies is to inspire consumer to purchase though the athletes and celebrities.
According to Boohoo (2017), after paying superstars to promote products on Instagram for consumer between 16 to 24 years the companies’ profits doubled. According to eMarketer report (2019), it is expected that global retail market will reach $25.038 trillion, an increase of 4.5% (see figure 21)and a retail ecommerce sale will growth 20.7% worldwide in 2019F (see figure 20). According to Ecommerce Market (2019) is expected that retail sales in China will grow 3.5% to $5.291 trillion in 2019F, being that the retail ecommerce sales will represent 36.6% of total retail sales, reaching $1.935 trillion. This significant increase should be related to the
4.
Industry Overview
25.00% 21.30 % 21.30 % 19.40 % 14.50 % 10.20% 20.70 % Asia- Pacific Latin America Middle East &Africa Central & Eastern
Europe North America Western Europe Worldwide 36% 9% 6% 5% 6% 1% 7% 7% 0% 9% 1% 13%
Food and Beverages Clothing and Footwear Housing Energy Transport Water Utility Education Health Personal Care ICT Financial Services Others
Figure 19: China- Share of Each Sector in Household Total Consumption by Segment in China 2019 (%)
Source: Author; World Bank 2019
Figure 20: Retail Ecommerce Sales Growth Worldwide, by Region 2019 (% change)
13
following factors: an increase of mobile users (5.11 billion users in the world, up 2% in the past year), an increase in social media users (3.48 billions of media users in the world, up 9% in the last year) and an increase in people using social media on mobile devices (3.26 billions users, up 10% in the last year).
Nowadays, “athleisure” is trend of the industry, is the combination of a style that can be used for both physical exercise and general used. Today people have a collection of footwear for casual, formal and athletic needs. According to Morgan Stanley (2017) it is expected to reach $355 billions of global athletic wear, up from $ 20 billion in 2019F. According to BlueWeave Consulting (2019), the global footwear market is expected to grow significantly during the forecast period 2019-2025, since that, footwear gaining popularity as fashion accessory among consumers.
There are several macroeconomic factors that contribute to a favorable environment in the footwear industry, these factors and the competitive environment of the industry was made through PESTL analyze.
Political Factors: SKX’s manufactured their footwear in foreign countries, such as China. Foreign manufacturing and sales are subject to a number of risks, including the political factors. A political instability can limit (1) goods manufactured; (2) labor costs; (3) increased cost of raw materials; (4) currency exchange rate fluctuations; (5) change compliance in foreign laws; (6) import and export controls.
Social Factors: the millennials have brought a new focus on fitness and health to the market, everyday clothes are comfortable, and they dress as if they are working out. Consumer behavior and lifestyle influence the number of sales. In most countries, participation in sports is embedded in their culture. The brand preferences and high quality over price are valued in the footwear industry. As obesity rate is rising and people are becoming more ‘health conscious’, this translate into more individuals moving towards better lifestyles, buying more sports apparel. The footwear adopted this trend and adapted to health problems. The increase in female members at Olympic Games (see figure 22) and a higher education levels are the others main factors related to an increase of footwear industry, for example one of the Puma strategies is to focus on women. These athletic women will be looking for fashion trends and better fits athletic. Lastly, consumers are looking for companies that are environmentally and socially (sustainable) conscious.
Technological Factors: the social media and the increase in ecommerce have footwear’s sales. Since that, new technologies allow companies to improve their sneakers, for example increasing comfort and performance. These technologies permit the companies to be more efficient, reducing manufacturing costs.
Legal factors: footwear companies avoid paying substantial amount of taxes by shifting of profits to offshore tax havens. The companies have to ensure that all their promotions give a true representation of the products being advertised, in order not to break the laws of the Trade Descriptions Act.
Today, people don’t walk into a retail store to find their next look—they turn
to their social media feeds to see what’s happening around them with friends or people they admire.- How Social Media Contributed the Rise of Fast Fashion (ADWEEK, 2017) Since 2007, global sales of athletic
wear have increased 61%. Faster supply chains that growth for years to
come.- Morgan Stanley 2017.
3% 11% 28% 58% Paris 1900 London 1948 Los Angeles 1984 Tokyo 2020
Figure 22: Historical and Forecasted Female Participation at Olympic Games (%)
Source: Author; eMarketer2019 Figure 21: Retail Ecommerce Sales Worldwide ($T) $ 2,382 $ 2,928 $ 3,535 $ 4,206 $ 4,927 $ 5,695 $ 6,542 $ 1,000 $ 2,000 $ 3,000 $ 4,000 $ 5,000 $ 6,000 $ 7,000
14 Main competitors and Peer Group
To find the peer group, the first step was to select the firms included in Bloomberg under Textiles, Apparel & Luxury Goods. This includes Puma, Adidas, Skechers, Nike, Under Amour, Geox and VF Corp. Then, as second step, we eliminated the companies that did not have footwear as its primary source of revenue or did not have a stronger market presence in the US and Europe. In the third and final step, we decided to eliminate the companies with a market capitalization lower than $1billion. At the end, the peer group includes Puma, Adidas, Nike and Under Amour and Skechers. Next, we briefly analyze the peer group.
Puma SE
This German group was founded in 1948 by Rudolf Dassler, after a family disagreement that originated inside the Adidas group and Puma. Puma design manufactures athletic and casual footwear, apparel and accessories products. In 2018, the company generated €4 648.30 million. To this, 47% of sales was in footwear, 36.3% apparels and 16.7% for accessories (see figure 24). Currently has a market capitalization of €10.50 billion and a total revenue of €4 235.80 million in 2017Y, 11% higher than the previous year.
Strategies: The company have defined five priorities. (1) marketing them to strengthen their positions as a sports brand through partnerships with some of the most elite athletes, such as the legend Usain Bolt and Antoine Griezmann. In order to connect with younger audiences, they work with cultural and fashion icons, such as Selena Gomes and Cara Delavigne; (2) improve the product trough of innovations, designs and products; (3) Women are a priority for the company. The company has developed and improve the female fashion trends; (4) they improved the quality of distribution, by strengthening the relationship with key retailers; (5) they improved IT infrastructures.
Adidas’s AG
This group was founded by Adolf Dassler. According to Bloomberg (2019), the company has a market capitalization approximately of €56.958 billion and a total revenue of €21.915 billion in 2018Y, 8% higher than in the previous year. In footwear, Adidas’s generate a total sale of €12.783 million, 3% higher than 2017Y (see table 9). Footwear represents approximately 58% of company total sales. In 2018Y, the company gross margin increases 1.4pp to 51.8%.
2018 2017 Footwear 47.0% 47.7% Apparel 36.3% 34.9% Accessories 16.7% 17.4% €4.6 billions of sales in 2018 €419 millions of EBITDA in 2018
Source: Author; Puma’s company Figure 24: Puma Sales by segment 2018 (%)
Source: Author; Puma’s company Figure 23: Puma logo
Figure 25: Adidas logo
Table 9: Adidas Sales by segment 2018 (%)
47% 36%
17%
Footwear Apparel Accessories
15 Strategies: One of the Adidas’s strategies is to anticipated trends. They want to
improve the product through innovation, and opening more stores in cities, since that the global population lives in cities.
Nike, Inc.
The company was founded in 1964 by Bill Bowerman and Phil Knight. Nike is one of the most brands values among sports business. This company have 3 main sources of revenue the footwear, apparel and accessories (see figure 27). The company generates a total revenue of $36,397 million, in 2017Y, 6% higher than the previous year. Approximately 61% of the total revenue are generated by footwear sales. Currently has a market capitalization of $144.639 billion.
Nike’s strategies: Nike wants to improve their product through the innovation, technology and sustainable design. Nike wants to place on the market the right product with the right price. They also want to improve their supply chain.
Under Amour, Inc.
The company was founded in 1996 by Kevin Plank. The company American manufactures footwear, sports and casual apparel. The company generates a total revenue of $5.193 million in 2018Y, 4% higher than the previous year. North of America is the major segment by region, representing 72% of the total revenue followed by EMEA and Asia Pacific with 11% of the total revenue (see figure 27) The company currently has a market capitalization of $8.029 billion.
Under Amour’s strategies: The company wants to focus on marketing. They have strengthened their positions as a sports brand through partnerships with some of the most elite athletes, such as: Michael Phelps, Stephen Curry, Tom Brady, and a Gisele Bündchen. Endorsing these world renown athletes increases the social media presence of the company. They also focus in improving distribute channel.
Figure 26: Nike logo
6 1 .1 8 % 2 9 .4 9 % 3 .8 4 % 5 .4 9 % 6 1 .3 7 % 2 8 .1 0% 4 .1 5 % 6 .3 8 % 6 1 .3 8 % 2 8 .0 1 % 4 .6 2 % 6 .0 0 % 2018 2017 2016
Source: Author; Adidas company
Figure 27: Nike Sales by segment 2018 (%)
Source: Author; Nike company Figure 28: Under Amour logo
16 Competitive Position:
Industry Swot Analysis
Strengths Weakness
-Diversified portfolio of products; -E-commerce;
-Brand legacy;
-Focus on client behaviors- innovation to follow new consumer’s needs and their preferences;
-Loyal clients.
-High dependence on retail distributors;
- Production in developing countries.
Opportunities Threats
-New markets;
-World economic recovery; -New product lines;
-Changing lifestyle- higher concern with healthy lifestyles.
-Political and economic instability; -Strong competitors worldwide; -Counterfeit products.
Porter’s 5 forces
Bargaining Power of Suppliers (Low)
The footwear industry has a high overall supply of raw materials spread around the worlds, sneakers are usually manufacturing using leather, textile and synthetical material. All of the companies in textile- apparel, footwear & accessories industry buy their raw material from numerous suppliers. Powerful suppliers in this sector can use their negotiating power to extract higher prices from the firms. However, major firms such as SKX, can switch suppliers without decrease in quality.
Threat of new entrants (Low)
In order to enter into the footwear industry, it is necessary a high capital investment. This industry faces a high entry barrier due to a strong brand loyalty and economies of scale and scope. The access to distribution opportunities is limited due the top brands have already their market share and they already have agreements with celebrities, athletes and retailers.
Bargaining Power of Buyers (Medium/high)
SKX’s sell its products primarily to retailers who distribute the products to the final customer. Footwear industry are controlled by a few retailers, they also control market shares. For SKX customers often seek discounts and offerings. If SKX’s
72% 11% 11% 4%2% North America EMEA Asia Pacific Latin America Connected Fitness Source: Author; Under Amour company
Figure 29: Under Amour Sales by region 2018 (%)
Source: Author Figure 30: Porter’s 5 forces
17
rapidly innovate their products with new products, then can limit the barging power of buyers.
Threats of Substitutes (Low)
The footwear industry is divided in athletic or non-athletic shoes. SKX’s portfolio is composed by both types of footwear, the substitutes are not perfectly substituted by another type of footwear, but the substitutes could be counterfeited footwear products, sandals, dress shoes, boots are other non-athletic footwear. According to OCED (2016), footwear industry is one of the most industries affected by counterfeit products. In 2016Y, 22% of the total footwear was seized counterfeit. The company sells through different channels. Firms are using ecommerce and apps to circumvent the power of the retailers and distributors.
Industry Rivalry (High):
They are few big players on footwear industry across of the world. This industry has a highly competitive position. In order to get market share, companies use brand name and the loyalty of the clients. The companies try to produce more products, instead to capture more consumers. Another way to capture consumers is through price and discounts/promotions.
With a price target of $43.38/sh for YE2019, an upside potential of 27.01% from the current price of $31.66/sh, using the DFC, more specifically the FCFF method, and a medium risk assessment, our recommendation stands for STRONG BUY. APV method supports this strong buy recommendation. The relative valuation through multiples support our recommendation, since we obtained a price target of $52.12/sh, representing an upside potential of 42.57%.
Economic growth, unemployment rate, inflation rate and purchasing power have been identified as the main economic drivers for the sector. Depending on the location, each driver impacts the company differently. The company is highly exposed to economic slowdown and change on consumer preferences Terminal growth rate is also considered a key factor for valuation, it is expected to be equal of 2.90% and was calculated based as a weighted average of growth rate for each main region, where the weights are region’s sales.
Valuation Methods
In order to evaluate SKX, we used two different valuation methods, an absolute and a relative valuation method. Considering the absolute valuation method, we used the Free Cash Flow to the Firm and the Adjusted Present Value. Regarding the relative valuation method, we used the Comparable Multiples approach. The
DCF Enterprise Value $7727,88 Price Target at 2019F $43,38 APV Price Target at 2019F $41,59 Multiples Valuation EV/EBITDA price target $51,91
EV/SALES $58,34
5.
Investment Summary
“69% of participants who bought a counterfeit were satisfied with the product to some extent”Source: Red Points, 2019
Source: Author Table 10: Valuation Summary
Figure 31: Forecasted Gross Margin, EBITDA Margin and Net Profit Margin (%)
0.00% 10.00% 20.00% 30.00% 40.00% 50.00% Gross Margin EBITDA Margin Net Profit Margin Source: Author
18
comparable multiples used was EV/EBITDA and EV/SALES. We used this approach as a robustness check for the absolute valuation method. This approach supports the conclusions resultant from the absolute valuation method.
Financial Position
Attending on the past performance, is expected that the SKX revenues increase until 2023F. Gross profit margin, the company presented a percentage of 45.87% in 2016Y and scope 47.90% in 2018Y. However, it is expected to reduce to 46.8% in 2019F. This reduction will affect EBITDA Margin, and it is expected to decline to 9.44% in 2023F (-1.10% in 2019F). Net profit margin is expected to increase, 6.49% in 2018 to 7.20% in 2019F (+ 10%) (see figure 31).
Risk Price Target
SKX’s industry, is dominated by the following trends: internationalization, e-commerce, social media and consumer’s trend. We performed a sensitivity analysis and a Monte Carlo simulation (see figure 32) in order to compute the impact of the main investment’s risks of the price target. These two methods support our STRONG BUY recommendation. According to the last one, the price target obtained was $43.64/sh.
To perform SKX valuation, we used the consolidated financial statements for the period between 2016 and 2018, industry and macro-economic information.
Valuation Methodology
We used two different valuations method, in order to evaluated SKX’s, an absolute valuation method and a relative valuation method. According to absolute valuation method, we applied two methods the DCF method and the APV method, in order to compute the SKX’s enterprise value. The Dividend Discount Model (DDM) was not applicable, since that the company doesn’t distribute dividends across of the past years.
In order to achieve the price target, in terms of relative valuation, we used the Market Multiples Approach applying of EV/EBITDA and EV/EBIT multiples. The selection of the peer group was already mentioned in chapter 6.
Key Valuation Drivers Total Revenue
Following the company’s annual reports, the revenues were forecasted for each geographical segment: Other international, the US and Canada. The other
6.
Valuation
0 200 400 600 800 1000 1200 1400 1600 1800 2000 3 0 .3 0 3 2 .1 3 3 3 .9 5 3 5 .7 7 3 7 .5 9 3 9 .4 1 4 1 .2 4 4 3 .0 6 4 4 .8 8 4 6 .7 0 4 8 .5 2 5 0 .3 4 5 2 .1 7 5 3 .9 9 5 5 .8 1 5 7 .6 3 5 9 .4 5 6 1 .2 8 6 3 .1 0 F C F FSource: Author; Oracle crystal Ball
Figure 32: Monte Carlo Price Simulation Distribution
19 international markets (50.5% of weight in 2018Y) is the main region that generates
sales, recording a CAGR of 24.43% from 2016Y to 2018.Y The US (45.8% of weight in 2018Y) and Canada (3.7% of weight in 2018Y) are the other key geographic segment that generates sales, recording a CAGR of 5.28% and 14.73% from 2016Y to 2018Y, respectively. According to Damodaran (2019), the expected growth rate in revenues for the next 2 years regarding the shoe industry is 4.93%. Historically, the company has been growing above the industry average. Most of the growth will come from other international market, focusing on countries such as China, India and Japan that have not only favorable macroeconomic indicators for their expansion, but also a favorable consumer belief trends will allow the company to penetrate in those new markets. Afterwards, we assume that the volume of sales will grow above of the industry expectation for the next 5 years. We assume that the company will grow 8% YoY until 2023F, similarly to the forecasted growth rate by Bloomberg (April 2019).
Therefore, it is expected that the other international markets increase progressively until 2023F (see table 12). This increase is originated by the economic factors such as the real GDP growth, PPP and population growth rate. In the other hand, for US is expected to have revenue growth rate compared to other international markets (58% vs to 38.6%). Canada, where the economic projections are not expected to be strongly favorable to increase market share until 2023F, will also grow but a smaller rate (3.5%). However, for the US and Canada it is expected an increase in revenues, but slowly decrease on weight of market share. According to eMarketer (2019), the retail ecommerce sales in US is expected to reach to $969.70 billion, representing a CAGR of 13.37% from 2019F to 2023F. The retail ecommerce sales in Canada, follow the same trend of US, representing a CAGR of 13.75% from 2019F to 2023F. (see figure 33).
Lastly, other operating income is expected growth at this same rate growth rate Therefore, the other operating income will growth 0,4% YoY.
2018Y 2019F 2020F 2021F 2022F 2023F CAGR Other International 2 342,1 2 604,7 2 894,3 3 213,5 3 565,3 3 952,9 11% % of total sales 50,5% 52,0% 53,5% 55,0% 56,5% 58,0% United States 2 128,1 2 225,7 2 325,2 2 426,4 2 529,0 2 632,4 4% % of total sales 45,8% 44,4% 42,9% 41,5% 40,0% 38,6% Canada 171,9 183,1 195,0 207,7 221,2 235,5 7% % of total sales 3,7% 3,7% 3,6% 3,6% 3,5% 3,5% Total Revenue 4 642,1 5 013,4 5 414,5 5 847,7 6 315,5 6 820,7 Main Costs 2016Y 2017Y Other International 1 512,7 1 948,3 % of total sales 42,5% 46,8% United States 1 920,1 2 055,5 % of total sales 53,9% 49,4% Canada 130,6 160,4 % of total sales 3,7% 3,9% Total Revenue 3 563,3 4 164,2 5 ,0 1 3 5 ,4 1 5 5 ,8 4 8 6 ,3 1 5 6 ,8 2 1 2 0 1 9 F 2 0 2 0 F 2 0 2 1 F 2 0 2 2 F 2 0 2 3 F Figure 33: Forecasted Total Revenue ($M)
Source: Author Table 11: Historical revenue by region ($M)
Source: Author; Bloomberg
Table 12: Historical and Forecasted revenue by region ($M)