Determinants of the pattern of horizontal and vertical intra-industry
trade: what can we learn from Portuguese data?
1Nuno Crespo* and Maria Paula Fontoura**
*ISEG, Technical University of Lisbon
**ISEG/CEDIN, Technical University of Lisbon e-mail: [email protected]
Abstract
We rely on vertical and horizontal differentiation models to study the cross-industry and cross-country determinants of Portuguese intra-cross-industry trade in 1997. We identify distinct factors for each type and the comparative advantage explanation for the vertical case. To confirm the robustness of the results we use alternative measures for a continuous dependent variable and re-estimate all equations with a Probit model. The probabilistic model takes into account the fact that we expect a relation between the existence of the explanatory variables and the existence of the phenomenon, but the way some of the factors impact is not a priori known.
JEL codes: F12, F14
Keywords: horizontal intra-industry trade, vertical intra-industry trade, Portugal
1
Determinants of the pattern of horizontal and vertical intra-industry
trade: what can we learn from Portuguese data?
2Nuno Crespo and Maria Paula Fontoura
1-Introduction
Intra-industry trade (IIT) has captured an enormous effort of research in three main areas: measuring the magnitude of the phenomenon, developing theoretical explanations for its existence and, finally, evaluating the determinant factors arising from the theory.
In the nineties, the previous research received a significant stimulus with the method proposed by Abd-El-Rahman (1986) to empirically disentangle horizontal IIT (HIIT) connected to the differentiation in characteristics from vertical IIT (VIIT) -associated to differentiation in quality. In fact, surprisingly, because it contradicted the common view, empirical measurements displayed that VIIT appears to be more relevant than HIIT in all case studies. The consequence was that theoretical models on VIIT got an unexpected interest and researchers were led to test whether this type of trade would be determined by the factor proportions explanation of the comparative advantage instead of the commonly referred factors of the imperfect competitive context predicted by the monopolistic competition theory.
In this paper, we focus on the Portuguese case in relation to which the analysis of IIT is still very limited (especially concerning the study of the determinant factors of the several IIT types). Our aim is a double one. First, we present empirical evidence concerning the reality of Portuguese IIT during the last decade. On the other hand, we intend to incorporate the distinction mentioned in the study of the determinant factors of vertical and horizontal Portuguese IIT for the year 1997. What we mainly aim to capture through the empirical identification of IIT determinants is to explore whether disentangling the measure of IIT into VIIT and HIIT provides a better estimation of their determinants relatively to the traditional use of total IIT. Such an analysis will allow to test whether, in contrast to the HIIT, comparative advantage may explain VIIT.
In what concerns empirical modelling, we start with a standard specification in a cross-country and a cross-industry analysis. However, considering that (i) for some
2
explanatory variables it is not possible to assume a simple continuous and direct relationship with the IIT variable, as it has been extensively discussed in the case of scale economies, and (ii) theory, mainly for studies across countries, is only scarcely suggestive of the impact of the factors traditionally included in this kind of studies, we decided to use alternatively a probit model. Our reasoning is that the probabilistic model appears to be more adequate whenever we should expect a relation between the existence of those factors and the existence of the phenomenon we are analysing -the volume (share) of the intra-industry trade types-, but the way the explanatory variables impact is not a priori known.
The remaining part of the article is organised the following way. In point 2 we make a short revue of the most relevant theoretical models concerning IIT. In point 3 we present the methodology used for measuring Portuguese IIT. Then, in point 4, we will focus on the Portuguese reality, pointing out the evidence concerning the several types of IIT. Point 5 is devoted to the study of the determinant factors of vertical and horizontal IIT. We end up with some conclusive remarks.
2-
Main theoretical guidelinesHorizontal and vertical differentiation of goods is a decisive element in the generality of models which aim to explain IIT3, however the former has been object of a much wider attention.
In fact, the former –and best diffused- models on IIT concentrate on horizontal differentiation. Modelled for a context of monopolistic competition, they display the major role of scale economies and product differentiation on horizontal differentiation4.
Later on Eaton and Kierzkowski (1984) introduced the horizontal differentiation in a context of oligopoly. With free entry in the market, the equilibrium is obtained in a sequential game where the decision of entry and the choice of variety is taken prior to the decision concerning price and quantity. Supposing the existence of two identical economies and, in each one of them, two groups of consumers with a different “ideal
3
The Brander (1981) and Brander and Krugman (1983) models with homogeneous goods being the most relevant exceptions.
4
With the traditional monopolistic competition approach, Krugman (1979), following Dixit and Stiglitz (1977), assumed a “love of variety” approach, and Lancaster(1980), bearing in consideration the “new consumer’s theory” developed in Lancaster(1979), considered an “ideal variety” approach. They both concluded that the diversity of preferences and scale economies may be associated to IIT. This central result of Krugman (1979) was also obtained, for instance, in Dixit and Norman (1980), Krugman (1980,
variety”, the international trade leads to the existence of only one producer for each of the ideal varieties in each market, what generates IIT.
The main reference for vertical differentiation is the model developed by Falvey (1981) and complemented by Falvey and Kierzkowski (1987), in the context of the comparative advantage theory. Falvey linked the product quality to capital intensity in production in the context of the Heckscher-Ohlin-Samuelson theory, with capital moving freely between firms of a given sector but not between sectors. If capital/labour ratios differ within the product group, capital abundant countries will produce and export high quality capital-intensive products and labour-abundant countries will export low quality, labour intensive products. Countries with intermediate relative capital endowment will tend to specialise in products with intermediate quality. Falvey and Kierzkowski added an explicit demand side by modelling demand for different qualities as a function of the quality’s relative price and consumer income; higher income consumers acquire higher quality varieties and the share of vertical IIT type in the bilateral trade between two countries is greater the greater the differences in the capital/labour ratios, and therefore in the income per head of the two countries.
The vertical differentiation was incorporated in IIT models with an oligopoly context by Shaked and Sutton (1984).They assume that thequality of a product depends on R&D, which is reflected on the fixed costs, and, from this fact, it is usually inferred that it is more suitable to high technology sectors. In the demand side, like in the previous model, consumers who have a higher income will demand goods of a superior quality. The equilibrium is obtained in a three-stage game where decisions related to entry, quality of the product and price are taken. With trade openness, average cost decreases, due to scale economies, in the enterprises which remain competitive and R&D profitability increases. Thus, in the new equilibrium, for a given price, the quality of all varieties will be higher. With the remaining firms located in different markets, vertical IIT will occur. If the average variable costs increase moderately with quality improvement, this model will lead to a “natural” oligopoly.
Three relevant theoretical implications for our empirical work should be underlined from this literature.
First, IIT can be derived under varying market structures. Either models for “large” numbers or for a high degree of market concentration are valid to explain HIIT, even if in this case there is theoretical support for the view that markets with a large
1981) or Venables (1984), and in what concerns the model of Lancaster (1980), it was later on developed
number of firms are more likely to be conducive to IIT (Lancaster (1980) for instance argues that IIT will be at a maximum under conditions of “perfect” monopolistic competition). The theoretical results of the impact of market structure are more equivocal in the presence of VIIT. If the neo-H-O-S setting is valid, structurally competitive markets is the adequate context, but the natural oligopoly model also supports this type of trade. Finally, it is well known that a range of aspects of market structure (entry conditions, market size, minimum efficient scale of production, firm behaviour) are co-related and simultaneously and endogenously determined.
Secondly, the main theoretical references focus variation across industries in bilateral trade. If we analyse, as it is the case in this study, ITT across countries, the assumption is that the determinants of differences in IIT among countries are but an aggregation of the industry characteristics considered in the theory5. For instance, it can be posited, like in Loertscher and Wotlter (1980), that the larger an economy, the greater the opportunities for scale effects, hence the higher should be IIT. In general, the greater the degree to which a country´s production tends to contain the relevant industry characteristics, the greater the value of total IIT. However, on one hand, as Havrlylyshyn and Civan (1983) have clearly pointed out, aggregation may bring in counter-vailing effects (p. 117/118); on the other hand, expected impacts are even more difficult to grasp if there are cross-country differences in the effects of sectoral characteristics (so that bilateral imports and exports are affected asymmetrically), as it is usually the case.
Thirdly, in what concerns the determining factors of IIT, it has been generally accepted that, except for the case of the factor proportions model on VIIT, scale economies and product differentiation are necessary conditions for IIT. However, not even monopolistic competition models allow us to predict a continuous positive relationship with IIT . In fact, the inclusion of a fixed-cost term (associated with plant or product development) in the representative firm’s cost function allows for the possibility of decreasing costs in production. But inter-industry differences in the extent of, or scope for decreasing costs of this form -as well for the related product differentiation- are not necessarily related in a consistent or predictable manner to the implications for intra-industry exchanges. They will depend on the nature of the products, the size of the total market and of the minimum efficient scale of production (m.e.s.) (Greenaway and Milner, 1986, p. 122). Ethier (1982,p.390) reached a similar conclusion regarding trade in intermediate goods: “although the existence of internal scale economies and product
by Helpman (1981).
differentiation are essential to the theory, the degree of such phenomena need not be an essential determinant of the degree of intra-industry trade”
If the possibility of multi-product firms (firms which produce a number of varieties of a particular commodity) is considered, Greenaway and Milner (1986, chapter 4), in a model with preferences a la Lancaster, have also postulated that IIT in general is directly related to the scope for scale economies to sustain large number of firms and/or varieties, but not to the extent of decreasing costs per se (p. 112). In fact, the presence of significant fixed/overhead costs may not only create opportunities for profitable new variety entry in the form of new firm entry but also for multi-product firms under the incentive of spreading fixed overheads across a number of varieties. However, “as the domestic market power of incumbent firms increases and the scope and incentive for entry-deterring strategies (via pricing and product range decisions) increases, then the impact on “foreign entry” and the extent of IIT becomes less predictable” (ibidem, p. 112). Thus, again, we cannot hypothesise a simple continuous and direct relationship between IIT and the extent of scale economies.
These theoretical observations point out to the ambiguity of some expected signs. The latter two justify the choice of the probabilistic (qualitative dependent variable) model as a complement to the more standard specifications.
3-The measurement of IIT and the distinction between vertical and horizontal IIT
The traditional approach for measuring IIT has in Grubel-Lloyd (GL) index its most divulged expression. As it can be easily deducted from the formula, this approach is based in the concept of “trade overlap”6, measuring, this way, the proportion of the overlapping of exports and imports in the total trade. As it has been pointed out7, in this type of measurement a central problem is due to the fact that there is a dividing-line in the majority flow (either of exports or of imports) that can be explained by two different conceptual approaches. In fact, the part of the majority flow that exceeds the “overlapping” is related to the inter-industry trade and can be explained by differences in factor abundance or technology in a context of perfect competition (comparative advantage theories), while the other part has its basis on the imperfect competition context of the “new trade theories”.
5
See, on this purpose, Havrylyshyn and Civan (1983, p. 117/118). 6
In fact, the GL index is the ratio of twice the minimum flow on the total trade. 7
In the present study, we will use preferentially an alternative approach suggested by Abd-El-Rahman (1986) and Freudenberg and Muller (1992), having been altered by Fontagné and Freudenberg (1997). It is usually identified as the CEPII8 methodology, due to the affiliation of the above mentioned researchers with this Institution.
A main difference between this new approach and the traditional one remains on the rejection, by the proponents of the new methodology, of the referred dividing-line between inter and intra-industry trade. Their proposal is that in case there is a minimum overlapping between the two flows (10%) they will both be considered in their totality as being part of the intra-industry trade type. In any case both exports and imports will always belong to the same type of trade.
Another novelty of the CEPII methodology is the criterion suggested to disentangle the different types of intra-industry trade. We will call it the product similarity criterion 9and it has also been applied to the overlapped trade according to the GL index since Greenaway, Hine and Milner (1994).
The product similarity criterion makes use of the ratio between the unit value of exports (UV(X)) and that of imports (UV(M)). It is therefore a matter of calculating:
a=U.V.(X) U.V.(M)
IIT type will be horizontal if ++αα α α ++ ∈ ∈ ,1 1 1
a and vertical if it does not belong to
that interval.10 On its turn, the vertical can be considered superior vertical if a∈∈
[[
1++αα ,++∞∞[[
or inferior vertical if
((
))
α α ++ ∈ ∈ 1 1 , 0a . The parameter α is a dispersion factor arbitrarily fixed. In general, α assumes the value 0.15. Other times, as in the present study, alternative values are used. Examples of application of this methodology include European Commission (1996), Fontagné et al. (1998) or, for the Portuguese case, Fontoura and Vaz (1999).
If, for instance, a value of 0.15 is assumed for α, in the case of the HIIT the assumption is that transport and freight costs alone are unlikely to account for a difference in the export and import unit values of no more than +-15%. Otherwise quality differentiation will predominate and intra-industry will be of a vertical type.
8
Centre d´Études Prospectives et d´Ínformations Internationales 9
The parenthood can be attributed to Abd-El-Rahman (1984) 10
This range appears to be more rigorous than the one traditionally used in this kind of studies:
The basic assumption of the above mentioned criteria is that the prices (unit values) are considered as quality indicators of the goods. The relation price-quality is supported by the idea that in a perfect information context a certain variety of a good can only be sold at a higher price if its quality is superior. However, even in a context of imperfect information, the quality will always reflect on the prices (Stiglitz, 1987). In spite of criticism of the unit value proxy-in the short run consumers may buy a more expensive product for reasons other than quality- this approach became widely used. Most studies on the quality of international trade assume, at least at a sufficiently disaggregated level, that relative prices reflect relative qualities11.
In this study, beyond the CEPII methodology, we will also apply the product similarity criteria to the GL index for the purpose of model estimation. This will allow to test for the robustness of the results when both measures are used alternatively.
For both methodologies, the analysis will be developed at 4-digit level12 of the Combined Nomenclature (CN). Thus, we will consider all the products of CN at 4 digit level which, according to Portuguese Classification of Economic Activities, are classified as manufactory industry sectors. In total, we consider 1111 products.
4-The empirical evidence in the Portuguese case
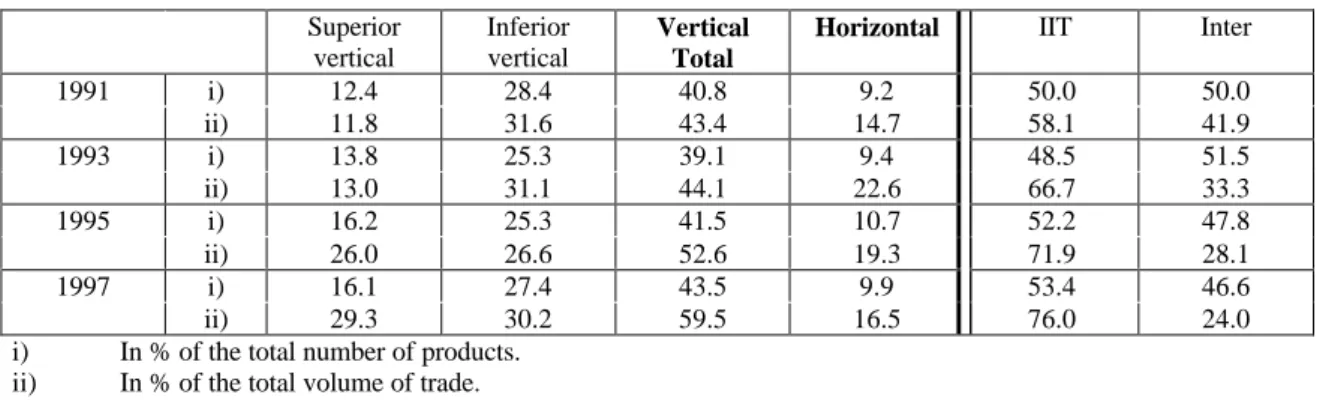
Table 1 shows the main results concerning IIT for the Portuguese trade with the rest of the world according to the CEPII methodology.
Table 1 - Types of trade – CEPII methodology
Superior vertical Inferior vertical Vertical Total
Horizontal IIT Inter
1991 i) 12.4 28.4 40.8 9.2 50.0 50.0 ii) 11.8 31.6 43.4 14.7 58.1 41.9 1993 i) 13.8 25.3 39.1 9.4 48.5 51.5 ii) 13.0 31.1 44.1 22.6 66.7 33.3 1995 i) 16.2 25.3 41.5 10.7 52.2 47.8 ii) 26.0 26.6 52.6 19.3 71.9 28.1 1997 i) 16.1 27.4 43.5 9.9 53.4 46.6 ii) 29.3 30.2 59.5 16.5 76.0 24.0
i) In % of the total number of products. ii) In % of the total volume of trade.
If we concentrate on the analysis in terms of the weight of the number of products of each trade type in the total number of products, we verify that the IIT shows a slight
11
Unit values of two bundles may differ also if the mix of products differs, so that one bundle contains a higher proportion of a high unit value items than the other. Increased disaggregation is the usual response to this drawback
12
increasing tendency assuming, in 1997, a value a little over 50% (53.4%). We also verify a clear predominance of vertical IIT facing horizontal IIT.
A more interesting analysis is, nevertheless, the one that considers the importance of each type of trade in the total volume of trade. This analysis is presented on the second line of Table 1 and it leads us to some important conclusions.
The first outstanding aspect is the clear predominance of IIT. Along the 90’s it is also patent an important increase in the relative weight of IIT. On the other hand, vertical IIT shows to be, without any doubt, the most relevant type of IIT in the Portuguese case. In fact, in 1997, it represents 59.5% of total trade (78.3% of the total IIT). The predominance of vertical IIT is a phenomenon which accentuates between 1991 and 1997, a result that is in consonance with some recent studies13 and should have necessarily influence on the way IIT is analysed both in theoretical and empirical terms.
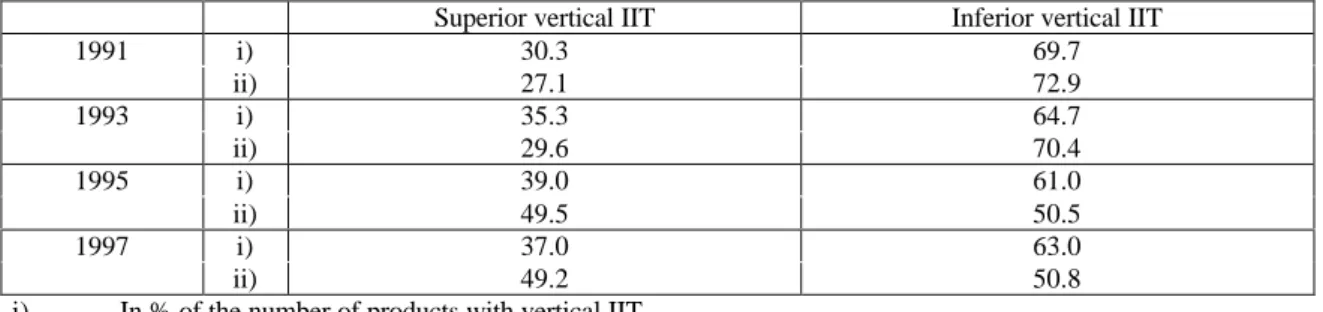
Being the vertical IIT of such importance it is indispensable to make a more detailed analysis of this trade type. In particular, it is important to investigate, in a comparative way, the quality of the exports and imports, that is, to ascertain which of the two types of vertical IIT is dominant. Having this aim in mind let us observe Table 2.
Table 2 - Types of vertical IIT – CEPII methodology
Superior vertical IIT Inferior vertical IIT
1991 i) 30.3 69.7 ii) 27.1 72.9 1993 i) 35.3 64.7 ii) 29.6 70.4 1995 i) 39.0 61.0 ii) 49.5 50.5 1997 i) 37.0 63.0 ii) 49.2 50.8
i) In % of the number of products with vertical IIT. ii) In % of total vertical IIT.
The most relevant aspect which emerges from the Table 2 is the enormous increase of the superior vertical IIT share from 27.1% in 1991 to 49.2% in 1997. That increase occurs primordially between 1993 and 1995 confirming the evidence in Fontoura and Vaz (1999). Another aspect which must be registered is the fact that this increase concerns products of outstanding importance since the increase of the superior vertical IIT is clearly higher in terms of volume of trade than in relation to the number of products.
13
See, for instance, European Commission (1996) for the European case and Porto and Costa (1999) and Fontoura and Vaz (1999) for Portugal.
The importance of the conclusions obtained justifies our confirmation of their validity. A first aspect which may be raised is the value for the parameter α (0.15) chosen to distinguish vertical from horizontal IIT. We adopted an alternative criterion more favourable to the horizontal IIT (α= 0.25). Nevertheless, even in these conditions, the horizontal IIT remains clearly in minority not representing more than 33.3% of the total IIT. Another way of testing the robustness of the obtained results consists in using the classical Grubel-Lloyd index. This approach was applied before by Greenaway et al. (1994, 1995) for the U. Kingdom and Hu and Ma (1999) for China. This analysis allows us to confirm all the essential conclusions that result from the application of the CEPII methodology. Thus, we register an increasing weight of IIT in the total volume of trade, a clear predominance of the vertical IIT and a strong increase of the superior vertical IIT along the 1990’s. Nevertheless, the application of the Grubel-Lloyd index leads us to an even stronger conclusion since superior vertical IIT becomes, after 1995, the dominant type of vertical IIT
From the two mentioned methodologies an important result emerges: the progressive transformation of the inter-industry trade in superior vertical IIT (since inferior vertical and horizontal IIT remain relatively stable).
At the sectoral level not only does this analysis evidenciate a strong weight of the IIT in the generality of sectors and a predominance of the vertical IIT (either assuming α=0.15 or α=0.25), but it also shows that this is a generalised tendency, which can not be attributed to the behaviour of some specific sectors. In fact, in the period considered, only in three sectors (tanneries and leather finishing, travel cases, products of leather, saddles and footwear; other non-metallic mineral products; other transport equipment) in a total of 2314 there is no increase of this type of trade.
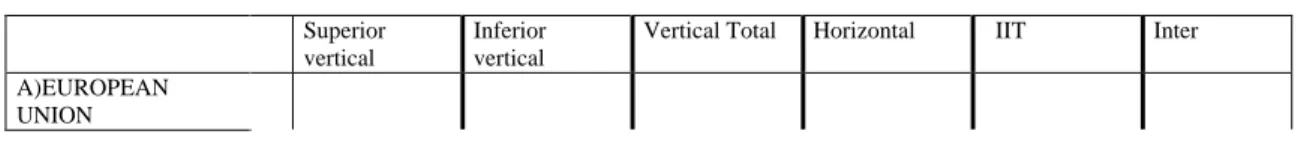
We also made the evaluation of the Portuguese IIT in bilateral terms, by considering the trade flows with 55 main trade partners of Portugal15 in 1997. The results obtained with the CEPII methodology (with α=0.15) are shown in Table 3:
Table 3- Types for intra-industry trade by country (1997)*
Superior vertical
Inferior vertical
Vertical Total Horizontal IIT Inter A)EUROPEAN
UNION
14
At the 2-digit level of the CAE Nomenclature. 15
We included all countries whose trade flows (X and M) with Portugal exceed 1.5 billion PTE, representing more than 95% of total external trade.
Germany 13.5 19.9 33.4 23.3 56.7 43.3 Austria 9.1 20 29.1 4.6 33.7 66.3 Bel-Lux 7.7 32.9 40.6 4.8 45.4 54.6 Denmark 6.1 7.9 14 2.3 16.3 83.7 Spain 21.6 33.2 54.8 15.6 70.4 29.6 Finland 1.7 4.5 6.2 1.2 7.4 92.6 France 10.7 24.4 35.1 21.5 56.6 43.4 Greece 3.8 2.3 6.1 1.2 7.3 92.7 Ireland 2.5 9.6 12.1 1 13.1 86.9 Italy 18 17.4 35.4 8.2 43.6 56.4 Netherlands 12.5 12.8 25.3 3.4 28.7 71.3 U. Kingdom 7.9 16 23.9 18.8 42.7 57.3 Sweden 1.8 15.6 17.4 2.2 19.6 80.4 B) OPEC Saudi Arabia 0 0 0 0.7 0.7 99.3 Algeria 0 1.7 1.7 11.4 13.1 86.9 Nigeria 0 0 0 0 0 100 Venezuela 1 3 4 1.1 5.1 94.9 C) OTHER COUNTRIES C.1) EUROPE Bulgaria 0 0.1 0.1 0 0.1 99.9 Slovakia 2.7 1 3.7 0 3.7 96.3 Hungary 2.9 1.6 4.5 1.3 5.8 94.2 Iceland 0.2 0.2 0.4 0 0.4 99.6 Norway 2.4 2.6 5 0.8 5.8 94.2 Poland 15.1 5.2 20.3 0.1 20.4 79.6 Czech Republic 20.7 7.4 28.1 5 33.1 66.9 Russia 0.2 0 0.2 0 0.2 99.8 Switzerland 6.7 9.9 16.6 2.5 19.1 80.9 Turkey 12.7 9.5 22.2 0.4 22.6 77.4 C.2) AFRICA Angola 3.4 0.9 4.3 0.1 4.4 95.6 Cape Verde 0.4 4.2 4.6 0.1 4.7 95.3 Mozambique 0.3 2.1 24 0.1 2.5 97.5 South Africa 4.8 3.2 8 2.2 10.2 89.8 Egypt 0.3 0 0.3 0 0.3 99.7 Morocco 6 1.3 7.3 0.3 7.6 92.4 Kenya 0 0 0 0 0 100 Senegal 0 0 0 0.1 0.1 99.9 Tunisia 1 16.3 17.3 0 17.3 82.7 C.3) AMERICA Argentina 0.5 4 4.5 0 4.5 95.5 Brazil 5.8 6.2 12 2.6 14.6 85.4 Canada 3.1 18.4 21.5 1.1 22.6 77.4 Colombia 0.5 0.5 1 0 1 99 USA 14.8 7.4 22.2 0.6 22.8 77.2 Mexico 2.7 9.9 12.6 1.6 14.2 85.8 Uruguay 0.4 0 0.4 0.2 0.6 99.4 C.4) ASIA China 1.9 2.1 4 3.2 7.2 92.8 South Korea 0.9 3.7 4.6 0.9 5.5 94.5 Hong Kong 12 13.1 25.1 1.3 26.4 73.6 India 0.9 5.2 6.1 0.2 6.3 93.7 Israel 1.5 9.4 10.9 2.4 13.3 86.7 Japan 2.3 4.8 7.1 0.7 7.8 92.2 Malaysia 3.4 5 8.4 0.2 8.6 91.4 Singapore 15.5 4 19.5 0 19.5 80.5 Thailand 0.3 2 2.3 1.2 3.5 96.5 C.5) OCEANIA Australia 4.4 2.4 6.8 0 6.8 93.2 New Zealand 0.3 1.2 1.5 0 1.5 98.5
*shares in the total bilateral volume of trade
By analysing the bilateral relationships with EU countries, it is possible to verify the existence of high levels of IIT. This fact is particularly notorious concerning the countries with which the Portuguese trade is more intensive .In fact, Portugal has levels of IIT superior to 40% with six countries: Spain, Germany, France,
Belgium-Luxembourg, Italy and United Kingdom. The total weight of these countries in the Portuguese trade is 68.3%. In all bilateral relationships with EU countries, vertical IIT is predominant. Even adopting α=0.25, this statement only loses validity in the case of Belgium-Luxembourg. An interesting result is that the vertical IIT with the EU countries is predominantly inferior vertical, being exceptions the cases of Italy and Greece.
In short, the main illation to take from the bilateral trade between Portugal and EU countries is the preponderance of specialisation along the quality spectrum. The Portuguese situation is still disadvantageous since in the generality of the bilateral trade there is predominance of inferior vertical IIT. The evolution of this scenery requires a particularly careful study in future years.
As far as the other countries are concerned, a clear predominance of the inter-industry is evident. In fact, only with six non-EU countries Portugal has an IIT level over 20%. The vertical IIT is, nevertheless, also in this case, the dominant IIT type. This is confirmed by the fact that in only 3 of the 55 bilateral cases considered the horizontal IIT has a weight superior to the vertical one- Saudi Arabia, Angola and Senegal. In the case of extra-EU countries, in spite of a great diversity, it is possible to detect a supremacy of superior vertical IIT.
The analysis in bilateral terms was re-made considering Grubel-Lloyd index and the results we obtained confirm in general of our conclusions.
5-The determinant factors of Portuguese IIT 5.1-The explanatory factors
Taking as support the theoretical references related to IIT and the empirical evidence extracted from several studies on the measurement of IIT, it is possible to formulate some hypothesis on the impact of some elements characterising the countries and the industries on vertical and horizontal IIT. In the present work we investigate the role of some factors which we consider more relevant to explain the share of intra-industry trade disentangled according to the two types -horizontal and vertical- in the total trade of the manufacturing industry for the year 1997.
We will explore the industry and country characteristics associated with IIT with distinct models. Alternatively we could have introduced simultaneously in the same equation both national and industry-specific variables as in Balassa and Bauwens (1988) or Blanes and Martín (2000). However, we are septic about the advantage of this doing if
the observation for the industry (product) is the same for every country involved in each bilateral transaction, which is the case in all studies done so far. In fact, due to the considerable data requirements, both home and foreign country conditions on product and industry characteristics have been proxied with just home-country conditions in the equivalent industry (product) transaction for every country involved in bilateral transactions. Of course separate estimations do not overcome this shortcoming but at least we do not have to explicitly attribute a value at the industry level for each bilateral transaction.
In the cross-country analysis we considered the 55 countries of section 4 but Kenya and Nigeria (where IIT with Portugal is zero) and the following variables:
•Dim: average of the GNP of the two countries. With this variable we intend to capture
the average dimension of the markets. We expect a positive sign for both vertical and horizontal IIT, on account of the fact that international trade is fundamentally but an extension of the internal market, somewhat along the lines of the Linder hypothesis. Arguments for a positive relation can also be founded on the supply side, such as the larger an economy the greater the opportunities for scale effects (Loetscher and Wolter, 1980) and, owing to economies of scale, the greater the equilibrium number of differentiated products (Lancaster, 1980).
•YD: difference of per capita income of the two countries. As it is frequently used in the
literature, we take this variable as a proxy for the difference of factorial endowments. The expected sign differs according to the type of IIT. While for vertical IIT we expect a positive sign, in the case of horizontal IIT we expect a neutral effect or a negative sign.
•Dist: cost of sending, by post, merchandises weighing up to 1 Kg to several economic
zones. This is a proxy introduced by Lee and Lee(1993) and which seems to us to represent the concept of “economic distance” in a more reliable way than the other proxies normally used to evaluate this effect. In fact, the proxies usually used concern mainly the geographical distance. Nevertheless, the transport costs do not increase in a linear way with distance. We expect a negative sign for the two types of IIT.
•ED: difference of expenses per capita with education. We consider this variable as an
market size and industrial structure, allow us to expect that IIT will be strongly positively related with the degree of economic development and industrialisation, even if the relation may not be continuous. Thus, we hypothesise that IIT is less probably in countries with differences of development (as table 3 clearly proves for the Portuguese case) and, therefore, we expect a negative impact of this variable on either of the two types of IIT.
•EU: dummy variable assuming one if the two countries belong to the EU. The empirical
evidence shows that the level of IIT is, generally, superior in spaces of integration (particularly, in Europe). We believe that this variable will assume a positive sign both for vertical and horizontal IIT.
In summary, the following model for the cross-country analysis will be subject to empirical estimation in view of the above hypothesis:
+ + - - +
VIITj = f (Dimj, YDj, Distj, EDj, EUj);
+ -/ns - - +
HIITj = f (Dimj, YDj, Distj, EDj, EUj)
where VIIT and HIIT represents, respectively, the share of vertical IIT and horizontal IIT in the total volume of bilateral trade between country j and Portugal in total manufactured foods; ns-non-significant. Expected signs for coefficients are shown above the variables.
In the cross-industry analysis we considered the 3-digit level of the manufacturing industries for the multilateral Portuguese external trade. Let us now consider the variables concerning the characteristics of the industries:
•Dif: number of products (corresponding to 8-digit level of CN) included in each
industry. This proxy is very often used to evaluate the degree of the differentiation of the product indistinctly of the respective type. Nevertheless, it is clearly more adequate for the evaluation of horizontal differentiation, as has also been assumed by several authors, such as Greenaway and Milner(1986) Thus, we expect a positive sign in the case of horizontal IIT and a negative one when we consider vertical IIT.
•SL: weight of non-manual work in the total work. It is an indicator (unquestionably far
from ideal) of the degree of the labour qualification of the sector. This variable is related to the neo-factor proportion model and thus it is used only in the case of vertical IIT. The expected impact depends on the relative skilled labour abundance and intensity of the Portuguese case and is a matter for empirical evidence.
•SE: weight of the number of workers in firms with more than 100 workers in the total
number of workers of the sector. This is a proxy usually used to evaluate the effect of scale economies. The expected sign for this variable can not be clearly brought forward as several empirical studies have proved, even if most studies postulate a positive sign16. In what concerns vertical IIT, the neo H-O-S model explanation assumes the perfect competitive context and the exclusion of scale economies, thus precluding a positive relation.
•C4: weight of sales of the 4 largest firms in the total sales of the sector. This is the
traditional variable to capture the level of concentration of the market. Depending on the market structure, both signs can be expected. Some authors hypothesised that the possibilities for concentration can be expected to decline with the differentiation of the product thus intra-industry trade will be negatively associated with industrial concentration17.
•NF: number of firms in the sector. This is a variable considered, for example, by
Greenaway et al. (1995) and it aims to complement the information of the previous variable. The ambiguity remains concerning the sign. However, if the comparative advantage explanation for VIIT (as expected in the case of Portugal) or the monopolistic competition context for HIIT predominates, the expected sign will be positive
Taking in consideration these hypothesis, we estimated the following model for the cross-industry analysis:
- ? ? ? + 16
Balassa and Bauwens (1988) suggest that instead of a plant economies of scale proxy one should measure the length of the production run to represent economies of scale in the case of differentiated products. Devising a proxy for the latter is perhaps an impossible task but the former should be interpreted as impacting positively on the extent of product standardisation (p. 92/93).
17
VIITi = f (Difi, SLi, SEi, C4i, NFi); + + ? ?
HIITi = f (Difi, SEi, C4i, NFi)
where VIIT and HIIT represents, respectively, the share of vertical IIT and horizontal IIT in total volume of multilateral trade of Portugal; i = industry suffix. Expected signs for coefficients are shown above the variables.
In the analysis we will do next, we will start with the standard OLS regressions. The correctness of this functional form is questionable considering the possibility that the predicted value for the dependent variable will fall outside the feasible interval (0,1). However, this is more of a problem where the equation is used for forecasting/prediction. If, as it is the case, the purpose is to explain IIT and “hypothesis testing”, this problem becomes less critical , which led most researchers on this topic to use the OLS estimation. Some authors prefer a logit transformation of IIT to restrict the predicted value to the limited range. We also estimated the model with a logistic function18 and but for the horizontal IIT in the cross-country analysis (where none of the variables are significant) results do not differ much (qualitatively) from the OLS case. Similar conclusion was obtained by Balassa and Bauwens (1988) who tested for alternative functional forms for a continuous dependent variable (p.99). In any case, the option for the OLS method has a simpler justification: “in the light of the data deficiencies and proxy problems encountered in such cross-sectional work it must be questionable whether such sophistication is merited” (Greenaway and Milner, 1986, p.131). In the OLS estimations we considered alternatively the CEPII index with two values for the parameter α (0.15 and 0.25) and the G-L index.
In line with the anticipated difficulties in hypothesising an unambiguous and continuous relationship with IIT in the case of some variables, we will complement that evaluation by using the Probit model. In this case we will investigate what factors explain the probability that the weight of the type of IIT considered is superior to a certain threshold (which was allowed to vary according to the data). In both cases, method of robust estimation to deal with the typical inherent problems of heteroskedasticity was used, as indicated in the tables.
In any of the methods, given the lack of direct evidence on the extent of many of the right-hand-side variables and the proxy problems encountered in such studies, we
18
Due to the fact that several observations for IIT have zero value, the logistic function has to be estimated either by non-linear least squares or, alternatively (as in Lee and Lee, 1993 ) by a linear transformation
will be more concerned with signs on relationships and their statistical significance than with the magnitude of the coefficients. In fact, our main purpose is basically to test whether comparative advantage arising from differences in factor endowments between countries may explain VIIT (but not HIIT) and whether horizontal product differentiation accounts for HIIT (but not for VIIT). Accordingly, the results for the variables YD in the cross-country case and Dif in the cross-industry one are crucial.
5.2-Cross-country analysis
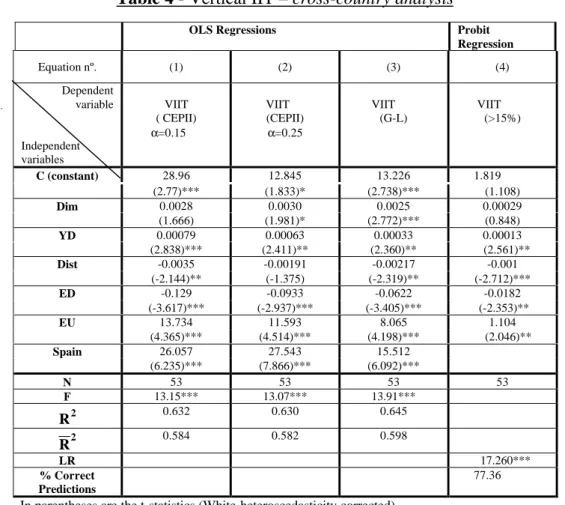
Starting the cross-country study with the analysis of the determinant factors of vertical IIT, let us consider table 4.
Table 4 - Vertical IIT – cross-country analysis
OLS Regressions Probit
Regression Equation nº. (1) (2) (3) (4) Dependent variable Independent variables VIIT ( CEPII) α=0.15 VIIT (CEPII) α=0.25 VIIT (G-L) VIIT (>15%) C (constant) 28.96 12.845 13.226 1.819 (2.77)*** (1.833)* (2.738)*** (1.108) Dim 0.0028 0.0030 0.0025 0.00029 (1.666) (1.981)* (2.772)*** (0.848) YD 0.00079 0.00063 0.00033 0.00013 (2.838)*** (2.411)** (2.360)** (2.561)** Dist -0.0035 -0.00191 -0.00217 -0.001 (-2.144)** (-1.375) (-2.319)** (-2.712)*** ED -0.129 -0.0933 -0.0622 -0.0182 (-3.617)*** (-2.937)*** (-3.405)*** (-2.353)** EU 13.734 11.593 8.065 1.104 (4.365)*** (4.514)*** (4.198)*** (2.046)** Spain 26.057 27.543 15.512 (6.235)*** (7.866)*** (6.092)*** N 53 53 53 53 F 13.15*** 13.07*** 13.91*** R2 0.632 0.630 0.645 R2 0.584 0.582 0.598 LR 17.260*** % Correct Predictions 77.36 In parentheses are the t-statistics (White-heteroscedasticity corrected).
*/**/***-statistically significant, respectively, at 10%, 5% and 1% level.
The general picture for the OLS estimations depicts the consonance between the results of all the regressions, conferring them a high degree of robustness. All variables19
where the zero values of the IIT index are replaced by a very small number (such as 0.0000001). The latter was used in this study.
19
We were forced to exclude a proxy for the difference of market size, most used on this kind of studies, due to evident problems of multicollinearity.
have the expected sign and only Dim (which measures average size of markets) poses doubts on its significance. Synthetically, we find support for the neo-HOS models of Falvey (1981) and Falvey and Kierzkowski (1987) since vertical IIT increases with the difference (in absolute value) between factorial endowments (YD is significant at 1% level in equation (1)). The negative expected relation between distance/transport costs (Dist) is confirmed as well as the negative impact of the difference between the level of development (ED) of the countries. Finally, the evidence confirms that IIT is higher between countries belonging to the same integration space, as depicted in Table 3. The results are also supported by the inclusion of a dummy variable for the relationship of Portugal with the neighbour partner (Spain).
Let us consider now the Probit regressions (assuming as criteria for the existence of VIIT a minimum value of 15%) . In a global overview, we can conclude that there is a great similitude between the results obtained now and the ones emerging from equations (1) to (3). From (4) we conclude that the probability of vertical IIT assuming a weight superior to 15% of the total volume of bilateral trade increases with the difference between factorial endowments and decreases with the distance and the difference of development.
Let us now observe table 5 which presents the results related to horizontal IIT.
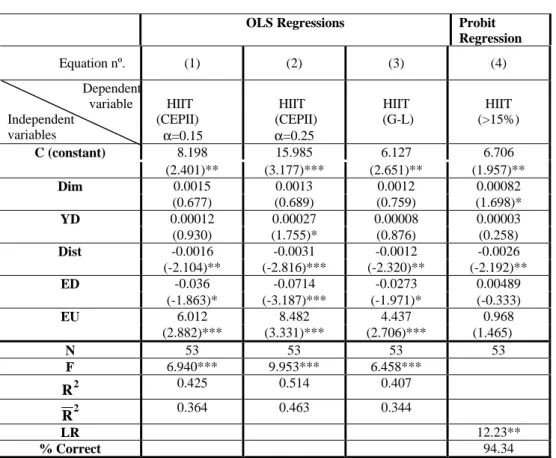
Table 5 - Horizontal IIT – cross-country analysis
OLS Regressions Probit
Regression Equation nº. (1) (2) (3) (4) Dependent variable Independent variables HIIT (CEPII) α=0.15 HIIT (CEPII) α=0.25 HIIT (G-L) HIIT (>15%) C (constant) 8.198 15.985 6.127 6.706 (2.401)** (3.177)*** (2.651)** (1.957)** Dim 0.0015 0.0013 0.0012 0.00082 (0.677) (0.689) (0.759) (1.698)* YD 0.00012 0.00027 0.00008 0.00003 (0.930) (1.755)* (0.876) (0.258) Dist -0.0016 -0.0031 -0.0012 -0.0026 (-2.104)** (-2.816)*** (-2.320)** (-2.192)** ED -0.036 -0.0714 -0.0273 0.00489 (-1.863)* (-3.187)*** (-1.971)* (-0.333) EU 6.012 8.482 4.437 0.968 (2.882)*** (3.331)*** (2.706)*** (1.465) N 53 53 53 53 F 6.940*** 9.953*** 6.458*** R2 0.425 0.514 0.407 R2 0.364 0.463 0.344 LR 12.23** % Correct 94.34
Predictions
In parentheses are the t-statistics (White-heteroscedasticity corrected). */**/***-statistically significant, respectively, at 10%, 5% and 1% level.
In the OLS estimations, once more with exception for the average dimension of the markets (Dim), the signs obtained confirm the expectations. It is important to note the picture of neutrality depicted by the proxy for the difference of factorial endowments (YD), in opposition to what was verified in the case of vertical IIT. Besides, horizontal IIT also varies negatively with the distance (Dist) and the development differential (ED), whereas the dummy variable related to the joint participation in the EU exercises a positive influence. The results in (3)- using Grubel-Lloyd index- reproduce fully (in terms of signs and levels of significance) the ones in (1).
Evaluating now the results obtained with the Probit model (with criteria of 15% as in the case of vertical IIT), we verify that the signs of the variables coincide with the ones for YD and Dist obtained in the analysis in continuous terms.
Considering the clear supremacy of vertical IIT presented in section 4, the results for global IIT are expected to be close to those taking vertical IIT as dependent variable. In fact, we confirmed that they are clearly similar in what concerns the sign and the relevant explanatory variables. Besides, the explanatory power of the model is also quite similar, the adjusted R2 increasing only 1 percent point. This conclusion is valid assuming as a basis for obtaining the dependent variable either the CEPII methodology or the G-L index.
5.3- Cross-industry analysis
The empirical evidence in previous studies (even when the separation between vertical and horizontal IIT is considered) shows that the explanatory power of the regressions for the industry characteristics is inferior to the one of the regressions including the country characteristics as explanatory factors. The results for the Portuguese case confirm that tendency. The existence of relevant omitted variables, the weak adherence between the proxies considered and the concepts to evaluate (the basic concepts of scale economies and product differentiation being just an example), the difficulties in the conversion from trade to industrial nomenclature and the consideration of the characteristics of the industries of a given country (in this case, of Portugal) as representative for every other
country, are some evident problems which are certainly responsible for the poor results usually obtained.
The results for specific country variables related to vertical IIT are presented in table 6:
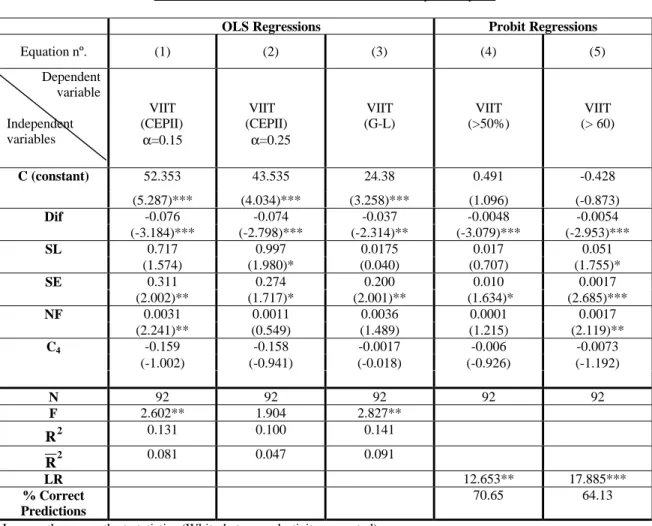
Table 6 - Vertical IIT – cross-industry analysis
OLS Regressions Probit Regressions
Equation nº. (1) (2) (3) (4) (5) Dependent variable Independent variables VIIT (CEPII) α=0.15 VIIT (CEPII) α=0.25 VIIT (G-L) VIIT (>50%) VIIT (> 60) C (constant) 52.353 43.535 24.38 0.491 -0.428 (5.287)*** (4.034)*** (3.258)*** (1.096) (-0.873) Dif -0.076 -0.074 -0.037 -0.0048 -0.0054 (-3.184)*** (-2.798)*** (-2.314)** (-3.079)*** (-2.953)*** SL 0.717 0.997 0.0175 0.017 0.051 (1.574) (1.980)* (0.040) (0.707) (1.755)* SE 0.311 0.274 0.200 0.010 0.0017 (2.002)** (1.717)* (2.001)** (1.634)* (2.685)*** NF 0.0031 0.0011 0.0036 0.0001 0.0017 (2.241)** (0.549) (1.489) (1.215) (2.119)** C4 -0.159 -0.158 -0.0017 -0.006 -0.0073 (-1.002) (-0.941) (-0.018) (-0.926) (-1.192) N 92 92 92 92 92 F 2.602** 1.904 2.827** R2 0.131 0.100 0.141 R2 0.081 0.047 0.091 LR 12.653** 17.885*** % Correct Predictions 70.65 64.13
In parentheses are the t-statistics (White-heteroscedasticity corrected). */**/***-statistically significant, respectively, at 10%, 5% and 1% level.
The first central aspect that must be pointed out in the vertical differentiated case is the fact that, as expected, the proxy used to evaluate the product differentiation concept (Dif) is highly significant with the negative expected sign. It is important to emphasise that the variable Dif was used in many studies as a determinant factor of total IIT with a positive expected sign, due to the prevalent idea that IIT should be associated to the horizontal type of monopolistic competition. If, as confirmed by so many studies, the main component of IIT is vertical, such result ceases to be “surprising”.
As far as the market structure is concerned, the results indicate that vertical IIT is perhaps higher in the sectors where there is a large number of firms (even if this result is not confirmed in all estimations), pointing out to the comparative advantage explanation
of vertical IIT. This variable stops to be significant when larger scope for HIIT is given with the increase of the parameter α (equation (2)) or the use of the alternative G-L index (what gives narrower scope for IIT in general). The neo-factorial variable (skilled labour) is not robust enough to allow a conclusive reading but it suggests, in consonance with the upgrading of the exports identified in section 3, a tendency to a more intensive use of skilled labour, in a country still identified by labour abundance of a less qualified type.
Considering the Probit regressions, we evaluate the factors which explain the probability of occurring VIIT when it is higher, in terms of the total sectoral volume of trade, to 50% (equation(4)) and 60%(equation (5)). The expected positive impact of the variable Dif is clearly supported but evidence for the expected impact of the remaining variables is confirmed only when the existence of VIIT is defined for higher shares of total trade (over 60 %). The obtained results never contradict the OLS estimates.
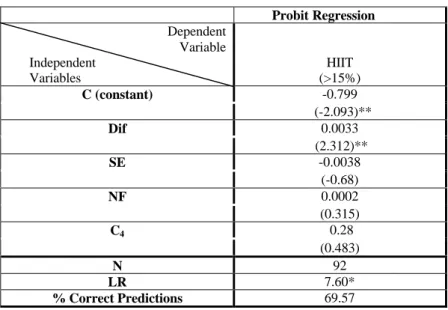
In what concerns the explanation for horizontal IIT in a cross-industry analysis, results are, as usually, not very conclusive. In the present study, we only kept the Probit estimation. In this case we investigate what factors may explain the existence of horizontal IIT with a criterion of 15%. The results are presented in Table 7:
Table 7 - Horizontal IIT – cross-industry analysis
Probit Regression Dependent Variable Independent Variables HIIT (>15%) C (constant) -0.799 (-2.093)** Dif 0.0033 (2.312)** SE -0.0038 (-0.68) NF 0.0002 (0.315) C4 0.28 (0.483) N 92 LR 7.60* % Correct Predictions 69.57
In parentheses are the t-statistics (Eicker-White-heteroscedasticity corrected). */**/***-statistically significant, respectively, at 10%, 5% and 1% level.
What is noteworthy is the fact that the proxy for the differentiation of the product (Dif), as one would expect, is significant with a positive sign. This fact is in evident contrast with the negative sign for this variable (also significant) which we obtained in the case of vertical IIT, proving the advantage of distinguishing the two types of IIT.
Finally we estimated for total IIT as the dependent variable (measured with the CEPII and the G-L indexes) and the results display a total consonance, in terms of the identification of the significant industry specific factors and their respective signs and the explanatory power of the model, with the analysis developed for vertical IIT - an expectable result considering the high weight of this type of IIT.
6- Concluding remarks
In this paper we investigated the nature of the Portuguese intra-industry trade by types and concluded that IIT assumes a relevant and increasing proportion in the Portuguese external trade of the nineties. This is particularly clear when we consider the EU countries. The most important element is perhaps the fact that vertical IIT is clearly the dominant IIT type. This phenomenon occurs in the generality of the bilateral trade relationships, but we registered an important difference between the Portuguese trade with the EU countries and the non-EU countries: in the first case, predominates inferior vertical IIT meaning that, in aggregated terms, the Portuguese exports are of inferior quality to the imports; in the second case, in general, the opposite happens. In spite of the fact that, in average terms, inferior vertical IIT still predominates, mainly in the case of the EU countries that concentrate most of the Portuguese external trade, there was in the 1990’s a clear increase of the importance of superior vertical IIT.
The fact that greater IIT is mainly due to vertical differentiation points out to a specialisation along the quality spectrum and also to the possibility that in this case the Portuguese trade pattern is changing without a significant alteration on the trade determinants, traditionally associated to the factor proportions model. In fact, from the econometric analysis of the determinant factors of IIT, we not only identified distinct explanatory factors for each IIT type but also confirmed that the comparative advantage explanation stands for the vertical case. An interesting result for our case study is also the fact that the upgrading of the exports and the results for the skilled labour variable suggest a tendency towards a more intensive use of the skilled labour.
In accordance with similar studies for other countries, the factors connected with the characteristics of the countries have a higher explanatory power than those associated to the characteristics of the industries. One of the urgent paths to improve this situation is perhaps to proxy specific industry variables by taking into consideration the empirical reality of each partner country.
The robustness of the results was confirmed (i) through alternative measures for the continuous dependent variable; (ii) by re-estimating all equations with a probabilistic model. The reason to use the Probit model is related to the theoretical shortcomings on stipulating the way some of the explanatory variables impact. The fact that the results obtained do not contradict those of the functional forms previously used in this kind of studies gives more confidence to empirical evaluation not only in this particular exercise.
References
Abd-El-Rahman, K. (1984), Échanges intra-sectoriels et échanges de spécialisation dans l´analyse du commerce international: le cas du commerce intra-CEE de biens manufacturés, Thèse de Doctorat d´Etat, Université de Paris X-Nanterre.
Abd-El-Rahman, K. (1986), Réexamen de la définition et de la mesure des échanges croisés de produits similaires entre les nations, Révue Économique, nº. 1, Janvier, pp. 89-115
Aturupane,C., Djankov, S. and Hoekman, B. (1999), Horizontal and Vertical Intra-Industry Trade between Eastern Europe and the European Union, Weltwirtschaftliches Archiv, vol. 135, pp.62-81 Balassa, B. and Bauwens, L. (1988), Changing Trade Patterns in Manufactured Goods: an
Econometric Investigation, Amsterdam: North -Holland.
Blanes, J. and Martín, C. (2000), The Nature and Causes of Intra-Industry Trade: Back to the Comparative Advantage Explanation? The Case of Spain, Weltwirtschaftliches Archiv, vol.136, nº 3, pp.423-441.
Brander, J. (1981), Intra-Industry Trade in Identical Commodities, Journal of International
Economics, 11, pp. 1-14.
Brander, J. and Krugman, P. (1983), A Reciprocal Dumping Model of International Trade,
Journal of International Economics, 15, pp. 313-321.Dixit, A. and Norman, V. (1980), Theory of International Trade – a Dual, General Equilibrium Approach, Cambridge University Press.
Dixit, A. and Stiglitz, J. (1977), Monopolistic Competition and Optimum Product Diversity,
American Economic Review, vol. 67, pp. 297-308.
Eaton, J. and Kierzkowski, H. (1984), Oligopolistic Competition, Product Variety, and International Trade, in H. Kierzkowski (ed), Monopolistic Competition and International Trade, New York: Oxford University Press.
Ethier, W. (1982), National and International Returns to Scale in the Modern Theory of International Trade, American Economic Review, vol. 72, nº 3, June, pp. 389-405.
European Commission (1996), Economic Evaluation of the Internal Market, European Economy, 4.
Falvey, R. (1981), Commercial Policy and Intra-Industry Trade, Journal of International
Economics, vol. 11, nº. 4, pp. 495-511.
Falvey, R. and Kierzkowski, H. (1987), Product Quality, Intra-Industry Trade and (Im)perfect Competition , in Kierzkowski (ed.), Protection and Competition in International Trade, Basil-Blackwell
Fontagné, L. and Freudenberg, M.(1997), IIT: Methodological Issues Reconsidered, CEPII
Working Paper 97/02
Fontagné, F., Freudenberg, M. and Unal-Kesenci, D. (1996), Intermediate Products and Intra-Industry Trade of the Triad: Mesures and Implications, communication presented at “Conférence International en Sorbonne”, 29-30 May.
Fontagné, L. , Freudenberg, M. and Péridy, N. (1998), Intra-Industry Trade and the Single Market: Quality Matters, CEPR Discussion Paper nº 1959
Fontoura, P. and Vaz, E. (1999), Portuguese Trade with European Union: an Analysis of Trade Types and Quality Ranges , Topics on European Economy, vol. 2, CEDIN, ISEG (proceedings) Freudenberg, M. and Müller, F. (1992), France et Allemagne: Quelles Spécialisations Commerciales, Economie Prospective Internationale, nº 52, 4, pp. 7-36.
Greenaway, D., Hine, R. and Milner, C. (1994), Country – Specific Factors and the Pattern of Horizontal and Vertical Intra-Industry Trade in the UK, Weltwirtschaftliches Archiv, vol. 130, nº 1, pp. 77-100.
Greenaway, D., Hine, R. and Milner, C. (1995), Vertical and Horizontal Intra-Industry Trade: A Cross Industry Analysis for the United Kingdom, The Economic Journal, 105, November, pp. 1505-1518.
Greenaway, D. and Milner, C. (1986), The Economics of Intra-Industry Trade, Oxford: Basil – Blackwell.
Grubel, H. and Lloyd, P.(1975), Intra-Industry Trade: The Theory and Measurement of International Trade in Differentiated Products, London : Macmillan
Havrylyshyn, O. and Civan, E. (1983), Intra-Industry Trade and the Stage of Development: a Regression Analysis of Industrial and Developing Countries, in P. Tharakan (ed), Intra-Industry Trade: empirical and methodological aspects, Amesterdam: North-Holland
Helpman, E. (1981), International Trade in the Presence of Product Differentiation, Economies of Scale and Monopolistic Competition - a Chamberlin/Heckscher-Ohlin Approach, Journal of International Economics, 11, pp. 305-340.
Hu, X. and Ma, Y. (1999), International Intra-Industry Trade of China, Welwirtschaftliches Archiv, vol.131, pp. 82-101
Krugman, P. (1979), Increasing Returns, Monopolistic Competition, and Inter-National Trade, Journal of International Economics, vol. 9, pp. 469-479.
Krugman, P. (1980), Scale Economies, Product, Differentiation and the Pattern of Trade, American Economic Review, vol. 70, pp. 950-959.
Krugman, P. (1981), Intra-Industry Specialization and the Gains From Trade, Journal of Political Economy, vol. 89, nº 51, pp. 959-973.
Lancaster, K. (1979), Variety, Equity and Efficiency, Oxford: Basil Blackwell
Lancaster, K. (1980), Intra-Industry Trade under Perfect Monopolistic Competition, Journal of International Economics, vol. 10, pp. 151-175.
Lee, H. and Lee, Y. (1993), Intra-Industry Trade in Manufactures: the case of Korea, Weltwirtschaftliches Archiv, vol. 129, nº 1, pp. 159-171.
Linder, S. (1961), An Essay on Trade and Transformation, New-York: John Willey
Loertscher, R. and Wolter, F. (1980), Determinants of Intra-Industry Trade Among Countries and Across Industries, Welwirtschaftliches Archiv, vol. 116, pp. 280-93.
Porto,M. and Costa,F.(1999), Portugal, in M. Brülhart e R. Hine (eds.), Intra-Industry Trade and Adjustment- the European Experience, Macmillan Press
Shaked, A. and Sutton, J. (1984), Natural Oligopolies and International Trade, in H. Kierzkowski (ed.), Monopolistic Competition and International Trade, Oxford University Press.
Stiglitz, J. (1987), The Causes and Consequences of the Dependence of Quality of Price, The Journal of Economic Literature, 25, pp. 1-48
Venables, A. (1984), Multiple Equilibria in the Theory of International Trade with Monopolistically Competitive Industries, Journal of International Economics, pp. 103-21.