Vol.55, n. 3: pp. 359-370, May-June 2012
ISSN 1516-8913 Printed in Brazil BRAZILIAN ARCHIVES OF
BIOLOGY AND TECHNOLOGY
A N I N T E R N A T I O N A L J O U R N A L
Relationships of Photosynthetic Photon Flux Density, air
Temperature and Humidity with Tomato Leaf Diffusive
Conductance and Temperature
Evandro Zanini Righi
1*, Galileo Adeli Buriol
2, Luiz Roberto Angelocci
3, Arno Bernardo
Heldwein
1and Ivonete Fátima Tazzo
41Departamento de Fitotecnia; Centro de Ciências Rurais; Universidade Federal de Santa Maria; 97105-900; Santa
Maria - RS - Brasil. bCentro Universitário Franciscano; 97010-032; Santa Maria – RS – Brasil. 3Departamento de Engenharia de Biossistemas; Escola Superior de Agricultura “Luiz de Queiroz”; Universidade de São Paulo; 13418-900; Piracicaba – SP – Brasil. 4 Research Technician.
ABSTRACT
The objective was to study the leaf temperature (LT) and leaf diffusive vapor conductance (gs) responses to temperature, humidity and incident flux density of photosynthetically active photons (PPFD) of tomato plants grown without water restriction in a plastic greenhouse in Santa Maria, RS, Brazil. The plants were grown in substrate and irrigated daily. The gs was measured using a steady-state null-balance porometer on the abaxial face of the leaves during the daytime. Both leaf surfaces were measured in one day. The PPFD and LT were measured using the porometer. Leaf temperature was determined using an infrared thermometer, and air temperature and humidity were measured using a thermohygrograph. The leaves on the upper layer of the plants had higher gs than the lower layer. The relationship between the gs and PPFD was different for the two layers in the plants. A consistent relationship between the gs and atmospheric water demand was observed only in the lower layer. The LT tended to be lower than the air temperature. The mean value for the gs was 2.88 times higher on the abaxial than adaxial leaf surface.
Key words: controlled environment, stomatal behavior, air vapor pressure deficit, leaf-to-air vapor pressure deficit
* Corresponding author.[email protected]
INTRODUCTION
Plant transpiration depends on the stomatal opening. In tomatoes grown with good soil water availability, the degree of stomatal opening depends on the photosynthetic photon flux density (PPFD) and air saturation deficit (VPD) or leaf-air vapor pressure difference (LVPD), which is similar to most cultivated plants (Boulard et al. 1991a; Jolliet and Bailey 1992; Streck 2003). Furthermore, the stomatal opening can still be affected by the leaf water potential (Tardieu and Simonneau 1998), which is a variable that relates
to the abscisic acid concentration in the xylem and/or in the leaf tissue (Tardieu and Davies, 1991; Mulholland et al. 2003). In addition, the stomatal opening depends on the CO2 concentration in the substomatal cavity (Turner 1991; Tardieu and Simonneau 1998) and leaf temperature (LT) (Boulard et al. 1991a; Turner 1991; Tardieu and Simonneau 1998).
2003) for these environments, the increase in air temperature (T) (Buriol et al. 1997; Cunha and Escobedo 2003) and reduction of the relative air humidity (Buriol et al. 2000; Cunha and Escobedo 2003) have been observed during the daytime. The variables T, VPD and even the air carbon dioxide concentration (CCO2) can be modified by exchange with the external atmosphere primarily through ventilation management (Fuchs et al. 1997; Buriol et al. 1997; 2000).
In southern Brazil, greenhouses and plastic tunnels are used to produce tropical horticultural species outside of their natural growth season and to protect plants against very low temperatures during the autumn-winter months (Streck et al. 1993). Intense control of greenhouse ventilation is necessary to maintain environmental conditions as close as possible to the required crop conditions especially for T and VPD. In this artificial atmosphere that is not enriched in CO2, the internal concentration of this gas in the substomatal cavity [CCO2] is not typically a limiting factor for stomatal opening because leaf temperature is not high enough to generate a respiration rate higher than the photosynthetic rate as long as water is not restricted (Bakker 1991; Boulard et al. 1991a).
Thus, crop and greenhouse management must consider the responses of a particular species to environmental variables. Further, it is important to know how the leaf diffusive conductance to water vapor (gs) depends on these variables for physiological studies as well as modeling crop evapotranspiration and production for this environment. The objective of this work was to study the leaf temperature and gs responses to temperature, humidity and flux density of photosynthetically active photons of tomato plants grown in a plastic greenhouse without a water restriction in the humid subtropical climate of Santa Maria, RS, Brazil.
MATERIAL AND METHOD
The experiment was performed in a plastic greenhouse in the Experimental Field for the Center for Rural Sciences in the Federal University of Santa Maria (29o42’S, 53o4’W and 95 m of altitude), which is located in the central area of Rio Grande do Sul, Brazil.
The greenhouse was built with a wood frame and covered with 100 µm-thick low-density
polyethylene transparent film (10 m wide and 24 m long) with a 3 m high ridgepole and a 2 m high side wall.
The greenhouse was operated by opening the side walls (24 m2 area on each side from the roof to 1 m from the ground) and front doors (3 m wide and 2 m high), which generated natural ventilation inside. Typically, the walls were opened at approximately 8 AM and closed at 6 PM. For mornings with thick fog, the walls were opened after the fog dissipated or when the temperature increased to at least 25°C. On days with strong winds and/or low temperatures that are harmful to the plants or on cloudy days with moderately cold conditions, the greenhouse remained closed until the wind slowed and/or the temperature increased to at least 20°C. The greenhouse was opened to lower the temperature and reduce air humidity inside to avoid fungal diseases. For porometric measurements, the side walls were opened approximately one hour in advance to accelerate evaporation of the water from the leaves and the inner face of the plastic cover.
The tomato cultivar used was the hybrid Emperor genotype, salad-type, with a determinate growth habit. Sowing was performed on February 1st. The seedlings were definitively transplanted into the greenhouse on February 23rd and 24th and arranged in ten rows towards the length of the greenhouse at 3.33 plants per m2. The plants used to measure leaf diffusive conductance were cultivated in perforated plastic bags with 8 liters of commercial substrate (“Plantmax”) and a 2.5 liter water-holding capacity (Valandro et al. 1999), which corresponds to 7.6 mm. These plants were in three drainage lysimeters (1.5 m long and 0.2 m wide); each lysimeter supported five plants. The lysimeters were used to measure plant transpiration (Righi 2000; Righi et al. 2002) and are described in Valandro et al. (1999). To avoid substrate evaporation, the bags were enclosed with black plastic mulch. Tomato plant water consumption ranged from 0.11 mm d-1 to 3.31 mm d-1 during this period. The water applied ranged from 1.1 mm to 6.5 mm, whereas the water drained ranged from 0.65 mm to 3.77 mm.
substrate, nutrients were supplied by fertigation according to Andriolo and Poerschke (1997). Plants from the central row of the west side of the greenhouse were cultivated in the substrate, and the plants from the other nine rows were cultivated directly in the soil. The soil was fertilized at the time of preparation following laboratory analysis, and the plants (grown in soil) served only as borders.
Irrigation was performed with drippers that were spaced every 0.30 m. The drippers were constructed with catheters 2 mm in diameter and 0.3 m long. The hydraulic charge ranged from 25 kPa to 31 kPa, and the average volumetric flux was 10 l h-1. The plants cultivated in substrate were irrigated early every morning and twice on days with high atmospheric water demand. To guarantee total substrate saturation, water was supplied up to three minutes after drainage began. Irrigation control for the border plants was based on visual appearance and soil consistency with a lower frequency for watering because they had a higher water-holding capacity and larger volume of soil explored by the roots compared with the substrate. More details on the greenhouse and plant management can be found in Righi et al. (2002).
Diffusive resistance (rs), transpiration and leaf temperature (LT) for fully expanded and non-senescent leaves were measured for one plant in each lysimeter using a steady-state, null-balance porometer (Li-1600, Li-Cor Inc.). The measurements were performed on the abaxial surface of eight leaves for the chosen plant two days in March, four days in April and one day in May. For the measurements after April 8th, the leaves were divided into two layers: an upper layer and a lower layer; the middle of the plant was the reference. On May 21st, both leaf faces were measured during the day. The incident PPFD for each leaf was measured using a quantometer coupled to the porometer cuvette, which maintained the leaf in its natural state. For data analysis, the conductance data (gs) were calculated through gs = rs-1.
Immediately after each porometric measurement, the leaf temperature was measured using an infrared thermometer (IRT) (Telatemp Corp., model AG42) and assuming a emissivity of 0.97 for the tomato leaf, as this value was also used for tobacco by Fuchs and Tanner (1966) as well as Idso and Jackson (1968), and approximately 0.96 was measured for the potato by Heldwein (1995).
The measurements were performed by directing the thermometer 0.5 m away from the higher and lower plant layers. Between two subsequent measurements, the thermometer was shaded to avoid increasing its internal temperature (Idso and Jackson, 1968; Jackson and Idso, 1969).
The air temperature, T, and relative humidity were measured using a thermohygrograph (SIAPE - Bologna, Italy) inside a meteorological shelter at the center of the greenhouse 1.5 m above the soil surface. The air vapor pressure deficit VPD (kPa) was calculated as the difference between the saturation pressure of the air estimated using the Tetens equation (Pereira et al. 2002) and the actual vapor pressure, which was estimated from air temperature and relative humidity data. The leaf-to-air vapor pressure difference was calculated using either the mean values for the leaf temperature measured using the porometer (LAVPT) or an infrared thermometer (LAVPIRT) to calculate the internal vapor pressure of the leaf, which is considered the saturation value.
RESULTS AND DISCUSSION
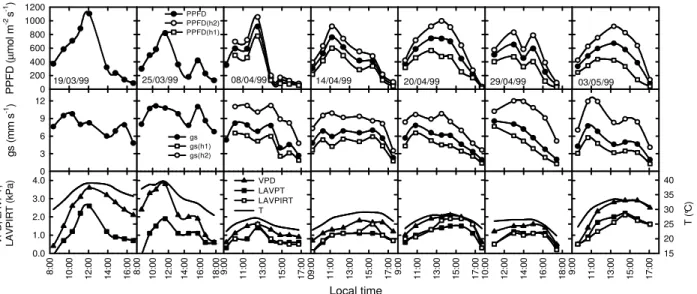
The mean values for PPFD, T and VPD from the approximately hourly measurements ranged from 28.1 µmol m-2 s-1 to 1104.5 µmol m-2 s-1, 21°C to 39.5°C and 0.4 kPa to 3.8 kPa, respectively. On average, the leaves on the upper plant layer were exposed to higher levels of PPFD than those on the lower layer, which led approximately two-fold higher gs values for the upper layer compared with the lower layer (Fig. 1), as noted by Boulard et al. (1991a) in tomato plants. The air vapor pressure deficit and leaf-to-air vapor pressure difference data generated using a porometer (LAVPT) and an infrared thermometer (LAVPIRT) are also shown in Figure 1. The coefficient of variation for each set of measurements (not showed) was higher in the lower layer.
8 :0 0 1 0 :0 0 1 2 :0 0 1 4 :0 0 1 6 :0 0 1 8 :0 0 PPFD PPFD(h2) PPFD(h1) P P F D ( µ m o l m -2 s -1 ) 0 200 400 600 800 1000 1200
19/03/99 25/03/99 08/04/99 14/04/99 20/04/99 29/04/99 03/05/99
g s ( m m s -1) 0 3 6 9 12 8 :0 0 1 0 :0 0 1 2 :0 0 1 4 :0 0 1 6 :0 0 V P D ; L A V P T ; L A V P IR T ( k P a ) 0.0 1.0 2.0 3.0 4.0 Local time 0 9 :0 0 1 1 :0 0 1 3 :0 0 1 5 :0 0 1 7 :0 0 9 :0 0 1 1 :0 0 1 3 :0 0 1 5 :0 0 1 7 :0 0 1 0 :0 0 1 2 :0 0 1 4 :0 0 1 6 :0 0 1 8 :0 0 9 :0 0 1 1 :0 0 1 3 :0 0 1 5 :0 0 1 7 :0 0 T ( °C ) 15 20 25 30 35 40 9 :0 0 1 1 :0 0 1 3 :0 0 1 5 :0 0 1 7 :0 0 VPD LAVPT LAVPIRT T gs gs(h1) gs(h2)
Figure 1 – Time-course of the mean values for photosynthetic photon flux density (PPFD) and
mean leaf diffusive conductance (gs) in each plant layer (lower, h1; higher, h2) as well as air temperature (T), air vapor saturation deficit (VPD), and the leaf-to-air vapor pressure difference determined from the leaf temperature measured in the porometer cuvette (LAVPT) and using the infrared thermometer (LAVPIRT). Santa Maria, 1999.
On March 19th and March 25th negative values for the LAVPT (about -0.1 kPa), which are abnormal for a dry leaf surface, were observed. These values likely resulted from the rapid increase in the air temperature inside the greenhouse due to the high surface areas exposed to the sun, which were not the crop surfaces (such as the greenhouse wood frame, plastic mulch and dry soil in the inter-rows) and have a lower specific heat than leaves. Such values may also have been generated from data acquisition errors especially for air temperature and humidity measured using a thermohygrograph, which has a two hour resolution. Additional errors in leaf temperature measurements may be from heat conduction by the thermocoupler in the porometer cuvette (Tarnopolsky and Seginer, 1999) as well as deficient contact between the leaf thermocoupler. The leaves may also have not been entirely dry at the time of measurement (next to 8:30 AM normal local time), but water was not observed in the leaves surface before the measurements began. An additional error source may have been cuvette ventilation, which can change the leaf boundary layer and consequently the temperature and gs.
Moreover, on March 19th when little energy was available to heat the leaves (approximately 8:30 AM when the PPFD was low) and the VPD was low, the air and leaf temperature tended to be
equal from low or null transpiration. However, on March 25th at approximately 8:30 AM, the VPD and T were high, but the LAVPT and LT – T were negative (see Fig. 5). For a low LT – T value, the leaves must transpire, which is a consequence of saturation pressure in the stomatal cavity that is higher than air vapor pressure (i.e., the LAVPT would be positive). The measurements and/or the thermohygrograph reading errors do not support this result, and it is possible that the leaves were wet during the measurements. Thus, the first measurement sequence at approximately 8:30 AM on March 25th was discarded from the analysis. A positive asymptotic relationship between mean gs and PPFD values is shown in Figure 2, which shows high levels of data scattering. Other variables are consistent with the gs values, primarily temperature and VPD. It was not possible to fit the data better by separating them into narrow VPD and T ranges. Despite the data scattering, gs clearly reaches saturation when PPFD exceeds a threshold at approximately 400 µmol m-2 s-1, which is higher than 200 µmol m-2 s-1 reported by Bakker (1991) for tomato plants grown in a greenhouse.
The lower layer saturation level was unclear and at approximately 350 µmol m-2 s-1 with maximum gs values at approximately 7 mm s-1. The difference between the two layers is likely a consequence of the oldest leaves in the lower layer adapting to the lower levels of incoming radiation.
The relationship between gs and air and leaf temperature (leaf temperature, LT, and infrared leaf temperature, IRT) was not significant. However, when analyzed separately, VPD, LAVPT and LAVPIRT correlated with a decrease in gs measurements for PPFD greater than
400 µmol m-2 s-1 with an increase in these three variables (Fig. 3). In the upper layer, where the leaves are exposed more solar radiation and consequently more thermal and water stress, a clear response from gs to the three variables is expected. However, in Figure 3a only a slight and inconsistent gs reduction with an increase in VPD for the upper layer was measured, which is visually represented by the line. On the other hand, a clear relationship between gs and the three variables was detected in the lower layer (Fig. 3b).
PPFD (µmol m-2 s-1)
0 200 400 600 800 1000 1200
g
s
(
m
m
s
-1)
0 2 4 6 8 10 12
gs = 7.5 (1 - 0.9917PPFD
) R2
= 0.38
Figure 2 – The relationship between the mean leaf diffusive conductance (gs) and the average photosynthetically active photon flux density for all leaves (PPFD). Santa Maria, RS, 1999.
0 2 4 6 8 10 12 14
0 1 2 3 4
gs
(h
2)
(m
m
s
-1)
VPD (kPa)
(a) gs(h1) = -2.1432 LAVPT + 7.6926 (R2= 0.54)
gs(h1) = -1.6543 VPD + 8.0255 (R2= 0.46)
gs(h1) = -2.0026 LAVPIRT + 7.5002 (R2= 0.51)
0 2 4 6 8 10 12 14
0 1 2 3 4
gs
(h
1)
(m
m
s
-1)
VPD, LAVPT(h1), LAVPIRT(h1) (kPa)
gs(h1) X LAVPT gs(h1) X VPD
gs(h1) X LAVPIRT
(b)
Figure 3 – The relationship between the leaf diffusive conductance for the upper plant layer
Leaf water potential measurements would likely be helpful in verifying a plant water deficit, elucidating the basis for the different gs behavior in the two layers and better understanding the role of VPD in tomato crop stomatal control (Streck 2003). Except for May 3rd (irrigation: 3.32 mm; drainage: 1.28 mm; transpiration: 3.31 mm; and reposing irrigation in the next day: 5.23 mm), the water deficit in the rhizosphere can be discarded because the plants were irrigated every morning, and the maximum transpiration was 3.31 mm d-1, which is lower than half the substrate water holding capacity (7.6 mm). On April 20th and 29th, a supplementary irrigation was performed soon after noon (3.58 mm and 2.82 mm total irrigation and 1.48 mm and 1.91 mm drainage; transpiration: 3.20 mm and 2.48 mm, respectively). Furthermore, Ferreira and Katerji (1992) showed that water stress is more harmful than a soil water deficit in tomato plants cultivated in the field due to high atmospheric demand.
Basiouny et al. (1994) observed a decrease in abscisic acid levels for leaf tissues in tomato plants under high levels of PPFD either from excessive or deficient soil water, which partially explains this different behavior. Nan et al. (1999) observed similarly lower tissue abscisic acid (ABA) levels in wheat under high light intensities. Thus, it may be hypothesized that even if induction increased the leaf ABA concentration ([ABA]) in both plant layers under the conditions for this study, the leaves in the upper layer, which were exposed to more sun, would have lower [ABA] values. This would generate higher gs values compared with the lower layer. Basiouny et al. (1994) could not determine if PPFD has an inhibitory effect on the ABA concentration or if other factors are associated to this process. Tardieu and Davies (1992) demonstrated that the leaf ABA concentration is increased by a decrease in leaf water potential. Thus, if the leaf water potential did not reach low values, the PPFD in the upper layer might have reduced the [ABA] levels. gs mildly decreased while PPFD increased only on March 19th and 25th, in which was likely from the VPD (Fig. 1). For these two days, the maximum T was approximately 40°C with a maximum VPD at approximately 3.8 kPa and a maximum LAVPD at approximately 2.6 kPa and of 1.9 kPa, respectively, on March 19th and 25th (Fig. 1). This weak gs decrease may be from a more homogeneous PPFD distribution throughout the leaves due to the reduced leaf area for the plants.
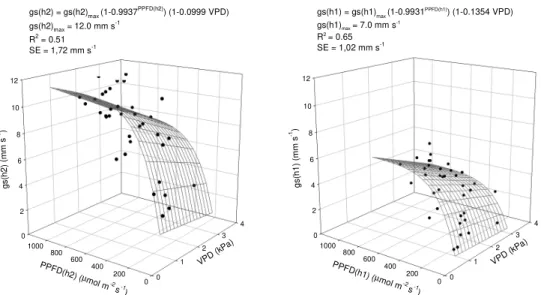
Only after April 20th was the gs decrease clear in the lower layer throughout a large part of the day without a decrease in PPFD and even with lower VPD levels compared with 3.8 kPa, which was observed on March 19th and 25th. On April 20th, the leaf area was approximately 1 m2 per plant, which shaded the lower layer considerably (Fig. 1). Specific modeling for each layer was performed to demonstrate the relationship between gs and VPD as well as PPFD averaged for the specific layer in addition to “response surface” analysis, which was based on “boundary layer analysis” (Jones 1994; Lyra et al. 2003) and Jarvis’ multiplicative model (1976). For each layer, a gs response to VPD (Fig. 4) was detected, which resulted in improved data fit compared with the adjustments from the mean PPFD values (Fig. 2), as demonstrated by the determination coefficients R2 with a standard error (SE) of 1.72 mm s-1 for the upper layer and 1.02 mm s-1 for the lower layer. Thus, it is interesting to separate the layers to fit the gs data with PPFD and VPD.
The exponential coefficient for the PPFD function from the boundary line analysis for the two layers was near the original coefficient from the mean values for the entire plant (Fig. 2). However, the multiplication factors that corresponded to the maximum mean leaf conductance were different: 12 mm s-1 and 7 mm s-1 for the upper and the lower layers, respectively. Therefore, gs has a unique relationship with PPFD. Further, when fitting gs for each layer using the same procedure but considering the mean PPFD for the entire leaf, the relationships and significance were similar: gs(h2) = 12.0 (1-0.9916PPFD) (1-0.1005 VPD) (R2 = 0,52) and gs(h1) = 7.0 (1-0.9950PPFD) (1-0.1447 VPD) (R2 = 0.60).
VPD on gs in the lower layer was evident, as demonstrated by the VPD coefficients.
The stomatal response on March 19th and 25th was different from measurements on other days when comparing the mean gs values. When measurements from those two days were excluded from the gs relationships with the representative environmental variables for the entire plant, the
VPD became significant and generated a better data fit (R2 = 0,54) compared with only using the PPFD (Fig. 2). These results support the hypothesis that PPFD level affect [ABA], which necessitates consideration of this concentration and/or the leaf water potential to generate a more accurate model.
0 2 4 6 8 10 12
0 1
2 3
4
0 200 400 600 800 1000
g
s
(h
2
)
(m
m
s
-1)
VPD (kPa) PPFD
(h2) (µ
mol m-2
s-1
)
gs(h2) = gs(h2)
max (1-0.9937
PPFD(h2)) (1-0.0999 VPD)
gs(h2)max = 12.0 mm s-1
R2 = 0.51
SE = 1,72 mm s-1
0 2 4 6 8 10 12
0 1
2 3
4
0 200 400 600 800 1000
g
s
(h
1
)
(m
m
s
-1)
VPD (kPa)
PPFD(h1) (
µmol m
-2
s-1
)
gs(h1) = gs(h1)max (1-0.9931PPFD(h1)) (1-0.1354 VPD)
gs(h1)max= 7.0 mm s
-1
R2= 0.65
SE = 1,02 mm s-1
Figure 4 – Response surfaces for the leaf diffusive conductance (gs) to photosynthetically active
photons flux density (PPFD) in the upper (h2) and lower (h1) plant layers as well as to the vapor pressure deficit for the air (VPD). The response functions were fit for the variables as shown, where gs(h1)max and gs(h2)max are the maximum values for leaf conductance in the lower and upper plant layers, respectively. These values were generated by considering the fit curve as the “boundary lines” for simple relationships with PPFD(h1) and PPFD(h2). Except for the coefficient -0.0999 for the gs(h2) function, which was significant at 5% probability, the coefficients were significant at 1%. SE is the standard error of the estimate. Santa Maria, 1999.
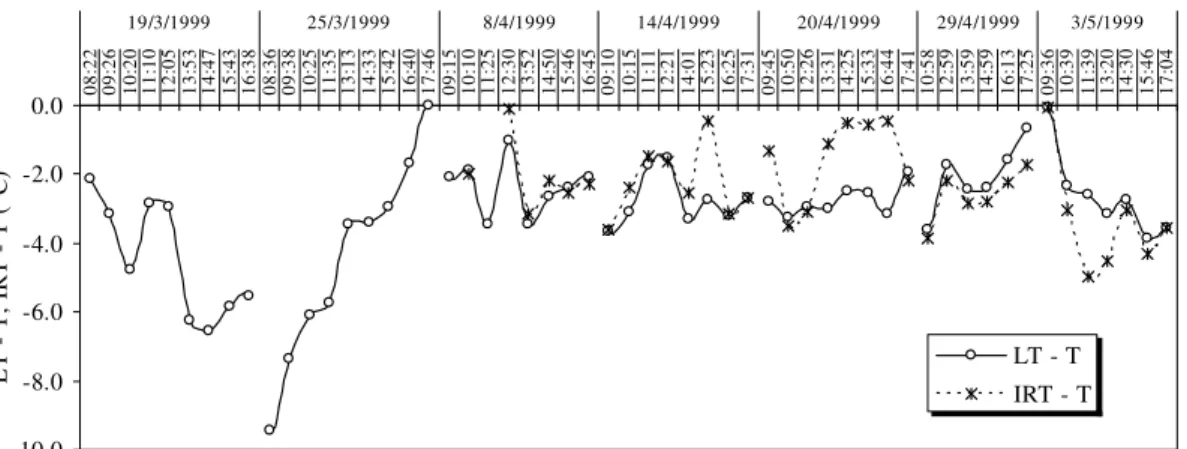
Considering the values of the leaf-air temperature difference [either calculated using the mean leaf temperature from the porometer (LT – T) or infrared thermometry (IRT – T)], the temperature of the plants remained lower than the air temperature T (Fig. 5) except on March 25th and May 3rd. On these days, certain values were close to zero in the early morning or late afternoon when the PPFD and VPD values were relatively low. Thus, the LT – T values close to zero were not a consequence of stress but likely a response to the low energy available for heating the leaves and increasing atmospheric water demand, as demonstrated by the low VPD values (approximately 0.5 kPa) (Idso et al. 1981a; 1981b).
the air is transformed into latent heat for plant transpiration). The PPFD increased during the morning and reduced this effect by heating the leaf and slightly decreasing gs (Fig. 1). Nevertheless, a significant decrease in PPFD was measured between 11:35 AM and 1:13 PM (Fig. 1), which decreased the T and VPD to 35.0°C and 2.1 kPa, respectively (Fig. 1). Consequently, LAVPT decreased from approximately 2.0 kPa to 1.0 kPa, which led to decreased transpiration and an approximation of LT through T by a reduction in sensible heat consumption by transpiration. On March 19th, a similar behavior was observed. In
the morning, the leaves were heated and LAVPT was increased, which generated lower LT – T values compared with the first daily values until approximately 10:20 AM. At approximately 10 AM, the gs slightly decreased (Fig. 1), and in conjunction with a PPFD increase, it generated a higher LT – T. The later PPFD decrease with a moderate LAVPT and high VPD generated a LT – T decrease until 2:40 PM; however, gs slightly decreased at approximately 1:50 PM and 2:47 PM. Thereafter, the LT – T increased until evening likely from the low LAVPT.
-10.0 -8.0 -6.0 -4.0 -2.0 0.0 08 :2 2 09 :2 6 10 :2 0 11 :1 0 12 :0 5 13 :5 3 14 :4 7 15 :4 3 16 :3 8 08 :3 6 09 :3 8 10 :2 5 11 :3 5 13 :1 3 14 :3 3 15 :4 2 16 :4 0 17 :4 6 09 :1 5 10 :1 0 11 :2 5 12 :3 0 13 :5 2 14 :5 0 15 :4 6 16 :4 5 09 :1 0 10 :1 5 11 :1 1 12 :2 1 14 :0 1 15 :2 3 16 :2 5 17 :3 1 09 :4 5 10 :5 0 12 :2 6 13 :3 1 14 :2 5 15 :3 3 16 :4 4 17 :4 1 10 :5 8 12 :5 9 13 :5 9 14 :5 9 16 :1 3 17 :2 5 09 :3 6 10 :3 9 11 :3 9 13 :2 0 14 :3 0 15 :4 6 17 :0 4
19/3/1999 25/3/1999 8/4/1999 14/4/1999 20/4/1999 29/4/1999 3/5/1999
Day/local time L T T , IR T T ( °C )
LT - T IRT - T
Figure 5 – A time-course for the leaf-to-air temperature difference measured using the porometer
(LT – T) and infrared thermometer (IRT – T). T is the air temperature. Santa Maria, RS, 1999.
Leaf cooling was a consequence of the atmospheric water demand, as demonstrated by the straight line fit for the relationship between LT – T and VPD (Fig. 6) (Idso et al. 1981a), which is a “lower baseline” for a non-stressed crop. The equation for this baseline is similar to a watermelon (Orta et al. 2003), wheat (Gontia and Tiwari 2008) and maize (Cárcoma et al. 1998). The linear regression coefficient is the most variable among the cited results likely from the different conditions and crops. According to Jones (1999), these differences are partially from wind speed, which was low when gs was measured. According to Heldwein (1999)2, inside the greenhouse at the experiment site, the wind speeds are typically lower than 0.5 m s-1.
2 HELDWEN, A. B. Personal communication (1999)
between the substrate and the roots cannot be excluded because the region near the roots is drier. Perhaps an additional irrigation at noon could alleviate the effect of high atmospheric water demand in the afternoon. However, additional studies are required to supply adequate information for managing growth of this crop in substrate, including irrigation and greenhouse for high leaf area values and high atmospheric water
demand. For example, under high atmospheric water demand, such as on March 19th and 25th (Fig. 2), if the plants had greater values of leaf area the gs may have responded differently as a function of VPD. Under such conditions, a water nebulizer would likely be necessary to reduce T as well as VPD and to avoid physiological injury to the crop (Boulard et al. 1991b; Katsoulas et al. 2001; Furlan et al. 2001; Streck et al. 2002).
y = -1.23x - 0.87 R² = 0.49
-10.0 -8.0 -6.0 -4.0 -2.0 0.0
0.0 1.0 2.0 3.0 4.0
L
T
-T
(
°C
)
VPD (kPa)
Figure 6 – The relationship between the mean leaf temperature for the two plant layers (LT – T)
measured using the porometer as well as the air temperature (T) using the thermohygrograph and the air vapor pressure deficit (VPD). The square point near the x axis was not considered in the analysis (see the text). Santa Maria, 1999.
The gs values at the adaxial surface of the leaves were lower than at the abaxial surface (Fig. 7). The average ratio between the abaxial and adaxial gs was 2.88 (± 0.95) on May 25th with PPFD ≥ 400 µmol m-2 s-1, which is similar to
Boulard et al.’s observations (1991a); however, they considered average gs values for a PPFD range higher than 700 µmol m-2 s-1 (300 W m-2
above the plants), which were not values observed in these measurements. (Boulard et al. (1991a) considered the resistance values (rs), which are inversely related to gs. Thus, they obtained a ratio for the adaxial and abaxial rs values). In a contradictory result, we observed a lower ratio for the abaxial and adaxial gs with a higher PPFD.
0 2 4 6 8 10
09:26 11:05 12:07 13:40 14:46 15:50 16:52 Local time
gs
(m
m
s
-1)
0 200 400 600
PP
FD
(µ
m
ol
m
-2 s -1)
Abaxial Adaxial PPFD
21/05
Figure 7 – A day time-course for the leaf diffusive conductance (gs) on the abaxial and adaxial
Boulard et al. (1991a) observed the inverse through PPFD ≈ 700 µmol m-2 s-1. The
temperature and VPD were low on the day of these measurements; it is unclear why gs abaxial decreased at approximately 1:40 PM.
Clearly, measurements from a single day are insufficient to draw conclusions on the behavior of adaxial and abaxial gs. The gs difference at both leaf surfaces was primarily from their difference in stomatal density. Bar-Tsur et al. (1985) and Kebede et al. (1994) observed a 1.5- to 2.0-fold greater stomata per leaf area unit for the abaxial surface compared with the adaxial surface. The latter authors did not observe a difference in the pore length between the two surfaces when they were fully open, but the instantaneous stomatal opening can be different, which would facilitate a possible greater control over water loss on the adaxial face and increase the gs ratio to 3 or greater, as observed by Boulard et al. (1991a) and in the present study.
CONCLUSIONS
- The upper layer tomato plant leaves had average incident photosynthetic photon flux density values two-fold higher than the lower layer.
- Different relationships between the leaf diffusive conductance (gs) and incident photosynthetic photon flux density in the leaves were observed for the upper and lower layers of the tomato plant. - The maximum leaf conductance was approximately 12 mm s-1 in the upper plant layer and approximately 7 mm s-1 in the lower plant layer.
- In the upper plant layer, a weak relationship was observed between leaf diffusive conductance and air vapor pressure deficit (VPD); in the lower layer, a more consistent relationship between leaf conductance and VPD as well as leaf-to-air vapor pressure difference was observed.
- The gs values for the upper plant layer were higher than the lower layer.
- The leaf temperature was lower than the air temperature.
- A linear relationship was observed between the leaf-to-air temperature difference and VPD with an increase in the difference with higher VPD values.
- On average, the gs values were three times higher on the abaxial than adaxial leaf surface.
ACKNOWLEDGEMENTS
To Dr. Silvio Steinmetz and the Empresa Brasileira de Pesquisa Agropecuária – EMBRAPA for providing the infrared thermometer.
REFERENCES
Andriolo JL, Poerschke PRC. Farming of tomato in substratum. Santa Maria: UFSM – Centro de Ciências Rurais (Technical report, 2); 1997. (In Portuguese) Bakker JC. Leaf conductance of four glasshouse
vegetable crops as affected by air humidity. Agric For Meteorol. 1991; 55: 23–36.
Bar-Tsur A, Rudich J, Bravdo B. Photosyntesis, transpiration and stomatal resistance to gas exchange in tomato plants under high temperatures. J Hortic Sci. 1985; 60(3): 405-410.
Basiouny FM, Basiouny K, Maloney M. Influence of water stress on abscisic acid and ethylene production in tomato under different PAR levels. J Hortic Sci. 1994; 69(3): 535- 541.
Bergonci JI, Bergamaschi H, Dillenburg LR, Santos AO. Canopy-air temperature difference as an indicator of water deficit in maize. Rev Bras Agromet. 1999; 7(1): 5-11. (In Portuguese, with summary in English).
Boulard T, Baille A, Mermier M, Villette F. Mesures et modélisation de la résistance stomatique foliaire et de la transpiration d’un couvert de tomates de serre. Agronomie. 1991a; 11: 259-274.
Boulard T, Baille A, Le Gall F. Étude de différentes methods de refroidissement su le climat et la transpiration de tomates de serre. Agronomie. 1991b; 11: 543-53.
Buriol GA, Streck NA, Petry C, Schneider FM. Solar radiation transmissivity through low density polyethilene used in greenhouses. Ciênc Rural. 1995; 25(1): 1-4. (In Portuguese, with summary in English). Buriol GA, Luft SVL, Heldwein AB, Streck NA, Schneider FM. Effect of ventilation of polyethilene low tunnels on microenvironment and lettuce growth. Rev Bras Agromet. 1997; 5(1): 17-24. (In Portuguese, with summary in English).
Buriol GA, Righi EZ, Shneider FM, Streck NA, Heldwein AB, Estefanel V. Modifying the relative air humidity by using and managing a plastic greenhouse. Rev Bras Agromet.2000; 8(1): 11-18. (In Portuguese, with summary in English).
Cunha AR, Escobedo J F. Micrometeorological alterations caused by a plastic greenhouse and its effects in the growth and production of sweet pepper. Rev Bras Agromet. 2003; 11(1): 15-26. (In Portuguese, with summary in English).
Ferreira MI, Katerji N. Is stomatal conductance in tomato crop controlled by soil or atmosphere? Oecologia. 1992; 92: 104-107.
Fuchs M, Dayan E, Shmuel D, Zipori I. Effects of the ventilation on the energy balance of a greenhouse with bares oil. Agric For Meteorol. 1997. 86: 273-282.
Furlan RA, Folegatti MV, Sentelhas PC. Effect of fog-system and natural ventilation on air temperature cooling in greenhouse. Rev Bras Agromet. 2001; 9(2): 181-186. (In Portuguese, with summary in English). Gates DM. Biophysical Ecology, New York: Spring
Verlag, 2003.
Gontia NK, Tiwari KN. Developmento of crop water stress índex of wheat crop for scheduling irrigation using infrared thermometry. Agric Water Manage. 2008; 95: 1144-1152.
Heldwein AB. Determination of thermal emissivity coeficients of potato and sunflower leaves. Rev Bras Agromet. 1995; 3: 63-66. (In Portuguese, with summary in English).
Idso SB, Jackson RD, Pinter PJ, Hatfield JL. Normalizing the stress-degree-day parameter for environmental variability. Agric Meteorol. 1981a; 24: 45-55.
Idso SB, Reginato RJ, Jackson RD, Pinter Jr. PJ. Foliage and air temperatures: evidence for a dynamic “equivalence point”. Agric Meteorol. 1981b; 24: 223-226.
Idso SB, Jackson RD. Significance of flutuations in sky radiance emittance for infrared thermometry. Agron J. 1968; 60: 388-392.
Jackson RD, Idso SB. Ambient temperature effects in infrared thermometry. Agron J. 1969; 61: 324-325. Jarvis PG. The interpretation of the variations in leaf
area water potential and stomatal conductance found in canopies in the field. Philos. Trans R Soc London. 1976; 273(Ser. B): 595-610.
Jolliet O, Bailey BJ. The effect of climate on tomato transpiration in greenhouses: measurements and models comparison. Agric For Meteorol. 1992; 58: 43-62.
Jones GH. Plants and microclimate: a quantitative approach to environmental plant physiology. 2nd ed. Cambridge: Cambridge University Press; 1994. Jones GH. Use of infrared thermometry for estimation
of stomatal conductance as a possible aid to irrigation scheduling. Agric For Meteorol. 1999; 95: 139-149. Katsoulas N, Baille A, Kittas C. Effect of misting on
transpiration and conductances of a greenhouse rose canopy. Agric For Meteorol. 2001; 106: 233-247.
Kebede H, Martin B, Nienhuis J, King G. Leaf anatomy of two Lycopersicon species with contrasting gas exchange properties. Crop Sci. 1994; 34: 108-113. Lyra GB, Ribeiro RV, Pereira AR, Oliveira RF de,
Santiago AV. Modelagem da resistência estomática à difusão de vapor d‟água da grama batatais em função das variáveis ambientais. In: XIII Congresso Brasileiro de Agrometeorologia: ... XIII Congresso Brasileiro de Agrometeorologia; 2003; Santa Maria: Sociedade Brasileira de Agrometeorologia/UFSM; 2003. p.217-218. (In Portuguese).
Mulholland BJ, Taylor IA, Jackson AC, Thompson AJ. Can ABA mediate responses of salinity stressed tomato. Environ Exp Bot. 2003; 50: 17-28.
Nan R, Carman JG, Salisbury JB. Low irradiances affect abscisic acid, indole-3-acidic acid, and cytokinin levels of wheat (Triticum aestivum L.) tissues. J Plant Physiol. 1999; 155: 556-560.
Orta AH, Erdem Y, Erdem T. Crop water stress index for watermelon. Sci Hortic. 2003; 98: 121-130. Pereira AR, Angelocci LR, Sentelhas PC.
Agrometeorologia: Fundamentos e Aplicações Práticas. Guaíba: Editora Agropecuária; 2002. (In Portuguese).
Righi EZ, Angelocci LR, Buriol GA, Heldwein AB. Transpiration of tomato growing in plastic greenhouse and relationships with solar radiation and air vapour pressure deficit. Rev Bras Agromet. 2002; 10(1): 9-18. (In Portuguese, with summary in English)
Righi EZ. Water consumption of tomato plants (Lycopersicon esculentum Mill) cultivated in a plastic greenhouse and its relationship with meteorological variables in Santa Maria, RS, Brazil. [Msc. Dissertation]. Piracicaba, Brazil: Escola Superior “Luiz de Queiroz”, Universidade de São Paulo; 2000 (In Portuguese, with summary in English).
Schneider FM, Buriol GA, Andriolo JL, Estefanel V, Streck NA. Soil temperature modification caused by low density transparent polyethylene greenhouses in Santa Maria, RS. Rev Bras Agromet. 1993; 1(1): 37-42. (In Portuguese, with summary in English). Streck NA, Schneider FM, Buriol GA. Soil temperature
modification caused by solarization in nurseries, Ciênc Rural. 1993; 23(3): 385-386.
Streck L, Schneider FM, Tazzo IF, Buriol GA, Heldwein AB, Garlet F. Technology to decrease the high air temperature inside plastic greenhouse. Rev Bras Agromet. 2002; 10(2): 207-214. (In Portuguese, with summary in English).
Streck NA. Stomatal response to water vapor pressure deficit: an unsolved issue, Rev Bras Agroc. 2003; 9(4): 317-322.
Tardieu F, Simonneau T. Variability among species of stomatal control under fluctuating soil water status and evaporative demand: modeling isohydric and anisohydric behaviours. J Exp Bot. 1998; 49(Special Issue): 419-432.
Tarnopolsky M, Seginer I. Leaf temperature error from heat conduction along thermocouple wires. Agric For Meteorol. 1999; 93: 185-194.
Turner N. Measurement and influence of environmental and plant factors on stomatal conductance in the field. Agric For Meteorol. 1991; 54: 137-154.
Valandro J, Andriolo JL, Buriol GA. A simple set-up to measure transpiration of horticultural crops growing in substrate culture. Rev Bras Agromet. 1999; 7(2): 189-193. (In Portuguese, with summary in English).