Revista Brasileira de
Engenharia Agrícola e Ambiental
Campina Grande, PB, UAEA/UFCG – http://www.agriambi.com.br
v.20, n.3, p.256–262, 2016
Thermal environment in two broiler barns during
the first three weeks of age
Robinson Osorio H.
1, Ilda F. F. Tinoco
1, Jairo A. Osorio S.
2,
Luciano B. Mendes
3, Keller S. O. Rocha
1& Lina M. Guerra G.
1 DOI: http://dx.doi.org/10.1590/1807-1929/agriambi.v20n3p256-262A B S T R A C T
The objective of this research was to evaluate the internal thermal environment of two broiler barns featuring different ventilation systems representative of Brazilian and South American poultry production industry: (a) a negative-pressure tunnel and (b) a positive-pressure lateral ventilation system. Environmental parameters such as dry bulb temperature, relative humidity and temperature-humidity index were assessed; temperature maps for day and night average conditions were determined for the first three weeks of life. Better uniformity of the thermal environment and comfort conditions inside the negative-pressure tunnel were found.
Ambiente térmico em dois galpões de frangos
de corte nas três primeiras semanas de vida
R E S U M O
Objetivou-se, nesta pesquisa, avaliar o ambiente térmico interno de dois galpões de frangos de corte com diferentes sistemas de ventilação representativos da indústria de produção de aves de corte brasileira e sul-americana: (a) um com pressão negativa tipo túnel e (b) outro com ventilação lateral e pressão positiva. Parâmetros ambientais do conforto térmico, tais como temperatura de bulbo seco, umidade relativa e índice de temperatura e umidade, foram avaliados; mapas de temperaturas médias para as condições de dia e noite foram determinadas nas três primeiras semanas de vida das aves. Melhor uniformidade ambiental e condições de conforto térmico no interior do galpão com pressão negativa foram observadas.
Key words:
thermal comfort poultry production bioclimatic conditions
Palavras-chave:
conforto térmico produção avícola condições bioclimáticas
1 Universidade Federal de Viçosa/Departamento de Engenharia Agrícola. Viçosa, MG. E-mail: [email protected]; [email protected];
[email protected]; [email protected]
2 Universidad Nacional de Colombia. Medellín, Colombia. E-mail: [email protected]
3 International Institute of Applied Systems Analysis/Ecosystem Services and Management/Mitigation of Greenhouse Gases and Air Pollutants. Laxenburg,
Austria. E-mail: [email protected] (Corresponding author)
Introduction
Broiler chickens, like all warm-blooded animals, seek to maintain a constant body temperature at minimum effort by the thermoregulatory mechanisms (Baêta & Souza, 2010). There is a range of ambient dry bulb temperature (Tdb) in which broiler chickens show better performance with less energy expenditure and minimal effort of thermoregulatory mechanisms, enabling better feed conversion, rapid body growth and lower mortality. This Tdb range is known as the thermal comfort zone (Tinôco et al., 2004). In conditions of heat stress, broilers present symptoms such as panting, wings spreading, reduced feed intake, loss of body weight associated with reduced weight gain rate, etc. (Lara & Rostagno, 2013).
Conversely, under cold stress conditions, broilers attempt to maintain homoeothermia through increased heat production and consumption of energy (feed) and reducing heat loss. Some of the regulatory mechanisms include remaining still, huddling together and avoidance of drafts (Brody, 1945).
The first days of life of broilers demand more care and attention by the producer, as damages due to management errors at this stage cannot be corrected in the future, thus affecting the final performance of the birds through delayed weight gain and/or emergence of diseases caused by cold stress (Tinôco et al., 2004). Therefore, for much of the year, attention should be given to heating the internal environment of the broiler barns, particularly during the first weeks of life (Vigoderis et al., 2010; Menegali et al., 2013).
It is important that animal operation systems provide appropriate environmental conditions, keeping Tdb in the thermal comfort zone (Damasceno et al., 2014). Although Tdb is indicative of thermal condition, it does not fully reflect the thermal feeling of the animals, as other bioclimatic variables strongly influence comfort, such as relative humidity (RH), air speed and irradiative heat. When monitoring environment of broiler chickens, in addition to the use of Tdb sensors, it is important to have at least one RH sensor in order to obtain a more accurate indication of the bioclimatic conditions. There are several environmental indexes that relate the condition of thermal comfort to Tdb, RH, solar radiation and wind speed (Campos et al., 2013; Passini et al., 2013). The temperature humidity index (THI) introduced by Thom (1959) only requires measurement of Tdb and wet bulb temperature (Twb). In Brazil, as in most of South America, THI is the most widely used index due to its simplicity (Medeiros et al., 2005; Furtado et al., 2006; Oliveira et al., 2006; Jácome et al., 2007; Silva et al., 2007; Menegali et al., 2009; Nascimento et al., 2011; Menegali et al, 2013).
In addition to the thermal comfort indexes, information on thermal variability in space (Saraz et al., 2011) and the development of spatial distribution profiles of environmental parameters can provide support on the appropriate management of confined animals in livestock barns (Faria et al., 2008). Studying the distribution profile of environmental variables may help determining climatically suitable areas for animals and help in decision-making of the appropriate positioning of sensors and design of facilities to improve animal comfort and production.
This study aimed at evaluating the distribution profile of thermal variables in two different broiler barns featuring different ventilation systems (mechanical and natural), both of which are representative of Brazil and South America.
Material and Methods
In order to achieve the objective of this study, an experiment was performed on a commercial farm at an integrated food company in the state of Minas Gerais, Brazil. The municipality is called São Geraldo, located at latitude 20° 55 'S and longitude 42° 50' W, 380 m above sea level. The local climate is classified by the Köppen’s System as Aw (typically tropical). The experiment lasted for 22 days and was performed in the month of September 2011.
Two barns were investigated, each featuring a different ventilation system: one with negative-pressure tunnel ventilation (NPTV) and another one with positive-pressure, or natural, lateral ventilation (PPLV). Both barns are east-west oriented, 30 m apart from each other, and littered with first time use coffee hulls. The brooding area of the barns had inner polyethylene curtains marking the space reserved for rearing chicks, reducing the area to be heated during the warm up period of the first ten days of life.
The NPTV barn was 14 m wide and 110 m long, and had a ceiling height of 2.45 m and brooding area: 52 m length × 14 m width. It was equipped with an external heating system based on firewood, connected to a two-pipe system carrying hot air (75 °C) into the barn ventilated airspace, with a flow rate of approximately 6800 m3 h-1. The barn had a population of 23,000 Cobb® chicks, and hence an approximate stocking density of 31 birds m-2 (Figure 1A).
The PPLV barn was 12 m wide by 76 m long, with a ceiling height of 2.45 m, brooding area: 38 m length × 12 m width, and ceramic tile roof. It was heated by an internal tubular system (35 m length) placed at the central axis of the brooding area, and connected to a cylindrical furnace (1.3 m length × 1.0 m diameter), also working with wood combustion. It had an average flow of 850 m3 h-1, distributing hot air at 50 °C. The barn was populated with about 10,500 chicks, yielding an approximate stocking density of 23 birds m-2 (Figure 1B). After the 10th day of life, the heating system was deactivated, and the brooding area was increased as to occupy the entire area in both poultry barns.
The heating systems in both barns were manually operated. The furnaces were turned on when Tdb trespassed the lower limit of the thermoneutral zone established by Abreu & Abreu (2011). During the experiment, the heating systems were active mostly during night time but also during a few exceptionally cold days. More information on the description of the ventilation systems for the barns used in this study can be found in Mendes et al. (2014a,b). During the first 10 days of life, the ventilation in both barns was kept at a minimum, while in the third week, the NPTV system was activated and the curtains of PPVL were dropped down to allow incoming flow of wind.
range of -10 to 85 °C) and RH sensors (HIH4000, accuracy of ± 2% in the measuring range is 0 to 100%) were uniformly and equidistantly installed inside both barns at the average height of the birds (0.20 m from the floor). The sensors were arranged in a grid spaced 10.5 m in length and 4 m in width, being the total number of Tdb and RH sensors installed in the PPLV and NPTV barns 24 and 14, respectively. A Tdb and RH sensor was also installed in a weather station located between both barns (15 m of distance from each barn, at 1.5 m height) in order to monitor external environmental conditions. The sensors were connected to a grid of data transmission via 1-WireTM technology.
The sampling grid was connected to computers and through the software STRADA, developed by Rocha et al. (2008), the acquisition and transmission of data were performed. Tdb and RH information were collected at every 2 s uninterruptedly for a period of 22 d.
The formula developed by Thom (1959) was used to calculate THI (Eq. 1). From the collected and calculated data, Tdb, RH and THI plots were made to describe average barn thermal environment during the day and night conditions in each of the three experimental weeks for each type of barn. Twb was calculated via the psychometrical relationships between Tdb and RH, as described by Campbell & Norman, (2000).
variability during the first three weeks of life, at day- and nighttime conditions.
Results and Discussion
Outdoor and average indoor Tdb, along with the tempe-rature difference between indoor and outdoor (ΔT) for the first 3 weeks of age of the chicks housed in the NPTV and PPLV are shown in Figure 2. ΔT values indicates the thermal insulation capacity of the building, i.e., how the average air temperature at the animal influence zone is affected by the outside temperature. Average ΔT values for the NPTV and PPLV were 4.7 ± 2.9 oC and 4.2 ± 4.1 oC, respectively. These values are similar to those found by Green et al. (2009), which ranged between 4.3 ± 0.4 oC, for laying hens raised on littered floors, in the United States. Conversely, for high rise or manure belt barns where the hens were raised in cages, Green et al. (2009) found ΔT values of 20.6 ± 0.8 oC and 22 ± 1 oC, respectively. These relatively higher ΔT
values, compared to those of this study, presumably arrived from a higher number of hens per volume of air in the barns monitored by Green et al. (2009), and better thermal insulation of poultry barns built in temperate regions, such as the United States.
Even though both types of barns had similar ΔT averages, a higher standard deviation for the PPLV suggests that the Tdb was more susceptible to changes in the outside conditions. This outcome stems from the fact that, although the two barns are thermally insulated with curtains of the same material during the first 10 days, the natural, wind-driven ventilation of the PPLV barn that took place after the 10th day caused indoor conditions to vary as much as the outdoor conditions (Karlsson et al., 2013). Conversely, the NPTV shows a more stable thermal behavior over time, due to a greater thermal inertia and improved heating and ventilation system, compared to the PPLV barn. This can also be observed in Figure 2.
Additionally, in Figure 2, it can be seen that for the first week of the birds’ life, the indoor Tdb of the NPTV barn was relatively higher than that of the PPLV barn, which was confirmed by the statistical analysis. Results of the test of means (Table 1) indicated that there is a significant difference between the average Tdb between barns; furthermore, both barns presented significantly different Tdb in relation to the external environment as well.
In Figure 3, one sees the spatial distribution of Tdb, RH and THI during the first week of age for the PPLV (Figure 3A) and NPTV (Figure 3B) barns. According to Abreu & Abreu (2011), the ideal temperature for broilers during the first week of life ranges between 30 and 33 °C. This is consistent with Cassuce (2011), who states that the comfort zone temperature for the first week of chickens' life is between 31.3 °C and 33 °C. These authors add that the ideal RH must remain between 50 and 70%, and, according to Abreu (2003), THI should remain between 72 and 80. Concerning the NPTV, it was observed that most of the brooding area presented values for Tdb and THI within the comfort range. However, the variable RH in some places was Figure 1. Layout of the negative-pressure tunnel ventilation
(NPTV) barn with heating system (A) and layout of the positive-pressure lateral ventilation (PPLV) barn with a tubular heater (B)
(
db wb)
THI=0.72 T +T +40.6
where:
THI - temperature and humidity index, dimensionless; Tdb - dry bulb temperature, °C; and
Twb - wet bulb temperature, °C.
slightly lower (40%). For the PPLV barn, it appears that within the brooding area, both day and night THI and Tdb stayed within the comfort zone only in the regions next to the heater, with cold stress conditions in most of the brooding area, including corners and near the curtains, evidencing a reduced effect of thermal insulation and low thermal inertia. In addition, RH in some places was a slightly low. Similar outcomes were observed by Coelho et al. (2015), when performing real-time monitoring of the thermal environment in a naturally ventilated laying hen barns in the Brazilian state of Goiás.
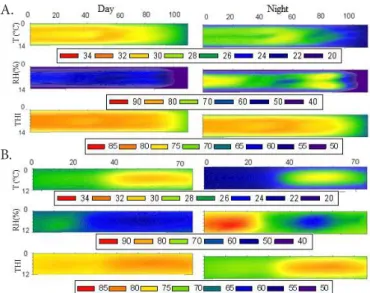
Maps of Tdb, RH and THI for the day and night time conditions during the second week of life are shown in Figures 4A and 4B for the NPTV and PPLV barns, respectively. According to Abreu & Abreu (2011), the ideal Tdb for broilers during the second week of life is between 28 and 30 °C, the RH must be between 50 and 70%, according to Abreu (2003), and the ideal THI must remain between 68.4 and 76. For the NPTV barn, it was observed that within the brooding area, daytime Tdb and THI were within the comfort zone, while RH increased slightly. However, during the night, Tdb was relatively lower, while THI remained within the comfort zone, helped by higher RH. The conditions in the PPLV barn were the same as in the first week. Within the brooding area both day and night Tdb and THI stayed within the comfort zone only in regions close to the heater, with stressful conditions in the corners and near the curtains. This inconsistency can be explained by the type of heating system and poor insulating wall materials. The RH remained constant within the zone considered adequate for the birds.
Figure 2. Temporal variation of indoor and outdoor air dry bulb temperatures (Tdb, oC), temperature difference
(ΔT, oC) (A) and relative humidity (RH, %) (B) for the negative-pressure tunnel ventilation (NPTV) barn. Temporal variation of (Tdb, oC), temperature difference
(ΔT, oC) (C) and relative humidity (RH, %) (D) for the positive-pressure lateral ventilation (PPLV) barn (right) D.
C. A.
B.
Table 1. Test of means for dry bulb temperatures (Tdb, oC)
during the first three weeks of life
*Number of observations; **Standard deviation of the mean. Means followed by different letters differ by Tukey test at 0.05 probability
Figure 3. Map of air dry bulb temperature (Tdb, oC), relative humidity (RH, %) and temperature and humidity index (THI) inside the negative-pressure tunnel ventilation (NPTV) barn (A) and the positive-pressure lateral ventilation (PPLV)
barn (B), during the first week of life, for day and night
periods
Obs.: Measurements took place during the first three weeks of age of the birds
A.
Figures 5A and 5B present the maps of the mean values of Tdb, RH and THI, for day and night time conditions, during the third week of life of chickens in NPTV and PPLV barns, respectively. According to Abreu & Abreu (2011), the ideal Tdb for broilers during the third week of life is between 26 and 28 °C, and the air RH is ideally between 50 and 70%, while THI is ideal between 64 and 72. Regarding the NPTV barn, temperature and THI within the brooding area during day and night remained under thermoneutral conditions. However, it was still relatively colder near the air inlet, while at the outlet it was warmer, due to the contribution of the heat generated by the animals. Air RH increased near the air inlet, remaining out of the comfort zone. Considering the PPLV barn, it was
observed that during the day time Tdb, RH and THI stayed within the comfort zone, but at night thermal stress conditions prevailed, with Tdb below the comfort zone and a high RH. Conversely, the THI was aided by high RH, improving animals' thermal sensation.
Figures 6A, 6B and 6C show boxplots for the Tdb, RH and THI, respectively, for the first three weeks of life of the birds. It can be seen that all three variables presented greater variability in the PPLV, especially during the firsts two weeks, in which the heating system was active, and cold stress conditions were present, at night time. This outcome was in agreement with the results of several studies, including Abreu (2003), Cordeiro et al. (2010), Abreu & Abreu (2011), Cassuce, (2011), Campos et al. (2013) and Osorio et al. (2013). Namely, the lack
Figure 4. Map of air dry bulb temperature (Tdb), relative humidity (RH, %) and temperature and humidity index (THI) inside the negative-pressure tunnel ventilation (NPTV) barn (A) and the positive-pressure lateral ventilation (PPLV)
barn (B), during the second week of life, for day and night
periods
Figure 5. Map of air dry bulb temperature (Tdb, oC), relative humidity (RH, %) and temperature and humidity index (THI) inside the negative-pressure tunnel ventilation (NPTV) barn (A) and the positive-pressure lateral ventilation (PPLV)
barn (B), during the third week of life, for day and night
periods
Figure 6. Box-plots for temperature and humidity index (THI) (A), relative humidity (RH, %)(B) and dry-bulb temperature (Tdb, oC) (C) during the first three weeks of age
C. B. A. A.
B.
A.
of appropriate thermal insulation compromised the internal thermal environment of the barns in the initial phase.
The NPTV barn seemed to be more comfortable for the animals in the first two weeks, where a more uniform distribution of RH and THI was found. However, both barns presented a condition of moderate heat stress for the chickens during the third week (Abreu, 2003; Abreu & Abreu, 2011; Cassuce, 2011), likely due to increased heat production from chickens and an increase in RH.
The data from Figure 6 can be used to validate the graphical information of the maps and confirm that: heating an aviary is not an easy task, mainly because they are usually poorly insulated (Cordeiro et al., 2010). In many cases, the barns are equipped with undersized heating systems and present air circulation problems (Osorio et al., 2013). Poor insulation capacity of sides and roofing systems associated with limited ventilation control and low thermal inertia might have caused the oscillations in indoor temperatures during night time observed in this study.
Since the curtain material of the two barns was polyethylene, which has a relatively low thermal resistance (2.89 m2 K W-1), the uniformity and thermal condition derived mainly from the internal characteristics of the brooding area. The observed non-uniformity within the PPLV barn may have stemmed from several reasons: (1) the brooding area was in a corner of the house, thus increasing the heat transfer area to the external environment, (2) the heating system was undersized, and/or (3) the presence of a minimum ventilation system that led to non-homogeneous flow patterns with in the brooding area.
Conclusions
1. Regardless of the type of installation, mapping the environmental variables inside the barns proved to be a useful evaluation tool.
2. The typology of the barn with a negative-pressure tunnel provided better heat distribution and better thermal comfort conditions than that with positive-pressure ventilation.
3. Greater attention should be given to the type of insulation used in poultry barns.
4. The brooding areas should not be located at the ends of the buildings, in order to reduce heat losses, improve comfort conditions and heating efficiency.
Acknowledgments
The authors thank the Department of Agricultural Engi-neering of the Federal University of Viçosa, the Department of Agricultural and Food Engineering of the National University of Colombia for their assistance and the Brazilian government agencies that supported the research, CAPES, FAPEMIG, and CNPq. Gratitude is also acknowledged to the Pif-Paf Food Company for its valuable assistance in the development of this research. The authors also would like to thank the anonymous reviewers for carefully looking at the manuscript in its preparation phases.
Literature Cited
Abreu, N. V. M.; Abreu, P. G. Os desafios da ambiência sobre os sistemas de aves no Brasil. Revista Brasileira de Zootecnia, v.40, p.1-14. 2011. Abreu, P. G. Modelos de aquecimento. In: Simpósio Brasil Sul de
Avicultura. Chapeco, 4, 2003, Anais. Chapecó: Embrapa Suínos e Aves, 2003. p.65-77.
Baêta, F. C.; Souza, C. F. Ambiência em edificações rurais: Conforto animal. Viçosa: Universidade Federal de Viçosa, 2010. 269p. Brody, S. Bioenergetics and growth: With special reference to the
efficiency complex in domestic animals. New York: Reinhold. 1945. 1023p.
Campbell, G. S.; Norman, J. M. An introduction to environmental biophysics, 2.ed. Springer, 2000. 286p.
Campos, A. T.; Klosowski, É. S.; Sousa, F. A.; Ponciano, P. F.; Navarini, F. C.; Yanagi Júnior, T. Auxiliary heating system efficiency for poultry housing, based on thermal indexes. Bioscience Journal, v.29, p.703-711. 2013.
Cassuce, D. C. Determinação das faixas de conforto térmico para frangos de corte de diferentes idades criados no Brasil. Viçosa: UFV. 2011. 91p. Tese Doutorado
Coelho, D. J. R.; Tinoco, I. de F. F.; Vieira, M. F. A.; Mendes, M. A.; Sousa, F. C. de; França, L. G. Mapeamento do ambiente térmico de aviários de postura abertos em sistema vertical de criação. Revista Brasileira de Engenharia Agrícola e Ambiental, v.19, p.996-1004, 2015. http://dx.doi.org/10.1590/1807-1929/ agriambi.v19n10p996-1004
Cordeiro, M. B.; Tinôco, I. de F. F.; Silva, J. N.; Vigoderis, R. B.; Pinto, F. de A. de C.; Cecon, P. R. Conforto térmico e desempenho de pintos de corte submetidos a diferentes sistemas de aquecimento no período de inverno. Revista Brasileira de Zootecnia, v.39, p.217-224. 2010. http://dx.doi.org/10.1590/S1516-35982010000100029 Damasceno, F. A.; Osorio Saraz, J. A.; Mendes, L. B.; Martin, S.;
Martins, M. A. Evaluation of a heating system in poultry houses using a CFD model. Revista Facultad Nacional de Agronomia, v.67, p.7355-7363, 2014.
Green, A. R.; Wesley, I.; Trampel, D. W.; Xin, H. Air quality and bird health status in three types of commercial egg layer houses. Journal of Applied Poultry Research, v.18, p.605-621, 2009. http:// dx.doi.org/10.3382/japr.2007-00086
Jácome, I. M. T. D.; Furtado, D. A.; Leal, A. F.; Silva, J. H. V.; Moura, J. F. P. Avaliação de índices de conforto térmico de instalações para poedeiras no nordeste do Brasil. Revista Brasileira de Engenharia Agrícola e Ambiental, v.11, p.527-531, 2007. http:// dx.doi.org/10.1590/S1415-43662007000500013
Faria, F. F.; Moura, D. J.; Souza, Z. M.; Matarazzo, S. V. Variabilidade espacial do microclima de um galpão utilizado para confinamento de bovinos de leite. Ciência Rural, v.38, p.2498-2505, 2008. http:// dx.doi.org/10.1590/S0103-84782008000900013
Furtado, D. A.; Dantas, R. T.; Nascimento, J. W. B. do; Santos, J. T.; Costa, F. G. P. Effect of different environment conditioning systems on the productive performance of chickens. Revista Brasileira de Engenharia Agrícola e Ambiental, v.10 p.484-489, 2006. http://dx.doi.org/10.1590/S1415-43662006000200033 Karlsson, J.; Wadsö, L.; Öberg, M. A conceptual model that simulates
Lara, L. J.; Rostagno, M. H. Impact of heat stress on poultry production. Animals 3.2, v.3, p.356-369, 2013.
Medeiros, C. M.; Baêta, F. C.; Oliveira, R. F. M.; Tinôco, I. de F. F.; Albino, L. F. T.; Cecon, P. R. Environmental thermal index of productivity for broiler chickens. Revista Brasileira de Engenharia Agrícola e Ambiental, v.9, p.660-665, 2005. http://dx.doi. org/10.1590/S1415-43662005000400033
Mendes, L. B.; Tinôco, I. de F. F.; Ogink, N. W. M.; Osorio, R.; Osorio, J. A. A refined protocol for calculating air flow rate of naturally ventilated broiler barns based on CO2 mass balance. Dyna, v.81, p.197-203, 2014.
Mendes, L. B.; Tinôco, I. de F. F.; Ogink, N. W. M.; Rocha, K. S. O.; Saraz, J. A. O.; Sousa, M. S. Ammonia emissions from a naturally and a mechanically ventilated broiler house in Brazil. Revista Brasileira de Engenharia Agrícola e Ambiental, v.18, p.1179-1185, 2014. http://dx.doi.org/10.1590/1807-1929/agriambi.v18n11p1179-1185 Menegali, I.; Tinôco, I. de F. F.; Baêta, F. C.; Cecon, P. R.; Guimarães,
M. C. C.; Cordeiro, M. B. Thermal environment and gas concentrations in poultry houses during heating. Revista Brasileira de Engenharia Agrícola e Ambiental, v.13, p.984-990, 2009. http://dx.doi.org/10.1590/S1415-43662009000700022 Menegali, I.; Tinôco, I. de F. F.; Carvalho, C. C. S.; Souza, C. F.;
Martins, J. H. Comportamento de variáveis climáticas em sistemas de ventilação mínima para produção de pintos de corte. Revista Brasileira de Engenharia Agrícola e Ambiental, v.17, p.106-113. 2013. http://dx.doi.org/10.1590/S1415-43662013000100015 Nascimento, G. R.; Pereira, D. F.; Naas, I. A.; Rodrigues, L. H. A. Índice
fuzzy de conforto térmico para frangos de corte. Engenharia Agrícola, v.31, p.219-229, 2011. http://dx.doi.org/10.1590/S0100-69162011000200002
Oliveira, R. F. M.; Donzele, J. L.; Abreu, M. L. T.; Ferreira, R. A.; Vaz, R. G. M. V.; Cella, P. S. Effects of temperature and relative humidity on performance and yield of noble cuts of broilers from 1 to 49 days old. Revista Brasileira de Zootecnia, v.35, p.797-803, 2006. http://dx.doi.org/10.1590/S1516-35982006000300023
Osorio, R.; Tinôco, I. de F. F.; Saraz, J. A. O.; Rocha, K. S. O.; Guerra, L. M. G. Modelamiento del ambiente térmico y aéreo de un galpón de presión negativa tipo túnel para pollitos. Revista Facultad Nacional de Agronomia, v.66, p.7085-7093, 2013.
Passini, R.; de Araújo, M. A.; Yasuda, V. M.; Almeida, E. A. Intervenção ambiental na cobertura e ventilação artificial sobre índices de conforto para aves de corte. Revista Brasileira de Engenharia Agrícola e Ambiental, v.17, p.333–338, 2013. http://dx.doi. org/10.1590/S1415-43662013000300013
Rocha, K. S. O.; Martins, J. H.; Tinôco, I. F. F.; Melo, E. C.; Lopes, D. C.; Hermsdorff, W. Remote environmental monitoring and management of data systems. Central Theme, Technology for All: Sharing the Knowledge for Development. In: International Conference of Agricultural Engineering, 37, Brazilian Congress of Agricultural Engineering, International Livestock Environment Symposium-ILES, 8, 2008, Iguassu Falls City, Proceedings…Iguassu Falls City: International Commission of Agricultural Engineering (CIGR), Institut fur Landtechnik), 2008. sp.
Saraz, J. A. O.; Tinôco, I. de F. F.; Rocha, K. S. O.; Martins, M. A.; Paula, M. O. de. Modeling and experimental validation to estimate the energy balance for a poultry house with misting cooling. Dyna, v.170, p. 167-174, 2011.
Silva, M. A. N. da; Barbosa Filho, J. A. D.; Silva, C. J. M. da; Rosário, M. F.; Silva, I. J. O. da; Coelho, A. A. D.; Savino, V. J. M. Avaliação do estresse térmico em condição simulada de transporte de frangos de corte. Revista Brasileira de Zootecnia, v.36, p.1126-1130, 2007. http://dx.doi.org/10.1590/S1516-35982007000500020
Thom, E. C. The discomfort index. Weatherwise, v.12, p.57-61, 1959. http://dx.doi.org/10.1080/00431672.1959.9926960
Tinôco, I. F. F.; Figueiredo, J. L. A.; Santos, R. C.; Silva, J. da, Pugliesi, N. L. Placas porosas utilizadas em sistemas de resfriamento evaporativo. Engenharia na Agricultura, v.12, p.17–23. 2004. Vigoderis, R.B.; Cordeiro, M.B.; Tinôco, I. F. F.; Menegali, I.; Souza,