(Annals of the Brazilian Academy of Sciences)
Printed version ISSN 0001-3765 / Online version ISSN 1678-2690 www.scielo.br/aabc
http://dx.doi.org/10.1590/0001-3765201420130503
Composition of functional ecological guilds of the fish fauna of the internal sector of the Amazon Estuary, Pará, Brazil
KEILA R.M. MOURÃO1, VALDIMERE FERREIRA2 and FLÁVIA LUCENA-FRÉDOU2
1Universidade Federal do Pará/UFPA, Laboratório de Biologia Pesqueira e Manejo de Recursos Aquáticos,
Av. Perimetral, 2651, Terra Firme, 66077-530 Belém, PA, Brasil
2
Universidade Federal Rural de Pernambuco/UFRPE, Departamento de Pesca e Aquicultura/DEPAQ, Rua Dom Manoel de Medeiros, s/n, Dois Irmãos, 52171-900 Recife, PE, Brasil
Manuscript received on December 19, 2013; accepted for publication on May 5, 2014
ABSTRACT
The present study describes the spatial and temporal structure of the estuarine fish community in the internal sector of the Amazon Estuary. Samples were obtained in the main channels and tidal creeks of Guajará and Marajó Bays and Guamá River. A total of 41,516 fish specimens were collected, representing 136 taxa, 38 families and 12 orders. In the dry season, the mean salinity of the main channel increased along a limnic-marine gradient, between the Guamá River and the Marajó Bay. Species richness was lowest in the mouth of the Guamá River and in the right margin of the Guajará Bay. Fish species composition and environmental guilds differed markedly among areas: Migrants and Freshwater Stragglers were dominant in the Guamá River and the Guajará Bay, while Estuarine, Marine Stragglers and Migrants predominated in the Marajó Bay. However, the trophic guilds were still relatively well balanced, in functional terms. Piscivores and Zoobenthivores were the dominant feeding functional groups in all the studied areas. In this study, the assessment of the community and the use of the guild approach were efficient to describe the structure and functioning of the assemblages of estuarine fish also helping to assess the anthropogenic pressures in the area. Key words: estuaries, fish diversity, functional ecology, habitat, salinity gradients.
Correspondence to: Keila Renata Moreira Mourão E-mail: [email protected]
INTRODUCTION
In recent studies, the concept of ecological “guilds” has been used to organize information on the function, hierarchical structure, and connectivity of ecological systems, primarily by simplifying relatively complex ecological interactions (Elliott et al. 2007, Noble et al. 2007, Franco et al. 2008a). Guilds or biecological categories (Albaret 1999), became important tools in providing a better
understanding of the structure and functioning of
the assemblages of fish (Mathieson et al. 2000),
contributing to the knowledge of the system and the implementation of strategic planning, which is especially important in estuaries, where human activities have been causing ever greater impacts on
the environment and its natural resources (Whitfield
quality and aquatic biodiversity (Viana et al. 2010, 2012). In addition, the high socio-economic value of their goods, especially as a source of income and food is well documented (Lambert and Turpie 2003, Glaser and Diele 2004, Ortiz and Wolff 2004, Isaac et al. 2009). Ecologically, this environment plays an essential as a feeding and breeding ground, providing appropriate habitats for different stages
of the fish life cycle, in addition to functioning
as a migratory routes for both anadromous and catadromous species (Yañez-Arancibia 1986, Elliott et al. 2007, Martinho et al. 2007).
The Amazon Estuary is considered to be a single system, however it is highly heterogeneous in terms of the dynamics of sedimentary deposition and freshwater discharge. This determines the characteristics of its fauna (Coelho 1980, Camargo
and Isaac 2001) and flora (Prost and Rabelo 1996),
including species richness and distribution patterns (Giarrizo and Krumme 2008). Additionally, in the Amazon Estuary, there is a river-ocean gradient
in the distribution of different species, reflecting
their capacity to tolerate varying levels of salinity, and the presence of an essentially euryhaline community. However, seasonal changes in the
composition of the community indicate an influx
of freshwater species during the rainy season, while marine species predominate during the
dry season, reflecting changes in salinity levels (Camargo and Isaac 2001).
The internal sector of the Amazon Estuary, including the Bays of Marajó and Guajará and the mouth of the Guamá River, our study area, suffers a wide range of anthropogenic impacts. Among some of the impacts, we can cite a petrochemical complex and wood industries, numerous ports and shipping lanes, and the widespread discharge of domestic and industrial effluents, especially in the Guajará Bay and the mouth of the Guamá River, where the metropolitan area of Belém is located (IBGE 2010). Marajó Bay is one of the most important fishing grounds in the Amazon
Estuary. Artisanal fisheries are especially intense (Oliveira and Lucena Frédou 2011) and human activities have been gradually depleting the area’s fish stocks (Barthem and Petrere 1995, Isaac et al. 2008). In this area, marine species such as Scomberomorus brasiliensis, Cynoscion acoupa, Mugil sp. and Bagre bagre,are harvested (Mourão et al. 2009).
The use of functional ecological groups or
guilds of fish have been recognized in estuaries
(Elliott et al. 2007, Noble et al. 2007, Franco et al.
2008a, Elliott and Whitfield 2011) not only as an
alternative for the analysis of traditional taxonomic
divisions of fish assemblages, providing a better
understanding of the structure and functioning
of the assemblages of fish occurring in estuaries
(Mathieson et al. 2000), but also, as a useful tool to describe ecosystem services, helping to assess the anthropogenic pressures which threat the integrity of estuaries world-wide. For example, the knowledge on the structure and functioning variability of the guilds in transitional water is useful for identifying different water body types
for which specific biological reference conditions
can be reliably derived (Franco et al. 2008b). In addition, the structure of a community’s trophic guilds may be considered as a good indicator of trophic integrity (Deegan et al. 1997, Elliott et al. 2007, Henriques et al. 2008) and is widely adopted in current indices, because it allows a direct functional approach to the estuarine assessment (Pérez-Domínguez et al. 2009).
The present study describes the spatial and
temporal structure of the estuarine fish community
in the internal sector of the Amazon Estuary, assuming a connectivity of the ichthyofauna
between limnic and marine systems, using the fish
MATERIALS AND METHODS
STUDIED AREA
The Amazon Estuary, located in Northern Brazil, is formed by the discharge of the Amazon and the Tocantins River, resulting in the annual mixture of approximately 6,300 km3 of river water carrying 9.3 x 10⁸ tons of sediments from the Atlantic Ocean (Meade et al. 1979). This unique environment harbors both marine and freshwater species (Milliman and Meade 1983). This work was conducted at the aquatic environments surrounding the city of Belém (state of Pará), including three zones: mouth of the Guamá River (and Combu
Island); Guajará (Onças Island) and Marajó (Mosqueiro Island) Bays, in the southeast of the Amazon Estuary (Fig. 1). The area is located in the internal sector of the Amazon Estuary, with a mean annual temperature of 25°C, air humidity above 80% and a rainfall of 2,889 mm.y-1(Bezerra et al. 2011). The tidal propagation goes on for several kilometers upstream, characterizing a broad zone
of fluvial–marine transition under the impact of
semidiurnal tides (Gregório and Mendes 2009).
This region is classified as a tidally-influenced area of river (tidal fresh: salinity < 0.5–limnetic;
Guamá River and Guajará Bay) and mesohaline environment (salinity 5-18; Marajó Bay).
DATA COLLECTION
For all zones, two different types of environment
– the main river channel and the tidal creek (inside the islands) were sampled in all three zones. Data were collected in the Guamá River and the Combu Island in 2004-2005 and 2008-2009, in
the Guajará Bay and the Onças Island in 2004-2005 and 2007-2008, and in the Marajó Bay and the Mosqueiro Island in 2008-2011 (Fig. 2). In all three zones, samples were collected in both dry (July to December) (159 sets) and rainy seasons, between January to June (155 sets).
Figure 2 - Ecological descriptor and number of species by environment, season and guilds in the Guamá River, Guajará Bay and Marajó Bay,Amazon Estuary, northern Brazil.
As the main channels and tidal creek show distinct dynamics (Viana et al. 2010), different sampling protocols were used. In the main channels, gillnets (knot-to-knot meshes of 25 mm, 30 mm, 40 mm, and 50 mm; and total area 1.204,70 m2)
were used to capture specimens. In the specific
case of the Marajó Bay, nets with larger meshes (60 mm and 70 mm; and total area 1.435,70 m2) were used, given the more favorable conditions
– depth and extension – of this area. During the
collection of specimens, nets were set in a random
configuration, twice, for two to three hours at a
time. The 60 mm and 70 mm nets were tested in the Guamá River and the Guajará Bay, although they proved inoperable, due to the shallow depths and the frequent presence of submerged trunks
and branches. Trawl net, with a mesh of 5 mm on all its extension, length of 5.50 m, height of 0.60 m, and opening of 1.10 m, was only used in the main channel (except in the main channel of the islands, due to the presence of submerged trunks and branches). Three trawls of approximately 20 minutes were conducted in each study area at a mean velocity of 1.62 knots.
Multifilament block nets with a 25 mm mesh
were used in the tidal creeks. These nets were 50 m long and 5 m high. Blocking was initiated at the end of the high tide and continued throughout the entire ebb tide cycle, of approximately six hours. The tidal creeks drain completely at low tide, and the specimens were either gilled in the net (smaller
All specimens were stored in ice and transported to the laboratory for processing. The specimens
were sized (Total Length – TL, cm), weighed (Total Weight – TW, kg). Salinity was measured in the field
using a portable conductivimeter Orion model 115.
DATA ANALYSES
The species richness was estimated using the non-parametric Bootstrap extrapolation procedure, which was found to be the most adequate procedure for the data collected, given that the assumption of the random occurrence of
species was satisfied, resulting in more reliable standard deviations (Magurran 1988, Colwell and Codington 1994). The index and standard deviation of the estimates were calculated using Colwell et al. (2004) analytical equation, run in EstimateS v.8 (Colwell 2009). Data entry included individuals caught by all gears.
For each study zone, environment and season,
the composition of the fish fauna was reported in
terms of absolute species richness (S). For each species, relative abundance (%N), relative weight (%W), and frequency of occurrence (%FO) was also calculated. Species were considered to be common when %N was greater than 100/S, where S = the number of species recorded in the area. A species
was classified as frequent when its %FO value for a
given area was greater than 50%. The combination
of these parameters enabled the classification of
the different species into four categories (following Garcia and Vieira 2001): (1) common and frequent
(%N > 100/S and %FO ≥ 50%); (2) common, but
infrequent (%N > 100/S and %FO < 50%); (3) rare,
but frequent (%N < 100/S and % FO ≥ 50%), and (4)
rare and infrequent (%N < 100/S and %FO < 50%).
Estuarine Use Functional Group was defined according to the classification of Elliott et al. (2007). This classification is based on the type,
frequency, and period of use of the estuarine environment, and the abundance of the species in the estuary, classified under the following categories:
Marine Stragglers (MS); Marine Migrants (MM); Estuarine Species (ES); Freshwater Migrants (FM), and Freshwater Stragglers (FS). Feeding mode functional groups, based on feeding preferences
and strategies, were also defined. In order to perform this classification, species were allocated
to one of the following ecological guilds (based on Elliott et al. 2007): Zooplanktivore (ZP); Detritivore (DV); Piscivore (PV); Zoobenthivore (ZB); Herbivore (HV); Opportunist/Omnivore (OP). Two additional categories were included: Piscivore/Zoobenthivore: PV/ZB (following Krumme et al. 2004) and Insectivore (IS). The
trophic categories were identified by combining the
regional information available on predominant diet and stomach examination of several species. Where little information was available, trophic and habitat preferences were inferred from the data available in the Fishbase project (Froese and Pauly 2007), and when no information was found, the species was not included in this analysis.
An “importance value”, (Iv) (Harrison and Whitfield 2008), was derived from the relative contribution (%) of each functional group in each study area, based on Iv = 0.33 (a + b + c), where a = the percentage of species, b = percentage abundance, and c = percentage biomass. As a combination of these elements, the Iv provides an integrated measure of the global importance of each guild.
Multivariate multidimensional scaling (MDS) was used to compare species composition (%N and %W) and guilds in relation to spatial (zones and environmental) and temporal (seasonality)
variables. All groups defined in the MDS were
RESULTS
Species richness was lowest in the mouth of the Guamá River. The cumulative species curves for the three zones indicate that sampling was not exhaustive, given that they did not reach an asymptote. However, the results of the bootstrap analysis suggest that sampling was relatively reliable in all three study areas, with around ninety-percent of the estimated number of species being recorded in all three cases. A total of 55 species were recorded in the Guamá River, representing 90.2% of the richness estimated by the bootstrap procedure. Similar patterns were recorded in the
Guajará Bay, where 88.7% (94) of the estimated 106 species were recorded, and in the Marajó Bay, where 7.9% (95) of the estimated 108 species were observed in the study (Table I).
The mean salinity, measured during the dry season, of the main channel increased along a limnic-marine gradient, i.e., between the Guamá River and the Marajó Bay. Marked variation in mean salinity was recorded only in the Marajó Bay (mean = 2; range 0.7 - 2.9), while in the Guajará Bay low salinity (mean
= 0.018; range: 0 – 0.15) was recorded in the rainy
season. Additionally, salinity was zero in the tidal creeks of all three zones throughout the year (Table I).
TABLE I
Ecological descriptor and number of species by environment, season and guilds in the Guamá River, Guajará Bay and Marajó Bay.
Ecological Descriptor Guamá River Guajará Bay Marajó Bay
Absolute richness 55 94 95
Estimate richness 61 106 108
Number of species
Environment
Main channel 44 71 80
Tidal creek 24 65 26
Season
Rainy season 42 73 62
Dry Season 48 72 78
Estuarine Use Functional Group
Estuarine Species - ES 8 12 19
Freshwater Migrants - FM 11 12 12
Freshwater Stragglers - FS 33 59 38
Marine Migrants - MM 2 5 11
Marine Stragglers - MS 1 5 7
Feeding Use Functional Group
Detritivore - DV 3 6 3
Herbivore - HV 3 7 8
Opportunist/Omnivore - OP - 1 1
Piscivore - PV 10 12 11
Piscivore/Zoobenthivore - PV/ZB 3 8 10
Zoobenthivore - ZB 19 33 29
Zooplanktivore - ZP 2 2 2
A total of 41,516 fish specimens were
collected, representing 136 taxa, 38 families and 12 orders (Supplement Table I). In general, the families Sciaenidae (10.9% of the species recorded), Loricariidae (10.9%), Engraulididae (8.7%), and Cichlidae (6.5%) were the most diverse. Plagioscion squamosissimus was the most common species in the Guamá River (22% of individuals) and in the Guajará Bay (24%), while Stellifer microps was the most common (44%) in the Marajó Bay. The siluriforms
Brachyplatystoma filamentosum (17% of the
total) and Brachyplatystoma rousseauxi (16%) contributed to the largest proportion of the biomass in the Guamá River, Lithodora dorsalis (53%) in the Guajará Bay, and Brachyplatystoma rousseauxi (17%) and Plagioscion squamosissimus (16%) in the Marajó Bay (Supplement Table I).
A total of 28 species were common to all zones and habitats (Supplement Table I). However, there were considerable differences between habitats. Overall, 66 species were recorded only in the main channels, while 20 were found only in tidal creeks. The proportion of exclusive species also increased along the limnic-marine gradient, from 2% in the Guamá to 21% in the Guajará Bay and 27% in the Marajó Bay.
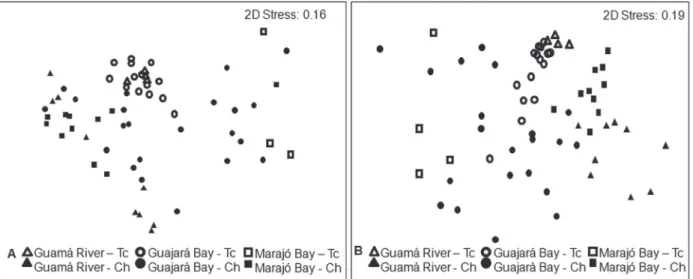
The multivariate analysis indicated
sig-nificant differences in the composition of the
fish assemblages among zones, considering both types of habitat (main channel and tidal creek), in terms of percentage abundance and biomass (ANOSIM, p < 0.05). Three distinct groups were
identified (Fig. 3). In relation to seasonal variation,
significant differences in the composition of the fish assemblages were found only in percentage abundance and in tidal creeks (ANOSIM, p < 0.05).
Figure 3 - Multivariate multidimensional scaling analysis by zone (Guamá River, Guajará Bay and Marajó Bay) and environment (Main channel and Tidal creek): A) abundance percentage and B) biomass percentage.
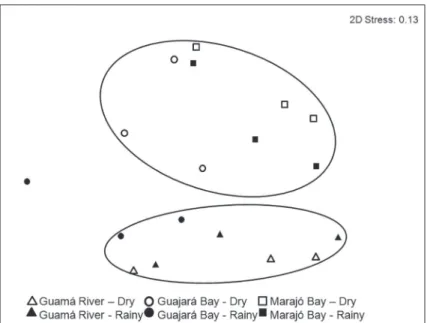
The MDS ordination of the Estuarine Use Functional Group showed two different groups (ANOSIM, p < 0.05), mainly composed by guilds of the Marajó Bay and the Guamá River. However, guilds of the Guajará Bay were
observed within both groups, (Fig. 4). The same pattern was also observed considering the Feeding Mode Functional Groups (ANOSIM, p <0.05).
Significant differences between seasons were not
Estuarine Species (ES) were dominant in the Marajó Bay for both dry and rainy seasons (IV=
9.27 – Dry; IV= 9.63 - Rainy). Together, Marine
Migrants (MM) and Marine Stragglers (MS) were the representative in the Marajó Bay (Table II).
Figure 4 - Multivariate multidimensional scaling analysis by environment guild by zone (Guamá River, Guajará Bay and Marajó Bay) and season (Dry and Rainy season), Amazon Estuary, northern Brazil.
Figure 5 - Multivariate multidimensional scaling analysis by feeding guild by zone (Guamá River, Guajará Bay and Marajó Bay) and season (Dry and Rainy season), Amazon Estuary, northern Brazil.
Freshwater Migrants (FM) predominated for both
TABLE II
Mean ± S.D. Importance Values (IV) of estuary association fish environment guilds by zone and season in the Guamá River, Guajará Bay and Marajó
Bay. Estuarine Species (ES); Freshwater Migrants (FM); Freshwater Stragglers (FS) Marine Migrants (MM) and Marine Stragglers (MS).
DRY RAINY
Guamá River Guajará Bay Marajó Bay Guamá River Guajará Bay Marajó Bay
ES 2.87 ± 0.96 4.45 ± 3.48 9.27 ± 4.75 3.68 ± 1.41 3.17 ± 1.21 9.63 ± 5.00 FM 11.65 ± 7.56 7.72 ± 1.94 7.90 ± 5.34 11.54 ± 8.51 8.28 ± 8.22 8.07 ± 6.55 FS 9.76 ± 1.07 10.98 ± 14.41 4.07 ± 1.79 8.67 ± 1.53 12.73 ± 1.21 6.35 ± 3.05 MM 0.75 ± 0.24 1.43 ± 0.79 2.79 ± 2.07 1.15 ± 0.38 0.52 ± 0.20 0.62 ± 0.22
MS 0.37 0.34 ± 0.06 1.42 ± 0.44 0.72 0.32 ± 0.03
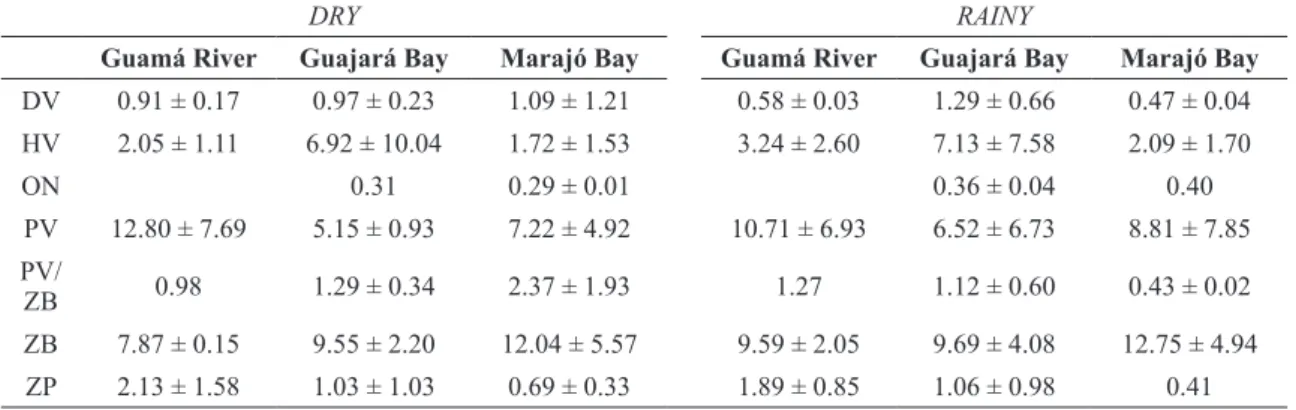
Piscivores and zoobenthivores were the dominant feeding functional groups in all the study zones, however the highest percentages of piscivores were recorded in the mouth of the Guamá River and the percentage of zoobenthivores was highest in
the Marajó Bay, for both seasons. The contribution of zooplanktivores (IV) decreased progressively between the Guamá River and the Marajó Bay. In the Guajará Bay, a larger proportion of herbivores was recorded during two season periods (Table III).
TABLE III
Mean ± S.D. Importance Values (IV) of estuary association fish feeding guilds by zone and season in the Guamá River, Guajará
Bay and Marajó Bay. Detritivore (DV); Herbivore (HV); Omnivore (OP); Piscivore (PV); Piscivore/Zoobenthivore (PV/
ZB); Zoobenthivore (ZB) and Zooplanktivore (ZP).
DRY RAINY
Guamá River Guajará Bay Marajó Bay Guamá River Guajará Bay Marajó Bay
DV 0.91 ± 0.17 0.97 ± 0.23 1.09 ± 1.21 0.58 ± 0.03 1.29 ± 0.66 0.47 ± 0.04 HV 2.05 ± 1.11 6.92 ± 10.04 1.72 ± 1.53 3.24 ± 2.60 7.13 ± 7.58 2.09 ± 1.70
ON 0.31 0.29 ± 0.01 0.36 ± 0.04 0.40
PV 12.80 ± 7.69 5.15 ± 0.93 7.22 ± 4.92 10.71 ± 6.93 6.52 ± 6.73 8.81 ± 7.85 PV/
ZB 0.98 1.29 ± 0.34 2.37 ± 1.93 1.27 1.12 ± 0.60 0.43 ± 0.02
ZB 7.87 ± 0.15 9.55 ± 2.20 12.04 ± 5.57 9.59 ± 2.05 9.69 ± 4.08 12.75 ± 4.94 ZP 2.13 ± 1.58 1.03 ± 1.03 0.69 ± 0.33 1.89 ± 0.85 1.06 ± 0.98 0.41
DISCUSSION
Comparisons of fish assemblage structure require data that accurately reflect the true composition
of species. One means of ensuring accurate representation of the species assemblage is through effective sampling design (Kwak and Peterson 2007). The heterogeneity of the Amazon Estuary
makes standardization of sampling equipment and
methodology difficult. Even when standardized
also differential effort, although standardized sampling gears was used within each environment (main river channel and tidal creek) and clear trends were noticeable from our analysis. In our study, a multi-gear approach was used in order to provide
the most complete estimate of fish assemblage
structure (Kwak and Peterson 2007).
The present study recorded significant differences in the composition of the fish
assemblages among areas. Species richness was lowest in the mouth of the Guamá River. While the input of freshwater is vital to the productivity and diversity of estuarine systems, Schlacher and Wooldridge (1996) and Livingston (1997) found that it could contribute to a decrease in species richness and diversity, which may not necessarily be related to saline stress, but rather to the composition and instability of the sediments (Elliott and Mclusky 2002). Marajó and Guajará Bays presented the highest species richness, which could have been favored by the hydrodynamic conditions and the enhancement of high-salinity habitats (Nicolas et al. 2010a). The diversity of the Guajará Bay could also be related to the presence of many small islands and tidal creeks, as well as to the availability of feeding resources and habitat diversity in the Onças Island. This swampy island, which is inundated by the tides (Carvalho et al. 1998), presents a wide variety of habitats, which
are occupied by a large number of fish species (77).
In the right margin of the Guajará Bay is located the city of Belém, with a metropolitan area occupied by 1.4 million inhabitants (IBGE 2010), and a wide range of anthropogenic impacts. These factors most certainly contribute to the reduced species richness found in this area (40 species). By reducing habitat quality, anthropogenic factors also affect the survival or reproduction of many species, typically leading to reduced species richness and alterations in community structure (Whitfield and Elliott 2002). Viana et al. (2010) stated that, for the main channel of the Guajará Bay, the sewage and
industrial discharges have not yet severely affected
the area due to the efficiency of self-purifiers,
which dilute the pollutant discharge probably due to the highly dynamic mixed-energy environment of the bay (Gregório and Mendes 2009). However,
these authors found anthropogenic influence in tidal
creeks located at the right margin of the Guajará Bay. This environment is a more closed aquatic system where pollutants remain for longer periods of time without dilution in the water. Most species that inhabit tidal creeks have restricted migratory habits and are considered good indicators of water quality. This reduction on species richness due to anthropic factors was also reported in an industrial district (Vila do Conde, Pará, Brazil) located near our study area (Viana et al. 2012).
Only recently has the functionality of ecological guilds been integrated into studies of
fish communities only recently, with applications in
Europe (Selleslagh et al. 2009, Nicolas et al. 2010b)
and Africa (Harrison and Whitfield 2008, Ecoutin
et al. 2010). The reviews of Elliott et al. (2007) and Noble et al. (2007) have been widely used to
describe estuarine fish assemblages and offer an
higher proportion than that recorded in the present study. In this study, seasonal differences in the
fish community structure were only observed for
the tidal creek (in terms of biomass), probably due to the dominance of the large-sized Lithodora dorsalis during the dry season. This was different to what was observed by Camargo and Isaac (2001), in Amazonian estuaries with large variation of salinity, who found seasonal changes in the
composition of the community, reflecting changes
in salinity levels.
In the Amazon Estuary, the river-ocean gradient
in the distribution of different species, reflects
their capacity to tolerate varying levels of salinity, and the presence of an essentially euryhaline community. Sciaenids were the most abundant
fishes in all study areas, but the catfishes siluriforms
predominated in terms of body weight. The species of the families Sciaenidae and Pimelodidae are characterized by their considerable diversity and widespread distribution on the northern coast of Brazil (Barthem 1985, Camargo and Isaac 2001), where they occur typically in environments with salinity of around 8 (Barthem 1985), indicating that, while they have limnic habits, they are tolerant of estuarine conditions. When the present study zones were considered separately, however, different patterns of dominance of both species and families were observed.
In estuaries, the feeding ecology of fishes is highly diversified, with all different trophic levels
being represented, and a predominance of sediments rich in nutrients (Paiva et al. 2008). This trophic diversity was recorded in all the zones surveyed in the present study, however zoobenthivores and piscivores were predominant. The substrate within the study area was composed of mud (fluid and
compact), fine to medium-grained sand (Gregório
and Mendes 2009), and organic material (leaves), favoring the presence of a wide range of animals,
which represent a feeding resource for fish (Uieda
and Uieda 2001). The composition of this substrate
probably accounts for the relatively high percentage of zoobenthivores found in all areas, as predicted by Blaber (2000), who proposed that benthivores should predominate in all types of estuaries. The dominance of piscivores may have been related to the high biomass of pimelodid species in the study area. These species are considered to be
second-order carnivores, which feed primarily on fishes
and invertebrates (Paiva et al. 2008).
The number of trophic guilds found in this study was similar to that reported for others aquatic
ecosystem such as coral reefs and flood plain lakes
(Abujanra et al. 2009, Santana-Porto and Andrian 2009) and also to other estuaries world-wide. In south Brazil, the number of guilds was similar to the present study and also zoobenthivores and piscivouros dominated (Passos et al. 2013). In the estuary of the Caeté River (Amazon) and also in other tropical estuaries world-wide, zoobenthivores also dominate (Chua 1973, Day 1964, Blaber et al. 1989, Krumme et al. 2004).
Trophic guilds have been considered to be excellent indicators of the integrity of an environment (Henriques et al. 2008). The insertion of trophic guild as metrics (number and abundance of zoobenthivorous, piscivorous and piscivororous/ zoobenthivorous) for the application of multimetric indices of ecosystem integrity was used in an industrial district in the Amazon Estuary (Vila do Conde, Pará, Brazil), adjacent to our study area and with similar characteristic to the Guajará Bay (Viana et al. 2012). In this study, the number of guilds differed and the absence of piscivores, zoobenthivores, and detritivores, revealed the alterations in the industrial district. Elliott et al.
(2007) affirms that, in general, the greater the number of trophic guilds, the greater the integrity of the estuarine environment, given the greater
equilibrium of predator–prey relationships, which normally reflects reduced anthropogenic impacts
disturbances result in the loss of organisms at the
top of the trophic web. In our case, the fish species
composition and environmental guilds differed markedly among zones, however, the trophic guilds are still relatively well balanced, in functional terms, even considering the antropogenic impacts
of the Guajará Bay and the fishery importance of the
Marajó Bay. We believe that the level of disturbance of the Guajará Bay has not yet affected the trophic structure, differently than the reported for the industrial district with severe alteration related to the community (eg. diversity and abundance) (Viana et al. 2012, Viana and Lucena Frédou 2014) and individual level (e.g. histological alterations) (Viana et al. 2013). Selleslagh et al (2009) found
clear similarities in the fish assemblages among
preserved and polluted estuaries, suggesting that anthropogenic impacts (chemical contamination) on estuaries do not affect their ecological functioning as described by the ecological guilds. According to Selleslagh et al (2009), growth may affect the ecological functioning of estuaries. Gilliers et al. (2006) and Amara et al. (2007) have successfully linked aspects of the estuarine functioning (density, growth and condition indices) to nursery quality.
In this study, the assessment of the estuarine
fish community and the use of the guild approach were also efficient in identifying different water
body types. The application of the Estuarine Use Functional Group demonstrates that the inner portion of the Amazon Estuary consists of different water body types, were the Guamá River and the Guajará Bay are considered as freshwater and the Marajó Bay as a brackish water body. This
classification corroborates with the Brazilian
National Council of Environmental (CONAMA),
responsible for the classification of the water
bodies in Brazil. However, this council used only salinity as reference. The guild approach may also be used to validate water body types, since variation in the community could occur depending on season and other environmental features.
Furthermore, the guild approach proved effective
for the investigation of fish diversity along a
salinity gradient. The presence of all the different ecological guilds within the study area emphasizes its role as a contact zone between tidal currents, river discharge, and wave forces, in a highly-dynamic, mixed-energy environment (Corrêa 2005, Gregório and Mendes 2009).
ACKNOWLEDGMENTS
We are indebted to Conselho Nacional de
Desenvolvimento Científico e Tecnológico (CNPq) for their financial assistance during the project development and for a student grant to the first
author and a research grant to the third author (308421/2010-8).
RESUMO
O presente estudo descreve a estrutura espacial e temporal da comunidade de peixes estuarinos da porção interna do estuário Amazônico. Amostras foram obtidas no canal principal e canais de maré das Baías do Guajará e Marajó e rio Guamá. Foram coletados um total de 41.516 espécimes, correspondendo 136 espécies, 38 famílias e 12 ordens. Na estação seca, a salinidade média no canal principal aumentou ao longo do gradiente limnico–marinho, entre o rio Guamá e a Baía do Marajó. A riqueza de espécies foi mais baixa na foz do rio Guamá e na margem direita da baía do Guajará. A composição das espécies e as guildas ambientais diferiram significativamente entre as áreas: Migrantes e Ocasionais de água doce foram dominantes no rio Guamá e na Baía do Guajará, enquanto Estuarinas, Marinhas Migrantes e Ocasionais dominaram na Baía do Marajó. Contudo, as guildas tróficas foram relativamente bem balanceadas, em termos funcionais. Piscívoros e Zoobentívoros foram os grupos alimentares dominantes em todas as áreas. Neste estudo, a avaliação da comunidade e o uso da abordagem com guildas foram eficientes para descrever a estrutura e o funcionamento das assembleias de peixes estuarinos e também como ferramenta na avaliação das pressões antrópicas na área.
REFERENCES
ABUJANRA FAB, AGOSTINHO AAA AND HAHN NSA. 2009. Effects of the flood regime on the body condition of fish of different trophic guilds in the Upper Paraná River floodplain, Brazil. Braz J Biol 69: 469-479.
ALBARET JJ. 1999. Les peuplements des estuaires et des lagunes. In: LÉVÊQUE C and PAUGY D (Eds), Les Poissons des Eaux Continentales Africaines, Paris, IRD Editions, p. 355-379.
AMARA R, MEZIANE T, GILLIERS C, HERMEL G AND LAFFARGUE P. 2007. Growth and condition indices in juvenile sole
Solea solea measured to assess the quality of essential fish
habitat. Mar Ecol Prog Ser 351: 201-208.
BARTHEM R. 1985. Ocorrência, distribuição e biologia dos peixes da baía do Marajó, estuário Amazônico. Bol Mus Para E Goeldi 2: 49-69.
BARTHEM RB AND PETRERE JR M. 1995. Fisheries and population dynamics of Brachyplatystoma vaillantii
(Pimelodidae) in the Amazon Estuary. In: ARMANTROUT NB (Ed), Condition of the world's aquatic habitat, New Delhi: Oxford & IBH Publishing Co. Pvt., p. 329-340. BEZERRA MO, MEDEIROS C, KRELLING APM, ROSÁRIO RP AND
ROLLNIC M. 2011. Physical oceanographic behavior at the Guama/Acara-Moju and the Paracauari river mouths, Amazon Coast (Brazil). J Coast Res 64: 1448-1462. BLABER SJM. 2000. Tropical Estuarine Fishes: ecology,
exploitation and conservation. London: Chapman and Hall, 367 p.
BLABER SJM, BREWER DT AND SALINI JP. 1989. Species composition and biomasses of fishes in different habitats of a tropical northern Australian estuary: their occurrence in the adjoining sea and estuarine dependence. Estuar Coast Shelf Sci 29: 509-531.
BROWNE RA AND LUTZ D. 2010. Lake ecosystem effects associated with top-predator removal due to selenium toxicity. Hydrobiologia 655: 137-148.
CAMARGO M AND ISAAC V. 2001. Os peixes estuarinos da região norte do Brasil: lista de espécies e considerações sobre sua distribuição geográfica. Bol Mus Para E Goeldi 17: 133-153. CARVALHO CJR, ROMBOLD J, NEPSTAD DC AND SÁ TDA. 1998. Relações hídricas do açaizeiro em mata de várzea do Estuário do Amazonas. Rev Bras Fisiol Veg 10: 213-218. CHUA THIA-ENG. 1973. An ecological study of the Ponggol
Estuary in Singapore. Hydrobiologia 43: 505-533. CLARKE RK AND WARWICK RM. 1994. Change in Marine
Communities: an approach to statistical analysis and interpretation. UK: Plymouth Marine Laboratory, 144 p. COELHO PA, PORTO MR AND KOENING ML. 1980. Biogeografia
e bionomia dos crustáceos do litoral equatorial do Brasil. Trabalhos Oceanográficos da Universidade Federal de Pernambuco 15: 7-138.
COLWELL RK. 2009. Estimates: Statistical estimation of species richness and shared species from samples. (University of Connecticut, Storrs, USA), version 8.2.0. Available online at: http://viceroy.eeb.uconn.edu/estimates. [Acessed: 10 February 2011].
COLWELL RK AND CODDINGTON JA. 1994. Estimating terrestrial biodiversity through extrapolation. Philos Trans R Soc Lond B 345: 101-118.
COLWELL RK, MAO CX AND CHANG J. 2004. Interpolating, extrapolating, and comparing incidence-based species accumulation curves. Ecology 85: 2717-2727.
CORRÊA ICS. 2005. Aplicação do diagrama de Pejrup na interpretação da sedimentação e da dinâmica do estuário da baía de Marajó-PA. Pesqui Geoc 32: 109-118.
DAY JH. 1964. The Origin and Distribution of Estuarine Animals in South Africa. Monogr Biol 14: 159-173. DEEGAN LA, FINN JT, AYVAZIAN SG, RYDER-KIEFFER CA AND
BUONACCORSI J. 1997. Development and validation of an Estuarine Biotic Integrity Index. Estuaries 20: 601-617. ECOUTIN JM, SIMIER M, ALBARET JJ, LAE R AND TITO
DE MORAIS L. 2010. Changes over a decade in fish assemblages exposed to both environmental and fishing constraints in the Sine Saloum estuary (Senegal). Estuar Coast Shelf Sci 87: 284-292.
ELLIOTT M AND MCLUSKY DS. 2002. The need for definitions in understanding estuaries. Estuar Coast Shelf Sci 55: 815-827.
ELLIOTT M AND WHITFIELD AK. 2011. Challenging paradigms in estuarine ecology and management. Estuar Coast Shelf Sci 94: 306-314.
ELLIOTT M, WHITFIELD AK, POTTER IC, BLABER SJM, CYRUS DP, NORDLIE FG AND HARRISON TD. 2007. The guild approach to categorizing estuarine fish assemblages: a global review. Fish Fish 8: 241-268.
FRANCO A, ELLIOTT M, FRANZOI P AND TORRICELLI P. 2008a. Life strategies of fishes in European estuaries: the functional guild approach. Mar Ecol Prog Ser 354: 219-228. FRANCO A, FRANZOI P AND TORRICELLI P. 2008b. Structure and
functioning of Mediterranean lagoon fish assemblages: A key for the identification of water body types. Estuar Coast Shelf Sci 79: 549-558.
FROESE R AND PAULY D. 2007. Fishbase: world wide web electronic publication. Available online at: http://www. fishbase.org. [Acessed: 12 April 2012].
GARCIA AM AND VIEIRA JP. 2001. O aumento da diversidade de peixes no estuário da Lagoa dos Patos durante o episódio El niño 1997-1998. Atlântica 23: 133-152. GIARRIZZO T AND KRUMME U. 2008. Heterogeneity in
intertidal fish fauna assemblages along the world’s longest mangrove area in Northern Brazil. J Fish Biol 72: 773-779.
GILLIERS C, LE PAPE O, DÉSAUNAY Y, BERGERON JP, SCHREIBER N, GUÉRAULT D AND AMARA R. 2006. Growth and condition of juvenile sole (Solea solea L.) as indicators of habitat quality in coastal and estuarine nurseries in the Bay of Biscay with a focus on sites exposed to the Erika oil spill. Sci Mar 70: 183-192.
GREGÓRIO AMS AND MENDES AC. 2009. Characterization of sedimentary deposits at the confluence of two tributaries of the Pará River Estuary (Guajará Bay, Amazon). Cont Shelf Res 29: 609-618.
HARRISON TD AND WHITFIELD AK. 2008. Geographical and typological changes in fish guilds of South African estuaries. J Fish Biol 73: 2542-2570.
HENRIQUES S, PAIS MP, COSTA MJ AND CABRAL H. 2008. Efficacy of adapted estuarine fish-based multimetric indices as tools for evaluating ecological status of the marine environment. Mar Pollut Bull 56: 1696-1713. IBGE. 2010. Censo Demográfico 2010. Available online at:
http://www.ibge.gov.br. [Acessed: 05 September 2011]. ISAAC VJ, SANTO RV, BENTES BS, FRÉDOU FL, MOURÃO KR
AND FRÉDOU T. 2009. An interdisciplinary evaluation of fishery production system of the State of Pará in North Brazil. J Appl Ichthyol 25: 244-255.
ISAAC VJ, SILVA CO AND RUFFINO ML. 2008. The artisanal fishery fleet of the lower Amazon. Fish Manage Ecol 15: 179-187.
KRUMME U, SAINT-PAUL U AND ROSENTHAL H. 2004. Tidal and diel changes in the structure of a nekton assemblage in small intertidal creeks in northern Brazil. Aquat Living Resour 17: 215-229.
KWAK TJ AND PETERSON JT. 2007. Community indices, parameters, and comparisons. In: GUY CS AND BROWN ML (Eds), Analysis and interpretation of freshwater fisheries data, Maryland: American Fisheries Society, Bethesda, p. 677-763.
LAMBERTH SJ AND TURPIE JK. 2003. The role of estuaries in South African fisheries: economic importance and management implications. Afr J Mar Sci 25: 131-157. LIVINGSTON RJ. 1997. Trophic responses of estuarine fishes to
longterm changes of river runoff. Bull Mar Sci 60: 984-1004.
MAGURRAN AE. 1988. Ecological Diversity and its Measurement. New Jersey: Princeton University Press, 179 p.
MARTINHO F, LEITÃO R, VIEGAS I, DOLBETH M, NETO JM, CABRAL HN AND PARDAL MA. 2007. The influence of an extreme drought event in the fish community of a southern Europe temperate estuary. Estuar Coast Shelf Sci 75: 537-546.
MATHIESON S, CATTRIJSSE A, COSTA MJ, DRAKE P, ELLIOTT M, GARDNER J AND MARCHAND J. 2000. Fish assemblages of European tidal marshes: a comparison based on species, families and functional guilds. Mar Ecol Prog Ser 204: 225-242.
MCLUSKY DS AND ELLIOTT M. 2004. The Estuarine Ecosystem: ecology, threats and management. Oxford: Oxford University Press, 214 p.
MEADE RH, NORDIN JR CF, CURTIS WF, RODRIGUES FMC, VALE CM AND EDMOND JM. 1979. Sediments loads in Amazon River. Nature 278: 162-164.
MILLIMAN JD AND MEADE RH. 1983. Word-Wide delivery of river sediment to the oceans. J Geol 91: 1-21.
MOURÃO KRM, FRÉDOU FL, ESPÍRITO SANTO RV, ALMEIDA MC, SILVA BB, FRÉDOU T AND ISAAC V. 2009. Sistema de produção pesqueira pescada amarela - Cynoscion acoupa
Lacèpede (1802): um estudo de caso no litoral nordeste do Pará - Brasil. B Inst Pesca 35: 497-511.
NICOLAS D, LOBRAY J, LEPAGE M, SAUTOUR B, LE PAPE O, CABRAL H, URIARTE A AND BOËT P. 2010a. Fish under infuence: a macroecological analysis of relations between species richness and environmental gradients among European tidal estuaries. Estuar Coast Shelf Sci 86: 137-147.
NICOLAS D, LOBRY J, LE PAPE O AND BOËT P. 2010b. Functional diversity in European estuaries: relating the composition of fish assemblages to the abiotic environment. Estuar Coast Shelf Sci 88: 329-338.
NOBLE RAA, OWX IG, GOFFAUX D AND KESTEMONT P. 2007. Assessing the health of European rivers using functional ecological guilds of fish communities: standardising species classification and approaches to metric selection. Fish Manage Ecol 14: 381-392.
OLIVEIRA DM AND LUCENA FRÉDOU F. 2011. Caracterização e dinâmica espaço-temporal da atividade pesqueira na Baía de Marajó Estuário Amazônico. Arq Ciên Mar 44: 40-53.
ORTIZ M AND WOLFF M. 2004. Qualitative modelling for the Caeté Mangrove Estuary (North Brazil): a preliminary approach to an integrated eco-social analysis. Estuar Coast Shelf Sci 61: 243-250.
PAIVA ACG, CHAVES PT AND ARAUJO ME. 2008. Estrutura e organização trófica da ictiofauna de águas rasas em um estuário tropical. Rev Bras Zool 25: 647-661.
PASSOS AC, CONTENTE RF, ABBATEPAULO FV, SPACH HL, VILAR CC, JOYEUX JC, CARTAGENA BFC AND FÁVARO LF. 2013. Analysis of fish assemblages in sectors along a salinity gradient based on species, families and functional groups. Braz J Oceanogr 61: 251-264
PAZ AC, LUCENA FRÉDOU F AND FRÉDOU T. 2011. Caracterização da atividade pesqueira em Vila do Conde (Barcarena, Pará), no estuário Amazônico. Bol Mus Para E Goeldi 6: 307-318.
PÉREZ-DOMÍNGUEZ R, MACI S, COURRAT A, BORJA A, NETO J AND ELLIOT M. 2009. Deliverable D4.4-1: Review of Fish-Based Indices to Assess Ecological Quality Condition in Transitional Waters. Available online at: <http://www. wiser.eu> [Acessed: 03 April 2014].
PROST MTRC AND RABELO BV. 1996. Variabilidade fito-espacial de manguezais litorâneos e dinâmica costeira: exemplos da Guiana Francesa, Amapá e Pará. Bol Mus Para E Goeldi 8: 101-121.
SANTANA-PORTO EA AND ANDRIAN IF. 2009. Trophic organization the ichthyofauna of two semi-lentic environments in a flood plain on the upper Paraná River, Brazil. Acta Limnol Bras 21: 359-366.
SELLESLAGH J, AMARA R, LAFFARGUE P, LESOURD S, LEPAGE M AND GIRARDIN M. 2009. Fish composition and assemblage structure in three Eastern English Channel macrotidal estuaries: a comparison with other French estuaries. Estuar Coast Shelf Sci 81: 149-159.
UIEDA W AND UIEDA VS. 2001. Species composition and spatial distribution of a stream fish assemblage in the east coast of Brazil: comparison of two field study methodologies. Braz J Biol 61: 377-388.
VIANA AP, FRÉDOU FL AND FRÉDOU T. 2012. Measuring the ecological integrity of an industrial district in the Amazon Estuary, Brazil. Mar Pollut Bull 64: 489-499.
VIANA AP, FRÉDOU FL, FRÉDOU T, TORRES MF AND BORDALO AO. 2010. Fish fauna as an indicator of environmental quality in an urbanised region of the Amazon Estuary. J Fish Biol 76: 467-486.
VIANA AP, FRÉDOU FL, MONTES CS AND ROCHA RM. 2013. Fish histopathology and catalase activity as biomarkers of the environmental quality of the industrial district on the Amazon Estuary, Brazil. Acta Sci 35: 395-401.
VIANA AP AND LUCENA FRÉDOU F. 2014. Ichthyofauna as bio-indicator of environmental quality in an industrial district in the amazon estuary, Brazil. Braz J Biol 74: 315-324. WHITFIELD AK AND ELLIOTT M. 2002. Fishes as indicators of
environmental and ecological changes within estuaries: a review of progress and some suggestions for the future. J Fish Biol 61: 229-250.
Family Species Environment Seasonality EUFG FMFG FO N W (kg) Classification
Ch / Tc D/R GR GB MB
Acestrorhynchidae Acestrorhynchus sp. Tc R 1 1 0.076 LAI
Achiridae Achirus achirus Ch / Tc D ES ZB 3 8 0.7607 LAI LAI
*Apionichthys dumerili Ch / Tc D / R ES 15 783 0.9441 AI LAI AF
Syacium papillosum Tc D MS ZB 1 1 0.016 LAI
Anablepidae Anableps anableps Tc D / R ES HV 11 33 2.543 LAI LAI LAI
Anostomidae Leporinus fasciatus Ch R FS ZB 1 4 0.91 LAI
Leporinus friderici Ch / Tc D / R FS PV/ZB 4 5 0.725 LAI LAI
Apteronotidae Apteronotus albifrons Tc D / R FS ZP 6 12 1.508 LAI LAI
Orthosternarchus tamandua Ch D / R FS 2 2 0.1332 LAI LAI
Sternarchella schotti Ch R FS 1 7 0.0826 LAI
Sternarchella sima Ch D / R FS 5 8 0.0997 LAI LAI LAI
*Sternarchella terminalis Ch / Tc D / R FS 11 494 1.7886 AI LAI LAI
*Sternarchogiton sp. Ch / Tc D / R FS 10 345 1.1921 AI LAI LAI
*Sternarchorhamphus muelleri Ch / Tc D / R FS 10 41 1.5302 LAI LAI LAI
Sternarchorhynchus cf. roseni Ch R FS 1 1 0.0095 LAI
Ariidae Amphiarius phrygiatus Ch D / R ES 8 156 21.416 LAF
Aspistor sp. Ch / Tc D / R ES 3 8 1.25 LAI LAI
Bagre bagre Ch D MM PV/ZB 2 127 14.379 LAI
Cathorops sp. Ch D / R ES 4 67 12.601 LAI
Cathorops spixii Ch D / R ES ZB 10 429 11.891 AF
Sciades couma Ch / Tc D / R ES ZB 12 36 5.54 LAI LAF
*Sciades herzbergii Ch / Tc D / R ES ZB 6 20 1.353 LAI LAI LAI
Aspredinidae Aspredinichthys filamentosus Ch / Tc D / R ES ZB 13 125 1.7946 LAI LAF
Aspredinichthys tibicen Ch D / R ES ZB 3 27 0.2363 LAI
*Aspredo aspredo Ch / Tc D / R ES ZB 30 3099 14.904 AF AF AF
Auchenipteridae *Ageneiosus ucayalensis Ch / Tc D / R FM ZB 40 507 36.859 AF AF LAF
Ageneiosus inermis Tc D FS PV/ZB 1 1 0.535 LAI
Auchenipterus nuchalis Tc D 1 1 0.052 LAI
*Pseudauchenipterus nodosus Ch / Tc D / R FS ZB 15 61 3.3006 LAI LAI LAF
*Trachelyopterus galeatus Ch / Tc D / R FS PV/ZB 14 69 4.1159 LAI LAI LAI
Belonidae Strongylura timucu Ch D / R MS PV 2 2 0.0178 LAI LAI
Carangidae Oligoplites palometa Ch D MM PV/ZB 4 36 3.1 LAI
Trachinotus carolinus Ch D MM ZB 1 2 0.218 LAI
Cetopcidae Cetopsis coecutiens Ch D FS 2 2 0.1479 LAI LAI
Characidae Acestrocephalus sp. Ch / Tc D / R FS 5 11 0.1053 LAI LAI
Astyanax fasciatus Tc D / R FS ZB 11 41 0.827 LAI LAI LAI
Astyanax sp. Ch / Tc D / R FS ZB 2 8 0.114 LAI
Pristobrycon calmoni Ch / Tc D FS PV/ZB 3 4 0.072 LAI
Serrasalmus sp. Ch / Tc D FS PV/ZB 2 6 0.206 LAI LAI
Triportheus elongatus Ch / Tc D / R MS ZB 8 21 1.6256 LAI
Cichlidae Cichla sp. Ch / Tc D / R FS PV 3 8 2.642 LAI
Crenicichla cincta Ch / Tc D / R FS 2 5 0.91 LAI
SUPPLEMENT TABLE I
Composition of the ichthyofauna captured in the three sampling zones. Guamá River – GR; Guajará Bay – GB; Marajó Bay - MB. Main Channel - Ch and Tidal creek - Tc; Dry – D and Rainy – R; Estuarine Use Functional Groups (EUFG) - Marine Stragglers (MS); Marine Migrants (MM); Estuarine Species (ES); Freshwater Migrants (FM), and Freshwater Stragglers (FS); Feeding Mode Functional Groups (FMFG) - Zooplanktivore (ZP); Detritivore (DV); Piscivore (PV); Zoobenthivore (ZB); Opportunist/Omnivore (OP);
Piscivore/Zoobenthivore: PV/ZB; Insectivore (IS). (*) species present in all the studied area and environments. Abundant and Frequent (AF); Abundant and Infrequent (AI);
Family Species Environment Seasonality EUFG FMFG FO N W (kg) Classification
Ch / Tc D/R GR GB MB
Crenicichla johanna Tc D / R FS PV 4 6 0.835 LAI LAI
Crenicichla lugubris Tc D FS 1 3 0.744 LAI
Crenicichla semifasciata Tc R FS 2 3 0.446 LAI LAI
Crenicichla sp. Tc D / R FS 3 4 0.317 LAI
Geophagus proximus Ch / Tc D / R FS DV 9 27 2.083 LAI LAI
Geophagus sp. Ch D FS 1 1 0.172 LAI
Geophagus surinamensis Ch / Tc D / R FS DV 6 12 0.868 LAI LAI
Clupeidae Rhinosardinia amazonica Ch D FS ZP 1 3 0.0011 LAI
Ctenoluciidae Boulengerella cuvieri Ch D / R FS PV 2 2 0.496 LAI LAI Curimatidae *Curimata inornata Ch / Tc D / R FM HV 17 110 3.85 LAI AF LAI
Cynodontidae Raphiodon vulpinus Ch D FS PV 1 1 0.192 LAI
Doradidae *Lithodoras dorsalis Ch / Tc D / R FS HV 34 935 288.44 LAF AF LAF
Lithodoras sp. Ch / Tc D / R FS HV 2 2 0.152 LAI LAI
Engraulididae *Anchoa spinifer Ch / Tc D / R MM ZB 25 866 12.605 AF AI AF
*Anchovia surinamensis Ch / Tc D / R FM 19 757 3.1444 LAF LAI AF
Anchoviella cayennensis Ch D / R MS 4 39 0.0868 LAI
Anchoviella guianensis Ch D / R FS HV 3 79 0.05 LAI LAI
Cetengraulis edentulus Ch D / R MS HV 3 42 1.7 LAI LAI
Engraulidae sp 1 Ch D 1 1 0.004 LAI
Engraulidae sp 2 Ch D 1 1 0.018 LAI
Engraulidae sp 3 Ch D 1 1 0.004 LAI
*Lycengraulis batesii Ch / Tc D / R FM ZB 26 249 9.8253 LAF AF LAF
Lycengraulis grossidens Ch D ES ZB 1 8 0.136 AI
Pterengraulis atherinoides Ch / Tc D / R ES PV/ZB 3 14 0.6452 LAI LAI
Erythrinidae Hoplias malabaricus Tc D / R FS PV 9 20 1.886 LAI LAI LAI Gasteropelecidae Gasteropelecus levis Ch D FS ZB 1 1 0.002 LAI
Gobiidae Gobioides broussonnetii Ch D / R ES 4 24 0.1315 LAI
Haemulidae Genyatremus luteus Ch D MM ZB 15 2 0.126 LAI
Heptapteridae *Pimelodella gr. altipinnis Ch / Tc D / R FS ZB 30 1792 11.817 AI AF AF
Pimelodella sp. Ch D FS 1 1 0.078 LAI
Rhamdia quelen Tc D / R FS ZB 5 12 0.955 LAI LAI LAI
Hypopomidae Steatogenys elegans Ch D / R FS 8 181 0.7185 AI LAI LAI
Loricariidae Acanthicus hystrix Ch R FS 1 1 3.62 LAI
Ancistrus sp. Ch R FS ZB 1 1 0.026 LAI
Ancistrus sp.1 Tc R FS ZB 1 1 0.034 LAI
Ancistrus sp.2 Tc D / R FS ZB 2 2 0.168 LAI
Ancistrus sp.3 Tc R FS ZB 3 3 0.236 LAI
Farlowella cf. hasemani Ch D FS 1 1 0.072 LAI
Hypostomus plecostomus Ch D / R FS ZB 4 13 1.3382 LAI
Hypostomus punctatus Ch D FS DV 1 1 0.108 LAI
Hypostomus sp. Tc R FS 1 1 0.142 LAI
Limatulichthys griseus Tc D 1 1 0.02 LAI
*Loricaria cataphracta Ch / Tc D / R FS DV 16 43 1.1482 LAI LAI LAF
*Peckoltia sp. Ch / Tc D / R FS DV 18 44 2.0164 LAI LAF LAI
Peckoltia sp.1 Ch / Tc D / R FS DV 3 3 0.58 LAI
Pseudacanthicus histrix Ch D FS 1 1 1.65 LAI
Pseudacanthicus spinosus Ch R FS 1 1 0.04 LAI
Mugilidae Mugil curema Ch D MS HV 1 35 5.666 LAI
Mugil incilis Ch D MS HV 2 13 1.846 LAI LAI
Mugil sp. Ch / Tc D MS 2 2 0.0645 LAI LAI
Muraenidae Not identified Ch D 1 1 0.0002 LAI
Paralichthyidae Citharichthys spilopterus Ch D ES ZB 1 2 0.032 LAI
Pimelodidae Brachyplatystoma
Family Species Environment Seasonality EUFG FMFG FO N W (kg) Classification
Ch / Tc D/R GR GB MB
Brachyplatystoma platynemum Ch D / R FS PV 5 7 10.136 LAI
Brachyplatystoma rousseauxii Ch D / R FM PV 25 420 122.2 AF LAI LAF
*Brachyplatystoma vaillantii Ch / Tc D / R FM PV 26 260 15.108 LAF LAI LAF
*Hypophthalmus marginatus Ch / Tc D / R FM ZP 22 229 32.985 LAF AF LAF
*Pimelodus blochii Ch / Tc D / R FS ZB 18 32 2.565 LAI LAI LAI
Platystomatichthys sturio Ch / Tc R FS 2 4 0.38 LAI
Propimelodus eigenmanni Tc R FS 1 1 0.106 LAI
Potamotrygonidae Plesiotrygon iwamae Ch D / R FS PV/ZB 3 5 0.4912 LAI
Plesiotrygon sp. Ch D / R 3 5 16.28 LAI
Potamotrygon motoro Ch D / R FS ZB 4 7 23.062 LAI
Potamotrygon sp. Ch D FS 1 1 0.382 LAI
Potamotrygon sp.1 Ch R FS 1 1 0.078 LAI
Potamotrygon sp.2 Tc R FS 1 1 0.082 LAI
Potamotrygon orbignyi Ch R FS 1 1 0.832 LAI
Potamotrygonidae Ch R 1 1 6.01 LAI
Pristigasteridae Pellona castelanaeana Ch D FM PV/ZB 3 5 1.99 LAI LAI
*Pellona flavipinnis Ch / Tc D / R FM PV 26 133 61.316 LAF LAI LAF
Rhamphichthyidae Rhamphichthys marmoratus Ch / Tc D / R FS ZB 6 15 3.094 LAI
*Rhamphichthys rostratus Ch / Tc D / R FS ZB 16 71 14.087 LAI LAI LAI
Sciaenidae Cynoscion acoupa Ch D MM PV/ZB 15 128 6.4486 AI LAI
Cynoscion leiarchus Ch D MM PV/ZB 2 20 0.1323 LAI
Cynoscion sp. Ch D MM 1 1 0.0006 LAI
Macrodon ancylodon Ch D / R MM PV/ZB 4 405 11.144 AI
Menticirrhus americanus Ch D MM PV/ZB 1 81 0.014 AI
Micropogonias furnieri Ch D / R MM ZB 7 197 1.0987 LAI LAI LAF
Nebris microps Ch D ES ZB 1 1 0.868 LAI
Ophioscion sp. Ch D 1 1 0.0007 LAI
*Pachypops fourcroi Ch / Tc D / R FS ZB 18 78 4.0424 LAI AF LAI
*Plagioscion auratus Ch / Tc D / R FS ZB 19 74 1.9816 LAI LAI LAF
*Plagioscion squamosissimus Ch / Tc D / R FM PV 42 5004 163.95 AF AF AF
*Plagioscion surinamensis Ch / Tc D / R FM PV 27 1153 33.994 AI AF AF
Stellifer microps Ch D / R ES ZB 12 14727 3.8286 AI AI AF
Stellifer naso Ch D / R ES ZB 14 4045 4.1937 LAI LAI AF
Stellifer rastrifer Ch D / R ES ZB 10 1558 0.6026 AI AI AF
Scombridae Scomberomorus brasiliensis Ch D MM PV 1 1 1.3 LAI
Sternopygidae Rhabdolichops caviceps Ch / Tc D / R FS ZB 5 18 0.2589 LAI LAI
*Rhabdolichops eastwardi. Ch / Tc D / R FS 7 668 1.6837 AI LAI LAI
*Sternopygus macrurus Ch / Tc D / R FS 9 32 5.107 LAI LAI LAI
Tetraodontidae Colomesus asellus Ch / Tc D / R FS ON 11 49 0.3935 LAI LAI
Trichiuridae Trichiurus lepturus Ch D MS PV 1 3 1.066 LAI