Arq. Bras. Med. Vet. Zootec., v.69, n.1, p.75-84, 2017
Image-based red blood cell counter for multiple species of wild and domestic animals
[Contador de células vermelhas baseado em imagens para múltiplas espécies de animais silvestres e domésticos]
C.R.M. Mauricio1,2, F.K. Schneider1, R.K. Takahira3, L.C. Santos2, H.R. Gamba1
1Universidade Tecnológica Federal ˗ Curitiba, PR
2Centro de Engenharias e Ciências Exatas ˗ Universidade Estadual do Oeste do Paraná ˗ Foz do Iguaçu, PR 3Departamento de Clínica Veterinária ˗ FMVZ ˗ Botucatu, SP
ABSTRACT
RBC count plays an important role in animal diagnosis. Despite the many technologies available in different automated hematology analyzers, when it comes to the blood of wild animals it is still difficult to find an easy and affordable solution for multiple species. This study aims to evaluate the proposed automatic red blood cell counter. Blood samples (1 ocelot - Leopardus pardalis, 1 monkey - Cebus apella,1 coati - Nasua nasua, 62 dogs - Canis familiaris, and 5 horses - Equus caballus) were analyzed using three methods: 1-manual count, 2-automatic count by image, and 3-semi-automatic count by image; blood from dogs and horses were also analyzed by a fourth method: 4-automatic count by impedance. The counts in methods 2 and 3 were produced by the proposed red blood cell counter. Results were compared using Pearson’s correlation and plots with different methods as the criterion standard. RBC counts in methods 1, 2, and 3 correlated very well with those in the method 4 (r ≥ 0.94). RBC counts produced by method 2 were highly correlated with method 3 (r = 0.998). The results indicate that the proposed method can be used as an automatic or semi-automatic counting method in clinics that are currently using the manual method forRBC assessment.
Keywords:automatic Image-based RBC counting, Cebus apella, Leopardus pardalis, Nasua nasua, Wild Animals
RESUMO
A contagem de células vermelhas do sangue desempenha um papel importante no diagnóstico de animais. Apesar da existência de muitas tecnologias em diferentes contadores automatizados para análise de sangue, quando se trata do sangue de animais silvestres ainda é difícil encontrar uma solução simples e econômica para múltiplas espécies. O objetivo deste estudo é avaliar o contador de células vermelhas proposto. Amostras de sangue (uma jaguatirica - Leopardus pardalis, um macaco - Cebus apella, um quati - Nasua nasua, 62 cães - Canis familiaris e cinco cavalos - Equus caballus) foram analisadas por três métodos: 1 - contagem manual, 2 - contagem automática por imagem e 3 - contagem semiautomática por imagem; as amostras de cães e cavalos foram analisadas por um quarto método: 4 - contagem automática por impedância. As contagens dos métodos 2 e 3 foram obtidas usando-se o contador de células vermelhas proposto. Os resultados foram comparados por meio da correlação de Pearson e gráficos com diferentes métodos como valor de referência. As contagens dos métodos 1, 2 e 3 se correlacionaram muito bem com as contagens do método 4 (r ≥ 0.94). As contagens produzidas pelo método 2 apresentaram alta correlação com o método 3 (r = 0.998). Os resultados indicam que o contador proposto pode ser usado como um método de contagem automática ou semiautomática em clínicas que usam o método manual para contagem de células vermelhas do sangue de animais.
Palavras-chave:animais silvestres, Cebus apella, Contagem automática de RBC baseada em imagens, Leopardus pardalis, Nasua nasua
Recebido em 24 de junho de 2015
INTRODUCTION
Blood analysis is one of the most common tests performed to support diagnosis for animals. Nevertheless, when the subject under analysis is a wild animal it is still challenging to find an affordable solution that can be easily adopted by the clinical staff in-house or on the field. A study on sea otters used manual methods for hematologic analyses, including RBC and WBC counts, due to the remoteness of the site (Goldstein et al., 2011).
The use of indirect methods to mathematically estimate RBC mass using hematocrit may induce error (Strauss et al., 2003). The RBC of some wild animals presents variations in cell size, number and shape when compared to other species. The number of RBC is inversely proportional to their size, species like Mazama rufina have small cells, but in large numbers. Thus, the percentage of RBC in the total blood volume (packed cell volume) will not have a large variation between species (Almosny and Santos, 2001) despite the large variation in cell number. Hemoparasites can also interfere in the hematocrit and in hemoglobin determination (Santos, 1999). These factors can lead to errors when estimating RBC mass using indirect methods.
The optical microscope was the introductory method for cells classifying and counting in human beings and animals. The microscope method is highly dependent on the laboratory personnel, by this we mean that the results may vary with the performance of a technician and thus among the technicians.
Automatic counters that produce more specific results and thus apply less subjective criteria were proposed. A milestone method for counting RBC was introduced by Wallace Coulter (Coulter, 1953). The Coulter method of cell counting is based on the electrical impedance variation of the blood fluid and its suspended particles, when passing through a sensing aperture in a capillary. This method allows the determination of the number of cells and an estimation of their mean size. In the 1970s, automated equipments became commercially available for human blood evaluation (Preston, 1986). While such equipments proliferated with
equipments for analysis of blood of different species of wild animals available to be used in care centers and institutions such as zoos and wildlife care centers. This is mainly due to the variety of animal species and the difficulty in finding an economically viable technical approach capable of handling all variations (e.g., concentration, size and shape) in those blood samples. Additionally, the tests carried out in electrical impedance based equipments require the use of specific reagents for each animal species (Becker et al., 2008). This feature leads to the lack of reagent for some species and the need for the laboratory to have many reagents even when few tests are needed for a given species.
Previous work demonstrated the use of an image based algorithm to execute the counting of RBCs of three animal species (Leopardus pardalis, Cebus apella and Nasua nasua) obtaining good results, with 3% errors. Nevertheless, these results were obtained comparing the automatic count by image to the results of 1) a manual count performed with the use of an optical microscope and Neubauer chambers, and 2) semi-automatic count by image that was considered as the ground truth. Tab. 1 shows the Pearson’s correlation of the three methods. The correlation of 0.989 of the automatic count by image compared to the semi-automatic count by image indicates the viability of the method. However, the results from the automatic count by image were not compared against an automatic hematology analyzer count since a calibrated equipment, suited to count RBC from different species of wild animals, was, and it is still, not available.
Table 1. Pearson’s correlation among the three methods for wild animal’s blood samples
MCa SACIb ACIc
1.000 0.954 0.940 0.954 1.000 0.989 0.940 0.989 1.000 a Manual Count; bSemi-Automatic Count by Image; cAutomatic Count by Image.
non-expert personnel to evaluate the RBC counting. The proposed automatic cell detecting and counting algorithm is capable of performing multi species RBC counting, self adapting for variations in number and size of the cells. Images that illustrate the variation of blood cell size and
concentration among different species of animals can be seen in Fig. 1. In this paper, dog and horse blood is used in order to compare the automatic count by image with counts generated by the automatic hematology analyzer.
Figure 1. Blood cells of five different species: a) Leopardus pardalis, b) Cebus apella, c) Nasua nasua, d) Canis familiaris, and e) Equus caballus. 200 X.
MATERIALS AND METHODS The evaluation of the proposed counting methods used two groups of blood samples, one consisting of wild animals and other of domestic animals. All RBC counting were conducted in less than 24h after sampling time (Brown et al., 2005; Sanches et al., 2013; Weiss et al., 1994).
The species used in the tests with wild animals are Ocelot - Leopardus pardalis, Monkey – Cebus apella, and Coati - Nasua nasua with typical RBC volumetric concentration shown in Tab. 2 (Jain, 1993; Santos, 1999). One blood sample from each of the three wild animal species was collected. The difficulty to obtain a higher number of wild animal samples refers to the fact that the animals are kept for conservation and protection. The costs and logistics of sampling the individuals are another reason for this difficulty (Miller et al., 2013). All samples were collected in ethylenediamine tetraacetic acid (EDTA) containing tubes as part of routine procedure for the animals of the Bela Vista Biological Sanctuary of Itaipu Hydroelectric Company, Foz do Iguaçu, Paraná, Brazil. The samples were used for image registration after the conclusion of the routine tests performed at the Environmental Laboratory of Itaipu Hydroelectric. The animals were considered clinically healthy at the time of sampling.
Table 2. Reference intervals of RBC counting for the species analyzed
Animal RBC (x106/µL)
Canis familiaris 5.50-8.50 Equus caballus 6.10-11.0 Leopardus pardalis 4.07-6.16 Cebus apella 3.47-5.48 Nasua nasua 3.88-5.35
Blood from two species of domestic animals were included in the tests, sixty-two dogs - Canis familiaris and five horses - Equus caballus, totalizing 67 samples from different animals. Samples were taken for both clinically healthy and ill animals, of different breeds, ages and gender. All samples were collected in EDTA containing tubes as part of diagnostic procedures for patients at the Veterinary Clinic Laboratory of the Department of Clinics of the University Animal Hospital at FMVZ-Unesp, Botucatu, Brazil. The typical RBC concentration for these animals is shown in Tab. 2 (Jain, 1993; Santos, 1999). Samples were used for image registration when they were ready to be discarded. Ethical approval for animal blood use was registered under number 31/2013 from a local ethical committee.
species and the results compared with the ones produced by automatic equipment.
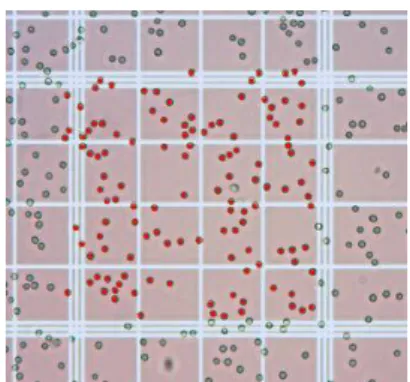
Manual and image processing methods used the Neubauer counting chamber. The chamber includes adequate regions for counting both high and low concentration values of theelements of interest (Fig. 2), and is commonly used in RBC counts for wild animals’ blood (Chapple et al., 1991; Madella et al., 2006; Silva and Freitas, 2008; Silva et al., 1999).
Hemocytometers, like Neubauer chamber, are very useful tools for cell counting in laboratory activities (Almosny and Monteiro, 2006; Santos, 1999). Studies on wild animals often use manual methods with the hemocytomer (Almosny and Santos, 2001). Other examples of RBC counts for different species include Chital deer (Chapple et al., 1991), Brown mink (Weiss et al., 1994), Coatis (Silva et al., 1999), Pampas deer (Uhart et al., 2003), Pallas’ cats (Brown et al., 2005), Capybaras (Madella et al., 2006), Spanish ibex (Casas-Díaz et al., 2008), Native and exotic caprines (Silva and Freitas, 2008), Wild pichis (Superina et al., 2008), Fur seals (Norberg et al., 2011), Island fox (Inoue et al., 2012), Moose (Rostal et al., 2012), Norwegian reindeer (Miller et al., 2013), Giant anteaters (Sanches et al., 2013) Black howler monkey (Santos et al., 2013). It is also possible to find studies on humans and domestic animals, that use the hemocitometer, e.g. Humans (Beck et al., 2009), Ovine (Sousa et al., 2012) and Bovine (Birgel Junior et al., 2001).
Figure 2. Neubauer chamber with nine 1x1mm2
squares. The chamber depth is 0.1mm resulting in a 0.9mm3 volume. The four squares in the
corners are divided in 1/16mm2 regions (e.g., 1B
square). The central square is composed by 1/25mm2 regions (e.g., 1A square), each one
divided in 16 smaller regions with 1/400mm2.
The regions used for image acquisition are shown in Fig. 2, in the Neubauer image the five inner regions are indicated (i.e., 1A, 2A, 3A, 4A, 5A) with 1/25mm2each, and the four peripheral
regions (i.e., 1B, 2B, 3B, 4B) with an area of 1/16mm2, that were selected as the regions of
interest (ROI) for RBC counting. Images with two focal setups were registered for each one of these ROIs. The first focal setup was adjusted to make the cells look dark and sharp (focus 1 - F1). The second focus (focus 2 - F2) position was set at 15μm beyond the F1 position resulting in an image where cells present dark and blurry border with a bright interior. Examples of both resulting images are presented in Fig. 3. Details of the two focal setups are presented by Mauricio (Mauricio et al., 2010).
Figure 3. Images of Canis familiaris blood sample in a Neubauer chamber acquired using focus (a) F1 and (b) F2. 200 X.
An Olympus BX41 optical microscope (Olympus Corporation, Tokyo, Japan) with a 20X planar objective was used for wild animal
Three chambers for the Leopardus pardalis and Nasua nasua and two for Cebus apella were prepared for image capture, totaling 8 sets of images. Diluted blood was prepared at a 1:200 ratio using 10μl of blood sample and 1990μl of saline solution (NaCl at 0,9%) (Mauricio et al., 2010; Santos, 1999).
A Leyca DMLS optical microscope (Leyca Microsystems, Wetzlar, Germany) with a 20X planar objective was used for domestic animal samples. A Motic digital camera (Motic, Hong Kong, China) with 1280x1024-pixel resolution was used to save images in lossless JPEG compressed format. Diluted blood was prepared at a 1:201 ratio using 10μl of blood sample and 2000μl of saline solution (NaCl at 0.9%).
Four counting methods, named Manual Count – MC, Semi-Automatic Count by Image – SACI, Automatic Count by Image – ACI and Automatic Count by Impedance - ACIMP were used for evaluating the Image-Based Red Blood Cell Counter.
Blood samples were manually counted using Neubauer chambers after preparing samples according to the protocol described by Santos (Santos, 1999). RBC counting for the wild animal samples were performed by the personnel from the Environmental Laboratory of Itaipu Hydroelectric, using the Olympus BX41 optical microscope. For the domestic animal samples, in-clinic experts from the Veterinary Laboratory in São Paulo State University-Botucatu Campus, counted the cells using the Leyca DMLS optical microscope. Both laboratories followed the manual count standard procedure recommended by the International Council for Standardization in Haematology - ICSH (England, 1994).
An image processing computer software was developed for aiding expert and non-expert personnel in the RBC counting using the SACI method.
The developed computer software first counts the cells present in the image, then the image focused at F1, with marked counted cells (e.g., red marks), is presented and the user corrects the count deleting counted debris or including the cells that were missed. After necessary corrections are made, the processed images, including cell centroid coordinates (x,y) and the
RBC counting value, are saved for later comparison. Counted cells are colored (Fig. 4) in real-time to avoid the occurrences of non counted cells or cells counted twice.
Figure 4. Red marks identify the cells counted with the computer-aided counting software. 200 X.
This on-the-fly counting feedback enables the user to promptly correct a mark that was added in the absence of a cell or a mark that was forgotten in the presence of a cell. By providing such error control, it is expected that this computer aided counting method generates more reliable results when compared to those from the typical manual assessment method made in laboratories where no image is registered. The counting was performed by an experienced biochemist and two lay collaborators also following the procedure recommended by the ICSH (England, 1994).
Since there are two groups of images for ROIs, namely A and B, the results for the SACI method in these different areas will be called SACI A and SACI B. The areas for ROIs A and B can be seen in Fig. 2. The same identification is used for the ACI method, the results will be called ACI A and ACI B.
Central coordinates and areas in pixels are determined for each one of the segmented cells. The reference value taken as a Typical Area Value – TAV is the median value of an ordered vector that includes the areas in pixels of all segmented regions. Every region within the area range of 0.5TAV to 1.5TAV is considered cell to compensate for cell size variation and the grid lines artifacts.
For the ACIMP counts, the samples were analyzed using a commercial automatic hematology analyzer (Hemascreen 18, Ebram, São Paulo, Brazil) for the RBC count. Samples from dogs and horses were diluted in its standard commercial isotonic diluent (Ebraton, Ebram). This method was applied only for samples of domestic animals.
RESULTS
Correlation, scatter and difference plots for the four methods are presented. Fig. 5 presents the counts distribution for the three methods, i.e., MC, SACI A and ACIMP. Tab. 3 presents the Pearson´s correlation for the counts made by an experienced biochemist and two lay collaborators using the SACI.
The results presented in Tab. 3 show very high correlations for the three operators (Biochemist, Lay1, and Lay2), therefore, the average of the
SACI method will be taken for comparison with the other methods.
1 2 3 4 5 6 7 8 9 10
1 2 3 4 5 6 7 8 9 10
Reference Values
Co
un
te
d
V
al
ue
s
Counts distribution (x106/µL)
MC SACI A ACI A
Figure 5. Manual counting compared to automatic and computer aided counting results for the ROI A.
Table 3. Pearson’s correlation for three observers performing the Semi-automatic count by image-SACI
Biochemist Lay1 Lay2 1.000 0.999 0.999
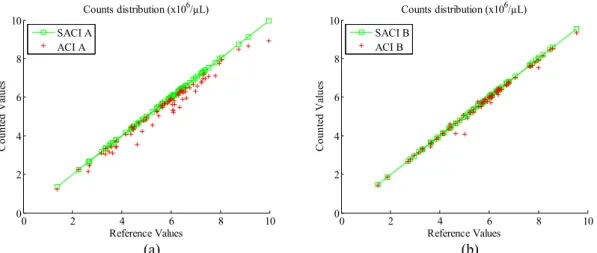
The result from SACI compared to the ACI for ROIs A and B is presented in Fig. 6 (a) and Fig. 6 (b) respectively. Tab. 4 presents correlation between the four methods. ROI A is used for MC, SACI, ACI.
0 2 4 6 8 10
0 2 4 6 8 10
Reference Values
C
ou
nte
d
V
alu
es
Counts distribution (x106/µL) SACI A
ACI A
0 2 4 6 8 10
0 2 4 6 8 10
Reference Values
C
ou
nte
d
V
alu
es
Counts distribution (x106/µL) SACI B
ACI B
(a) (b)
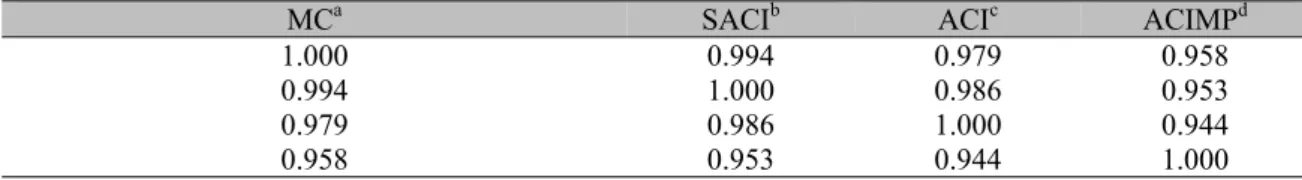
Table 4. Pearson’s correlation among the four methods for domestic animal blood samples
MCa SACIb ACIc ACIMPd
1.000 0.994 0.979 0.958
0.994 1.000 0.986 0.953
0.979 0.986 1.000 0.944
0.958 0.953 0.944 1.000
a Manual Count
b Semi-Automatic Count by Image c Automatic Count by Image d Automatic Count by Impedance
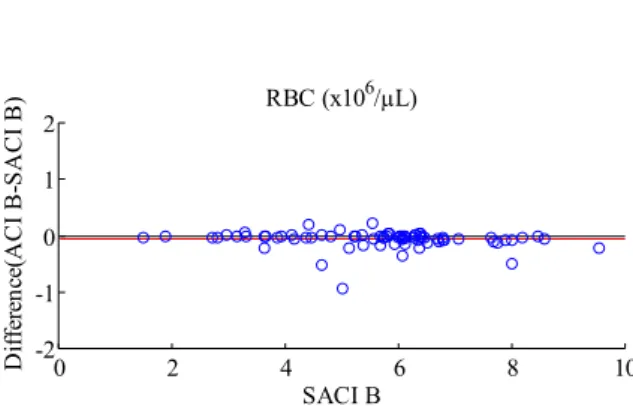
Difference plots for methods MC, SACI, ACI are presented in Fig. 7 (a) and 7 (b).
0 2 4 6 8 10
-2 -1 0 1 2
SACI A
D
iff
er
en
ce
(A
C
I A
-S
A
C
I A
) RBC (x106/µL)
0 2 4 6 8 10
-2 -1 0 1 2
SACI B
D
iffe
re
nc
e(A
C
I B
-S
A
C
I B
) RBC (x106/µL)
(a) (b)
Figure 7. Difference plots for RBC count in ROI A(a) and ROI B(b). Automatic count by image and Semi-automatic count with wild and domestic samples, without outliers.
One example of alteration of sample quality is shown in Fig. 8. In Fig. 8 (a) most cells are as expected and in Fig. 8 (b) many cells became larger and transparent.
The effect of using samples with such artifacts can be seen in the difference plot Fig. 9. Three additional samples that presented artifacts are considered, resulting in three outliers, all under the identity line.
0 2 4 6 8 10 -2
-1 0 1 2
SACI B
D
iff
eren
ce(A
C
I B
-S
A
C
I B
) RBC (x106/µL)
Figure 9. Difference plots for RBC count in ROI B. Image based and Biochemist count with wild and domestic samples, with 3 outliers.
DISCUSSION
The manual method is used for the RBC assessment in hemograms of wild animals in many recent research projects (Goldstein et al., 2011; Inoue et al., 2012; Miller et al., 2013; Norberg et al., 2011; Rostal et al., 2012; Sanches et al., 2013; Santos et al., 2013), and it is often used as the gold standard. In Fig. 5 the MC was used as the reference method. The plot shows a good agreement for the MC, SACI, and ACI methods. Tab. 1, 3, and 4 present the Pearsons’ coefficient correlations.
In comparing different methods for the RBC assessment it is important to find a single gold standard. That is an important and difficult task, because each method has advantages and limitations. Therefore, to select one method for reference, several factors were considered. The manual counts are affected by human counting errors (Becker et al., 2008). Thus, comparing the ACI results with the MC might bring more uncertainty to the comparison process. Also comparing them with those from the ACIMP could include a sample preparation bias due to the fact that sample preparation is automatic for this method, opposed to the manual sample preparation for all other methods discussed here (i.e., MC, SACI, and ACI methods). Different sample preparation can lead to different results due to small variations in dilution of blood and Neubauer chamber filling. Considering all these factors, the SACI method was adopted as the gold standard.
Pearson correlation coefficient for the MC method is better for SACI than for ACIMP (i.e. r=0.994 and r=0.958 respectively) (Tab. 4). Additionally, all three methods in Fig. 5 are
small. The SACI method reduces human counting error by providing the user with the aid of a graphical interface which helps the user to document and to differentiate counted from non-counted cells and allows real-time correction of possible errors.
One generally observed cause for the differences between different observers in manual counting, even following the manual count standard procedure, is due to the fact that it is challenging having every person considering the same cells as valid cells in a given ROI. Even with that difficulty, three different observers (e.g. Experienced biochemist and two lay collaborators) using the SACI method to count the cells, have produced results with high correlation, r ≥ 0.99, as shown in Tab. 3. This result demonstrates that the SACI method has the potential for avoiding common errors in the manualassessment, allowing the recording of the results with the possibility of latter counting verification, which is not possible in the manual method where no visual record is made.
MC-to-ACIMP, SACIMP, ACI-to-ACIMP correlations of 0.958, 0.953 and 0.944, respectively, were found. When the same sample preparation was used, which is the case for MC, SACI, and ACI methods, similar results were found.
Along the experiments, three samples presented alterations in cell size, shape and opacity. These samples were not considered in Fig. 7(a) and 7(b). The alterations were detected through visual inspection. The alterations and results for these samples can be seen in Fig. 8 and 9. While this kind of inspection can provide additional information for the clinician that can be useful in the diagnosis process, this result also shows a possible drawback of the ACI method since it shows that abnormal cells might lead to larger errors. Errors in the range shown in Fig. 9 (e.g., 0.94 million cells per µL in a 5.02 million cells per µL count) represent a maximum percent error of 18% which is larger than that known for manual assessment (Lehner et al., 2007). When only normal samples are used, the largest percent error is 5% (Fig. 7(b)).
Due to the fact that the main purpose of this proposed method is to replace or aid human counting, it is important to observe that the correlation between MC and ACI results is r = 0.940 and 0.979 (Tab. 1 and 4 respectively) leading to a reliable and clinically useful result. Additionally, if the SACI method is considered, the correlation grows to 0.994. The additional effort is having a human observer that can correct the counting of a few cells after the SACI presents the preliminary image with counted cells. This procedure is aided by the user navigation through a graphical interface.
CONCLUSION
The results indicate that both the ACI and SACI methods can provide clinically useful results, improving the efficiency and confidence of the results specially in clinics working with multiple species since the method is self adaptable for variations in cell size and number of cells. Tab. 2 shows that the species used in the tests present an RBC interval of 3.47-11.0 x10⁶/µL, this interval
enables the method to count RBC of several wild animal species. The methods are also capable of image recording that allows good test documentation and latter counting re-evaluation when needed.
ACKNOWLEDGMENTS
This work was supported in part by the Fundação Araucária de Apoio ao Desenvolvimento Científico e Tecnológico do Paraná. Authors
thank Joyce Cristiane Klock and Gabriel Kovalhuk for their support in the execution of counting activities in this work, and Fabiana Frata Furlan Peres for her help in manuscript revision.
REFERENCES
ALMOSNY N.; MONTEIRO A. Patologia clínica. In: CANTÃO-DIAS, J.L.; CUBAS, Z.V.; SILVA, J.C.R. (Eds.). Tratado de animais selvagens. São Paulo: Roca, 2006. p.939-966.
ALMOSNY, N.; SANTOS, L. Laboratory support in wild animal medicine. In: FOWLER, M.E. (Ed.). Biology, medicine, and surgery of south American wild animals. Iowa: University Press, 2001. p.500-505.
BECK, Z.; BROWN, B.K.; WIECZOREK, L. et al. Human erythrocytes selectively bind and enrich infectious HIV-1 virions. PLoS ONE, v.4, p.e8297, 2009.
BECKER, M.; MORITZ, A.; GIGER, U. Comparative clinical study of canine and feline total blood cell count results with seven in-clinic and two commercial laboratory hematology analyzers. Vet. Clin. Pathol., p.373-384, 2008.
BIRGEL JUNIOR, E.H.; D’ANGELINO, J.L.; BENESI, F.J.; BIRGEL, E.H. Valores de referência do eritrograma de bovinos da raça Jersey criados no estado de São Paulo. Arq. Bras. Med. Vet. Zootec., v.53, p.1-9, 2001.
BROWN, M.; LAPPIN, M.R.; BROWN J.L. et al. Exploring the ecologic basis for extreme susceptibility of Pallas' cats (Otocolobus manul) to fatal toxoplasmosis. J. Wildl. Dis., v.41, p.691-700, 2005. CASAS-DÍAZ, E.; LÓPEZ-OLVERA, J.R.; MARCO, I. et al. Hematologic and biochemical values for Spanish ibex (Capra pyrenaica) captured via drive-net and box-trap. J. Wildl. Dis., v.44, p.965-972, 2008. CHAPPLE, R.S.; ENGLISH, A.W.; MULIEY, R.C.; LEPHERD, E.E. Haematology and serum biochemistry of captive unsedated chital deer (axis axis) in Australia. J. Wildl. Dis., v.27, p.396-406, 1991.
COULTER W.H. Means for counting particles suspended in a fluid. Patent 2.656.508., 27 Aug. 1949, 20 Oct. 1953. Chicago, Ill: United States Patent Office, 1953.
GOLDSTEIN, T.; GILL, V.A.; TUOMI, P. et al. Assessment of clinical pathology and pathogen exposure in sea otters (Enhydra lutris) bordering the threatened population in Alaska. J. Wildl. Dis., v.47, p.579-592, 2011.
INOUE, H.; CLIFFORD, D.L.; VICKERS, T.W. et al. Biochemical and hematologic reference intervals for the endangered island fox (Urocyon littoralis). J. Wildl. Dis., v.48, p.583-592, 2012.
JAIN, N.C. Essentials of veterinary hematology. Philadelphia: Lea & Febiger, 1993. 417p.
LEHNER, J.; GREVE, B.; CASSENS, U. Automation in hematology. Transfus. Med. Hemoth., v.34, p.328-339, 2007.
MADELLA, D.A.; FELISBERTO, M.E.; SOUZA, C.E.D. Valores hematológicos de capivaras (hydrochoerus hydrochaeris) rodentia: hydrochoeridae de vida livre na região de Campinas-SP. Ciênc. Rural, v.36, p.1321-1324, 2006.
MAURICIO, C.R.M.; SCHNEIDER, F.K.; SANTOS, L.C.D. Image-based red cell counting for wild animals blood. In: ANNUAL INTERNATIONAL CONFERENCE OF THE INSTITUTE OF ELECTRICAL AND ELECTRONICS ENGINEERS ENGINEERING IN MEDICINE AND BIOLOGY SOCIETY, 2010. Buenos Aires. Proceedings… Buenos Aires: [IEEE], 2010. p.438-441.
MILLER, A.L.; EVANS, A.L.; OS, Ø.; ARNEMO, J.M. Biochemical and hematologic reference values for free-ranging, chemically immobilized wild norwegian reindeer (rangifer tarandus tarandus) during early winter. J. Wildl. Dis., v.49, p.221-228, 2013. NORBERG, S.E.; BURKANOV, V.N.; TUOMI, P.; ANDREWS R.D. Hematology of free-ranging, lactating northern fur seals, Callorhinus ursinus. J. Wildl. Dis., v.47, p.217-221, 2011.
PRESTON, K. High-resolution image analysis. J. Histochem. Cytochem., v.34, p.67-74, 1986.
ROSTAL, M.K.; EVANS, A.L.; SOLBERG, E.J.; ARNEMO, J.M. Hematology and serum chemistry reference ranges of free-ranging moose (Alces alces) in Norway. J. Wildl. Dis., v.48, p.548-559, 2012.
SANCHES, T.C.; MIRANDA, F.R.; OLIVEIRA, A.S.; MATUSHIMA, E.R. Hematology values of captive giant anteaters (Myrmecophaga tridactyla) and collared anteaters (Tamandua tetradactyla). Pesqui. Vet. Bras., v.33, p.557-560, 2013.
SANTOS, L.C.; CUBILLA, M.P.; MORAES, W. et al. Hemotropic mycoplasma in a free-ranging black howler monkey (Alouatta caraya) in Brazil. J. Wildl. Dis., v.49, p.728-731, 2013.
SANTOS, L.C.D. Laboratório ambiental. Cascavel: Edunioeste, 1999. 341p.
SILVA, G.D.A.; FREITAS, M.M.S. Avaliação hematologica de caprinos exóticos e nativos no semi-árido paraibano. Ciênc. Agrotec., v.32, p.561-566, 2008.
SILVA, R.A.M.S.; VICTORIO, A.M.; RAMIREZ L. et al. Hematological and blood chemistry alterations in coatis (nasua nasua) naturally infected by trypanosoma evansi in the pantanal, Brazil. Rev. Elev. Med. Vet. Pays Trop., v.52, p.119-122, 1999.
SOUSA, R.S.; BARRETO-JUNIOR, R.A.; SOUSA, I.K. et al. Evaluation of hematologic, blood gas, and select biochemical variables in ovine whole blood stored in CPDA-1 bags. Vet. Clin. Pathol., v.42, p.27-30, 2012.
STRAUSS, R.G.; MOCK, D.M.; JOHNSON, K. et al. Circulating RBC volume, measured with biotinylated RBCs, is superior to the Hct to document the hematologic effects of delayed versus immediate umbilical cord clamping in preterm neonates. Transfusion, v.43, p.1168-1172, 2003.
SUPERINA, M.; MERA, R.L.S. Hematology and serum chemistry values in captive and wild pichis, Zaedyus pichiy (Mammalia, Dasypodidae). J. Wildl. Dis., v.44, p.902-910, 2008.
UHART, M.; VILA, A.; BEADE, M. et al. Health evaluation of pampas deer (Ozotoceros bezoarticus celer) at Campos del Tuyu wildlife reserve, Argentina. J. Wildl. Dis., v.39, p.887-893, 2003.
WEISS, D.; WUSTENBERG, W.; BUCCI, T.; PERMAN, V. Hemato logic and serum chemistry reference values for adult brown mink. J. Wildl. Dis., v.30, p.599-602, 1994.