1 INTRODUCTION
Ever since the clinical significance of red blood cells (RBCs) deformability became a possible way to diagnose several pathologies, many methods of measuring this phenomenon have been proposed. Some examples are the RBC filtration (Gueguen et al. 1984), laser diffraction ellipsometry (Shin et al. 2004), rheoscopy (Dobbe et al. 2002) and micropi-pette aspiration (Mokken et al. 1992). Recently, by using a soft lithography technique it is possible to fabricate transparent micrometer-sized channels to study motion and dynamical deformation of cells flowing through the microchannels (Abkarian et al. 2008, Fujiwara et al. 2009, Lima et al. 2009, Leble et al. 2012). In this study, we use an image analysis technique to characterize the motion and defor-mation of RBCs flowing through a microchannel having a smooth contraction shape (cf. Fig.1). In this shape the RBCs mechanical properties are under the effect both simple shear and extensional flow.
2 WORKING FLUIDS AND
MICROCHANNEL GEOMETRY
The working fluid examined was composed of Dextran 40 (Dx40) containing ~2% of human RBCs (i.e., hematocrit, Hct~2%). The blood used was col-lected from a healthy adult volunteer, and EDTA (ethylenediaminetetraacetic acid) was added to the samples to prevent coagulation. The blood samples were then washed by centrifugation and then stored hermetically at 4ºC until the experiments were per-formed at a temperature of ~37ºC.
The microchannels containing the smooth con-traction were produced in polydimethylsiloxane (PDMS) using a standard soft-lithography technique
from a SU-8 photoresist mold. The molds were pre-pared in a clean room facility by photo-lithography using a high-resolution chrome mask. The geometry of the fabricated microchannel is shown in Figure 1. The channel depth, h, was constant throughout the PDMS chip and the width of the upstream and downstream channels was the same, W1 = 50 µm.
The minimum width in the contraction region is W2
= 10 µm.
Figure 1 - RBCs flowing through a microchannel having a smooth contraction shape.
For the microfluidic experiments, the device con-taining the microchannel were placed on the stage of an inverted microscope (IX71, Olympus, Japan) and the temperature of the stage was adjusted by means of a thermo plate controller (Tokai Hit, Japan) to 37ºC. The flow rate of 1 µL/min was controlled us-ing a syrus-inge pump (KD Scientific Inc., USA). The images of the flowing RBCs were captured using a high speed camera (Phantom v7.1, Vision Research, USA) and transferred to the computer to be ana-lyzed. An illustration of the experimental setup is shown in Figure 2.
Visualization of red blood cells flowing through a PDMS microchannel
with a microstenosis: an image analysis assessment
F. C. Monteiro
1and B. Taboada
1,2and R. Lima
1,21
ESTiG, IPB, C. Sta. Apolonia, 5301-857 Bragança, Portugal.
2
CEFT, FEUP, R. Dr. Roberto Frias, 4200-465 Porto, Portugal.
Figure 2 - Experimental set-up.
3 IMAGE ANALYSIS
a) Pre-processing
The first step in image analysis is the pre-processing stage. At this stage, we remove the back-ground, noise and some artifacts of the original im-age, obtaining an image only with the RBCs.
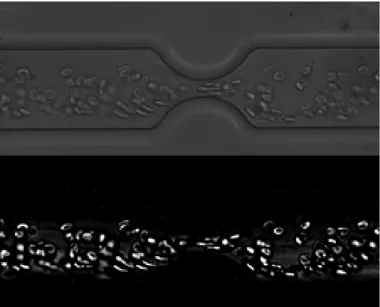
To improve the definition of RBCs the image contrast is adjusted and then we apply a median fil-ter in order to smooth out the image. Figure 3 shows the original image and the resulting image after pre-processing.
Figure 3 - Up- Original image; Down- Pre-processed image.
b) Segmentation
Image segmentation is one of the largest fields in image analysis, and aims at identifying regions, the so-called segments that have a specific meaning within images. The regions have to be uniform with respect to some parameter, such as image intensity, texture or motion. In our case, the image segmenta-tion is performed using the watershed method which allows the division of the image into micro-regions. We start by computing the image gradient magni-tude and remove the weakest edges by gradient
min-ima suppression (pre-flooding). Figure 4 shows the result of the watershed method.
Figure 4: Result of watershed method.
The micro-regions are clustered into RBC re-gions, taking into account the similarity of their op-tical flow components. Figure 5 shows the input for the optical flow calculation. This image has a black background and the segmented regions are shown with the original color.
Figure 5 – Image with a black background and the segmented regions with the original color.
There is a strong interdependence between the definition of the spatial support of a region and of its motion estimation. On the one hand, estimation of the motion information of the region depends on the region of support. Therefore, a careful segmentation of the regions is needed in order to estimate the mo-tion accurately. On the other hand, a moving region is characterized by coherent motion characteristics over its entire surface (assuming that only rigid mo-tion is permitted). Therefore, a precise estimamo-tion of the motion is required in order to obtain an accurate segmentation of the region.
All the motion estimation approaches assume that there is a point correspondence between two consec-utive frames which induces dense motion vector field of an image. No matter what method is used, at some stage we need a mechanism to assign each point to one of the recovered motions. This mecha-nism must take into account the smoothness of the world, i.e., the intuitive notion that the points be-longing to the same motion are also spatially clus-tered in the image.
Brox et al. (Brox et al. 2004) which can provide dense optical flow information. This method accel-erates convergence by allowing global motion fea-tures to be detected immediately, but it also im-proves the accuracy of flow estimation because it provides better approximation of image gradients via warping. This technique is implemented within a multiresolution framework, allowing estimation of a wide range of displacements.
Estimating optical flow involves the solution of a correspondence problem. That is, what pixel in one frame corresponds to what pixel in the other frame. In order to find these correspondences one needs to define some properties that are not affected by the displacement. Differential methods for optical flow are based on several assumptions:
Grey value constancy assumption – With this assumption it is assumed that the grey value of a pixel is not changed by the displacement (1).
(1) Gradient constancy assumption – Since the grey value constancy assumptions has the disad-vantage of being quite susceptible to slight changes in brightness, it is assumed that the gradient of the image grey value does not vary due the displacement (2).
(2) Smoothness assumption - Once that the model estimates the displacement of a pixel without taking into account any interaction with the neigh-boring pixels, problems may occur if the gradient vanishes somewhere, or if only the flow in normal direction to the gradient can be estimated, and also its expected some outliers in the estimates. The smoothness of the flow will reduce these problems.
Deviations from these assumptions of the model are penalized through the creation of an energy func-tion. Considering x:= (x,y,t)T and w :=(u,v,1)T, the global deviation from the grey value constancy and the gradient constancy assumption are measures by the energy.
(3)
with γ being a weight between both assumptions. The concave function ψ when is increased allows that the outliers don’t get much influence on the es-timation.
The function (4) penalizes the total variation of the flow field.
(4)
The total energy is the weighted sum between the data term and the smoothness tern (5).
(5)
with some regularization parameter α > 0. Now the goal is to find the functions u and v that minimize this energy.
Figure 6 shows an illustration of the optical flow obtained in our study.
Figure 6: Optical flow example.
c) Tracking
The cell tracking is performed following the key-hole model proposed by Reyes-Aldasoro et al. (Reyes-Aldasoro et al. 2007). In this model, assum-ing that child RBC (cell at frame t) moves in the same direction and velocity as its parent (cell at frame t-1) it is possible to predict the position of the cell in the next frame. So, two regions are defined where, probably, we can find the child RBC: a nar-row edge (60º wide) oriented towards the predicted position of the child RBC, and the other region cor-responds to a truncated circle (300°) centered on the parent, together they resemble a keyhole. In our case we considered that the radius of the wedge is 60 pix-els and the radius of the circle is 15 pixpix-els.
The keyhole model (Figure 7) was designed in an image with 141x141 pixels with a black background and made up to match the center of the circle with the centroid of each cell. This design allows the keyhole model to rotate 180º.
Figure 7: Keyhole model.
4 RESULTS AND DISCUSSION
With this study it was observed that the optical flow computation is a promising method to take into account to track cells. The direction of optical flow, obtained for each region, allowed to place the key-hole model so that it includes the child cell, and then it was possible to identify and characterize the cell.
In case that the keyhole model has only one solu-tion, that is automatically considered to be the child cell. Then it is possible to compare the child cell characteristics, such as centroid, area and optical flow amplitude, with the same characteristics of the parent cell. Figure 8 shows the result obtained for the cell 1 when looking for its child cell in image 3 to image 5. As shown in Figure 8, we have obtained only one result, and this is considered to be the child cell. Analyzing the centroid, the optical flow ampli-tude and the area of the child cell we have observed that they do not change much from the parent cell to the child cell, thus corroborating that the region ob-tained corresponds indeed to the cell child.
Figure 8: Results obtained for cell 1 from image 3 to image 5
If the keyhole model has more than one solution, the child cell is found taking into account the simi-larities between the child cell characteristics and the same parent cell characteristics. The one that has more similarities is considered to be the child cell. Figure 9 shows the results obtained with our model for tracking specific individual cells.
5 CONCLUSION AND FUTURE WORK
This study allows the tracking of cells flowing through a PDMS microchannel with a microstenosis, using a keyhole model.
The model proved to be a promising technique for cell tracking, since that for all the studied regions it was found their child cell. Additionally, our results showed that the calculation of the direction of opti-cal flow was the most suitable strategy to find the best position by using the keyhole model.
Although the studied model has showed promis-ing results, is not a feasible model to conduct a study in real-time, since the calculation of optical flow is slow.
As future work, we intend to create a model with characteristics similar to the model studied, but that allows the cell tracking in real time, in order to have a faster and better idea of the cell movement along the microchannel. Additionally, in the near future we intend to determine the cells deformability when they pass through the microchannel constriction.
Figure 9: Results obtained for the cells tracking; i represents the number of the image; the numbers 1 to 6 represent the
stud-ied cells; the centroids of the cells are marked with a red +.
ACKNOWLEDGEMENTS
The authors acknowledge the financial support pro-vided by 2007 Global COE Program “Global Nano-Biomedical Engineering Education and Research Network”, Japan and grant-in-Aid for Science and
Technology PTDC/SAU-BEB/108728/2008, PTDC/SAU-BEB/105650/2008, PTDC/EME-MFE/
099109/2008 and PTDC/SAU-ENB/116929/2010 from FCT (Science and Technology Foundation), COMPETE, QREN and European Union (FEDER).
i=1
i=21
i=41
6 REFERENCES
Abkarian M, Faivre M, Horton R, Smistrup K, Best-Popescu C. A, Stone H. A (2008), Cellular-scale hydrodynamics. Bio-med Mater 3(3), 034011.
Brox, T., Bruhn, A., Papenberg, N., Weickert, J., 2004, High accuracy optical flow estimation based on a theory for warping, T. Pajdla and J. Matas (Eds.), European Confer-ence on Computer Vision (ECCV), Springer, LNCS, Vol. 3024, 25-36.
Dobbe, J.G.G., Hardeman, M.R., Streekstra, G.J., Strackee, J., Ince, C., Grimbergen, C.A., 2002. Analyzing red blood cell-deformability distributions. Blood Cells, Mol. Dis. 28, 373-384.
Fujiwara, H., Ishikawa, T. Lima, R., Matsuki, N., Imai, Y., Kaji, H., Nishizawa, M., Yamaguchi, T., 2009. Red blood cell motions in a high hematocrit blood flowing through a stenosed micro-channel. J. Biomech. 42, 838-843.
Gueguen, M., Bidet, J.M., Durand, F., Driss, F., Joffre, A., Genetet, B., 1984. Filtration pressure and red blood cell de-formability: evaluation of a new device: erythrometre. Bio-rheology Suppl. 1, 261-265.
Leble V, Lima R, Dias R, Fernandes C, Ishikawa T, Imai Y, Yamaguchi T (2011) Asymmetry of red blood cell motions in a microchannel with a diverging and converging bifurca-tion. Biomicrofluidics 5:044120
Lima R, Oliveira, MSN, Ishikawa T, Kaji H, Tanaka S, Nishi-zawa M, Yamaguchi T. (2009) Axisymmetric PDMS mi-crochannels for in vitro haemodynamics studies. Biofabri-cation 1, 3: 035005.
Mokken, F.Ch., Kedaria, M., Henny, Ch.P., Hardeman. M.R., Gelb, A.W., 1992. The clinical importance of erythtrocyte deformability, a hemorrheological parameter, Ann. Hema-tol. 64, 113-122.
Shin, S., Ku, Y., Park, M.S., Suh, J.S., 2004. Measurement of red cell deformability and whole blood viscosity using la-ser-diffraction slit rheometer. Korea-Australia Rheol. Jour-nal 16:85-90.