Printed version ISSN 0001-3765 / Online version ISSN 1678-2690 http://dx.doi.org/10.1590/0001-3765201720160320
www.scielo.br/aabc
Effect of phosphorus on arsenic uptake and metabolism in rice
cultivars differing in phosphorus use efficiency and response
JÚLIA G. FARIAS1,2,
KATIELIBERNARDY1,
RAÍSSASCHWALBERT1, BIANCA K. DEL FRARI1, ANDREW MEHARG2, MANUSCAREY2, ANDERSON C.R. MARQUES1, ANTONIO SIGNES-PASTOR2, DARLENESAUSEN1, MÁRCIO R.W.
SCHORR1, MIRIAN S.
TAVARES1 and FERNANDO T.
NICOLOSO1
1
Departamento de Biologia, Centro de Ciências Naturais e Exatas, Universidade Federal de Santa Maria, 97105-900 Santa Maria, RS, Brazil
2
Institute for Global Food Security, Queen’s University Belfast, David Keir Building, Malone Road, Belfast, BT9 5BN, Northern Ireland
Manuscript received on July 14, 2016; accepted for publication on September 27, 2016
ABSTRACT
A hydroponic experiment was carried out to investigate the effect of phosphorus (P) nutrition on arsenic
(As) uptake and translocation within the seedlings of rice cultivars. The experiment occurred in three stages: I 5 days of acclimatization (nutritive solution); II 10 days under P (0.0 and 0.09 mM) and As (0.0 and 100 µM) treatments; III 5 days under recovery. The As exposure had significant effect reducing dry weights of shoots or roots, resulted in elevated concentrations of As in shoot tissues. BR-IRGA 409 showed the highest susceptibility to As in biomass production and root system parameters regardless the P level. This cultivar showed contrasting responses of As translocation to shoot tissue dependent on P levels, with the highest As concentration under low P and lowest under normal P levels. P nutrition was most striking on plants recovery for all cultivars under As exposure. Clearer separation of cultivars for phosphorus use
efficiency (PUE) occurred at lower shoot P contents, that was, at higher levels of P deficiency stress. IRGA
424 showed higher PUE as compared to the others cultivars. Our results go some way to understanding the
role of P nutrition in controlling the effects of As in rice shoots.
Key words: mineral nutrition, Oryza sativa, phosphate, Arsenic uptake.
Correspondence to: Júlia Gomes Farias E-mail: [email protected]
INTRODUCTION
Arsenic (As) is a toxic and carcinogenic element that occurs widely in soil environments around the world. Soil contamination with As occurs through natural and anthropogenic pathways (Meharg and MacNair 1992, Meharg and Rahman 2003). Arsenic
is known to have many toxic effects in humans and is ranked first, in the priority list of hazardous
substances compiled by the US Environmental Protection Agency (USEPA) (ATSDR, 2011).
regarding As concentration in Brazilian rice,
considering the different field managements that
occurs in the country and rice cultivars.
Phosphorus (P) is a critical element required for optimum plant growth, and is essential for sustainable production of food across the globe. As such, agricultural production consumes 90% of non- renewable rock phosphate reserves mined each year to supply P to crops and pastures (Cordell et al. 2009). As the world’s population increases and high-grade rock phosphate resources decline,
there is a growing need to improve the efficiency
of P use (PUE) at the plant and whole farm scale (Simpson et al. 2011).
Moreover, to mitigate As stress, plants may modulate pathways to maintain a minimal cellular concentration (Bleeker et al. 2006); the adaptive capacity of each genotype, including mineral nutrition and As translocation and remobilization may be the key to cope As stress. Thus PUE has become topical in recent times, showing potential for a better management in agricultural systems, and in this study we aimed evaluated its relationship with As tolerance.
MATERIALS AND METHODS
PLANT MATERIALS AND GROWTH CONDITIONS
Rice seeds of the indica variety were obtained from IRGA (Instituto Rio Grandense do Arroz), Rio Grande do Sul, Brazil. The seeds of three rice cultivars used in Southern Brazil, BR/IRGA 409, IRGA 423 and IRGA 424, were used in this study. The seeds were soaked in distilled water at 25 °C in the dark for 24 hours. The pre-germinated seeds
were transferred to plastic pots lined with filter
paper placed in partially enclosed growth chambers; these pots were then irrigated with distilled water for ten days.
HYDROPONIC EXPERIMENT
After ten days in distilled water, the seedlings were transferred to plastic pots containing 8 L of
nutrient solution containing the macronutrients 0.18 mM (NH4)2SO4, 0.27 mM MgSO4.7H2O, 0.09 mM KNO3, 0.18 mM Ca(NO3)2.4H2O, and 0.09 mM P2O5 and the micronutrients 20 μM NaEDTA-Fe.3H2O, 6.7 μM MnCl2.4H2O, 9.4 μM H3BO3, 0.015 μM (NH4)6Mo7O24.4H2O, 0.15 μM ZnSO4.7H2O, and 0.16 μM CuSO4.5H2O. The pH was adjusted to 5.5, and the solution was renewed every two days in a controlled environment.
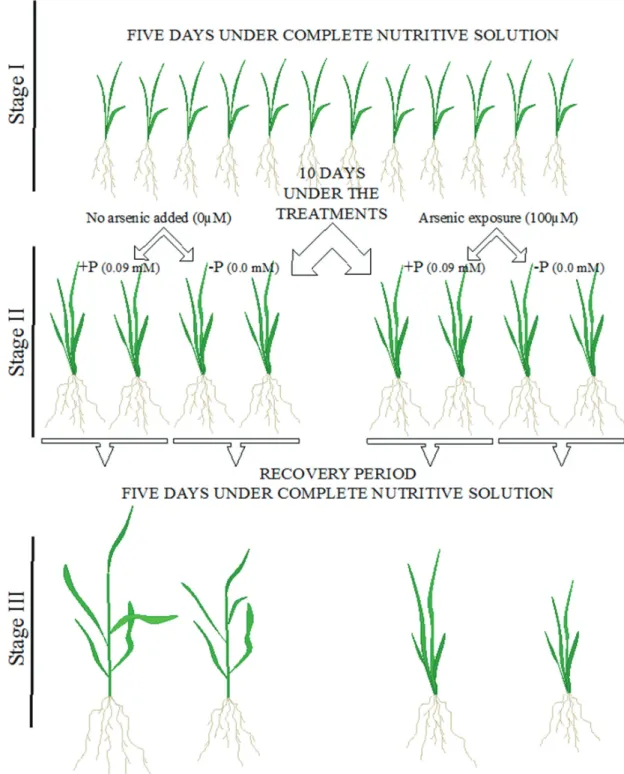
The solution culture experiment was carried out in three stages (Figure 1). At stage I, all seedlings were grown in full nutrient solution (+ P) and without As (-As) during 5 days. At stage II, half of the seedlings were rinsed three times with deionized water and transferred to pots containing nutrient solution without phosphorus (–P), and the remaining seedlings were grown in +P solution. Then, half of each group seedlings had As added in the nutrient solution as Na
3 AsO 4 ·12 H 2
O (+As) under the concentration of 100 µM. This stage lasted 10 days. Stage III, half of +P and –P seedlings with and without As exposure were collected (25 plants per replicate, each treatment consisted of 4 replicates) randomly harvested and separated into shoots and roots. Thus, the remain plants were rinsed three times with deionized water and transferred to pots containing complete nutrient solution (+P) and without As (-As) This stage lasted 5 days. All remain plants were collected (25 plants per replicate, each treatment consisted of 4 replicates) and separated into shoots (Figure 1).
TISSUE ELEMENTS ANALYSIS
2 rice CRM (NIST 1568b Rice flour) that has the
arsenic species Asi and dimethylyarsonic acid
(DMA) concentrations certified. Samples where
then microwave digested in an CEM MARS 6 instrument for 30 min. at 95 oC using a 3 stage slow heating program: to 55 oC in 5 min. held for
10 min., to 75 oC in 5 min., held for 10 min. to 95 oC in 5 min., held for 30 minutes). The digestate, on cooling, was accurately diluted to 10 ml with deionized distilled water and centrifuged at 3,500 rpm for 15 min.
A 1 ml aliquot was transferred to a 2 ml polypropylene vial and 10 µl of analytical grade hydrogen peroxide was added to convert any arsenite to arsenate to facilitate subsequent chromatographic detection. For multi-element analysis by ICP-MS, a more aggressive digestion procedure (heat to 95 oC in 5 min. hold for 10 min. to 135 oC then hold for 10 min., to 180 oC then hold for 30 min.) was employed, with 2 ml of concentrated Aristar nitric acid and left to soak overnight before microwaving. After microwaving, 2 ml of hydrogen peroxide was added. Blanks
and CRM NIST 1568b, which is certified for both
arsenic speciation (Asi and DMA) and for a range of trace and macro elements, were included in each batch of 48 samples analyzed.
Phosphorus quantification- Oven-dried samples were ground and digested with 4 ml of concentrated HNO3. Sample decomposition was
performed using a heating block Velp Scientifica
(Milano, Italy) at 130 °C for 2 h. Plastic caps were
fitted to the vessels to prevent losses by volatiliza -tion. The concentration was determined by induc-tively coupled plasma optical emission spectrom-etry (ICP-OES) using a PerkinElmer Optima 4300 DV (SHELTON, USA) equipped with a cyclonic spray chamber and a concentric nebulizer.
DATA ANALYSIS
After the period of exposure, the roots were digitized with the aid of a scanner Epson 11000 XL and analysis was performed with the aid of WinRhizo
Pro Software, which uses the first method proposed
by Tennant (1975), for determining the total root length and root tips.
Element concentrations in, roots and shoots were calculated on the basis of dry weight. Total
P uptake (TP ); phosphorus use efficiency (PUE), according to Wissuwa et al. (2015); roots and shoots were calculated as follows:
TP = TRoot-P + TShoot-P
TRoot-P = CRoot-P Roots biomass
TShoot-P = CShoot-P Shoots biomass
PUE = (T Shoot-P /Shoot biomass) (Wissuwa et al. 2015).
RESULTS AND DISCUSSION
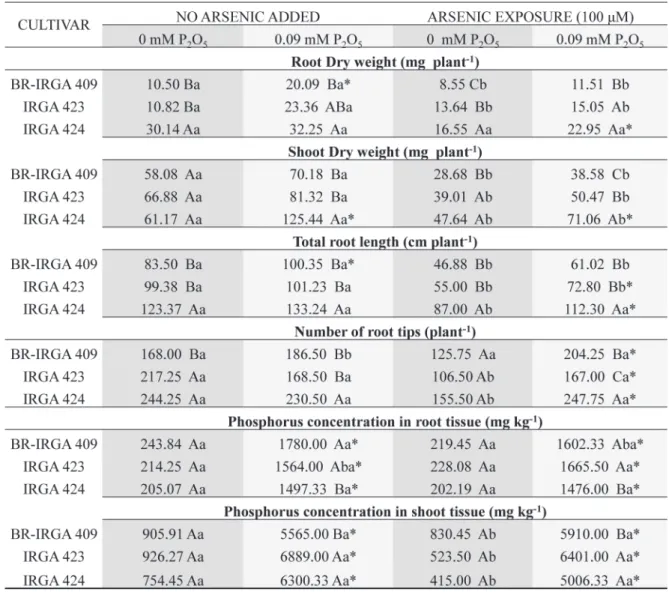
The present study demonstrated that exposure to higher levels of As led to a decrease in biomass production for both shoot and root tissues of rice plants during the vegetative development stage, as was previously reported by others authors (Geng et al. 2009, Bhattacharya et al. 2010) (Figure 2).
Overall, regardless the P level or As exposure, the cultivar IRGA 424 had higher values of root and shoot dry weight as well as total root length and number of root tips as compared to BR-IRGA 409; while IRGA 423 seems to be in an intermediate condition between the other two cultivars (Figure 2, Figure 3).
The maintenance of substantial root system as well as leaf production may be the key to cope
different stress situations, i.e. nutritional stress or
exposure to non essential toxic elements. In the case of nutritional stress, as the lack of an essential
element, the plant metabolism is directly affected; however, the effects and time of appearance of the first symptoms vary among different elements and
plant species (Marschner 1995).
Although P is an essential element to all higher plants, in the present study, when evaluated without As presence, cultivars had distinct response to P
levels. BR-IRGA 409 showed deficient symptoms
in root system in a short period of exposure (10 days), with lower root dry weight and total root length under P starvation, while IRGA 423 and
IRGA 424 were not affected (Figure 2, Figure 3).
presence did not alter BR-IRGA 409 development,
but the presence of P had a positive effect in all
tested parameters (root and shoot dry weight, total root length and number of root tips) for IRGA 424 (Figure 2).
BR-IRGA 409 susceptibility to As was higher than its response to P, once the presence of P wasn’t
enough to mitigate the As effects on plant growth
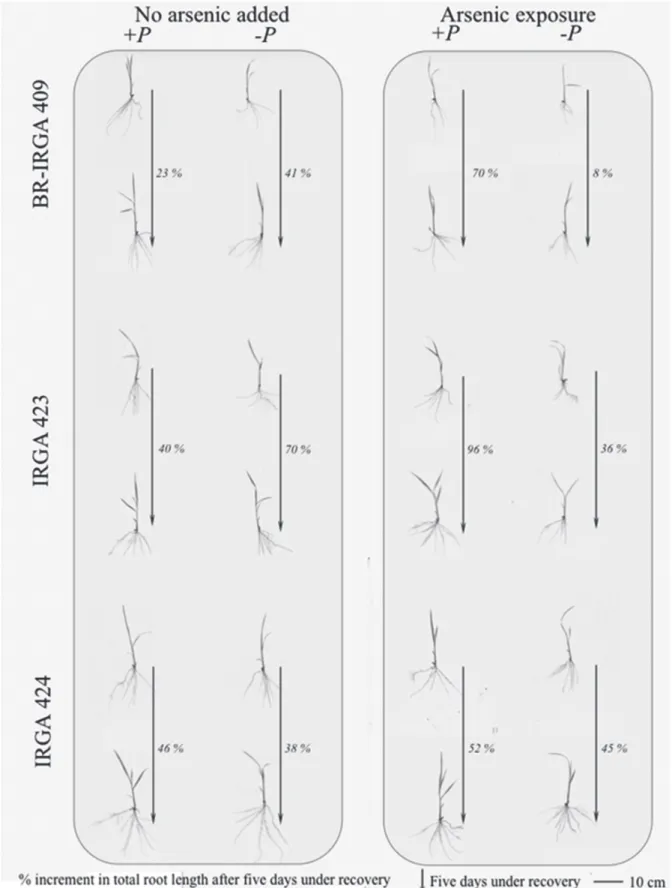
(Figure 2, Figure 3). Interestingly, P nutrition was
most striking on plants recovery for all cultivars under As exposure, but more pronounced in BR-IRGA 409, with only 8% of total root length increment after 5 days under recovery (complete nutritive solution without As presence) in plants with the prior treatment –P and 70% with the prior treatment +P respectively (Figure 3).
The increment on mineral nutrition also
mitigate toxic effects of other elements, through
Figure 2 - Biomass and root system parameters of rice plants of three cultivars exposed to 100 μM arsenic and without arsenic, with phosphorus 0.09 mM and without phosphorus in nutrient solution.
complexation and tissue dilution, once the nutrition results in plant mass increase (Marschner 1995). However, P starvation combined with As exposure resulted in a very drastic biomass reduction, and this stress was almost irreversible for BR-IRGA 409 cultivar under the tested system.
The P requirement for optimal growth is in the range of 0.3-0.5% of plant dry mater during the vegetative stage of growth (Marschner 1995). In our experiment, P starvation was used to manipulate the P nutrition of rice plants grown in solution culture. Phosphorus concentrations in –P
plants were significantly lower than those in +P
plants, and P concentrations in –P plants were at
deficiency levels while +P were at range suggested
for optimal growth (Figure 2). The results of the present study indicated that rice genotypes had
different nutrient partitioning requirements (Figure
2). The results also indicated that the nutrient status and distribution varied with the amount of As added.
Significant differences in nutrient concentra
-tions among different cultivars could be the result of differences in the removal of As from the system
among these genotypes, as well as development of As tolerance and adaptations to other stressful con-ditions (Tu and Ma 2003, Panda et al. 2010, Zheng et al. 2013, Otero et al. 2016).
Due to the diverse functional and structural roles of P in plants, P-use efficiency (PUE) is a complex trait to dissect. P-use efficiency has become topical in recent times for several reasons. There were large price increases during the last decades, and high prices are likely to continue in the future. Coincidentally, the concept of ‘peak P’ has gained some attention in the media, which has drawn attention to the environmental, economic, and social problems that might arise due to limited P reserves (Cordell et al. 2009, Lott et al. 2009). Unlike nitrogen (N), the amount of P available for
use in ag riculture is finite. Steen (1998) estimated
that the depletion of current economically
exploitable reserves would occur sometime in the next 60–130 years.
The tissue P concentrations varied considerably among the genotypes under P supply, with IRGA 424 showing the lowest levels in root tissue and the highest in shoot tissue and the opposite pattern for BR-IRGA 409 (Figure 2). On the other hand, there
was no difference in root and shoot P concentration
among the tested cultivars under P starvation (Figure 6).
Improvements in the efficiency of P nutrition
of crops will come from a variety of potential sources, including changes in fertilizer technology, improvements in exploiting soil biology, and better fertilizer management practices, as well as genetic improvement. The widespread realization that improvements in P nutrition are crucial to the future need to raise global agricultural production has resulted in several recent reviews that have
explored these different opportunities (Hinsinger
2001, McNeill and Penfold 2009, Richardson et al. 2009, Ryan et al. 2009, McLaughlin et al. 2011, Simpson et al. 2011, Rowe et al. 2016).
The marked susceptibility of rice plants to As may be due to a small biomass, which results in high As concentration in plant tissue, leading to toxic
As levels that drastically affect plant development
(Farooq et al. 2016). Thus, BR/IRGA 409 cultivar which had a high susceptibility to As and is well known for its susceptibility to excess levels of Fe (Stein et al. 2009), had the lowest As tissue concentrations in shoots under normal P supply as compared to the other cultivars (Figure 4). On the other hand under P starvation this cultivar had over 35% higher As concentration in shoot tissue as compared to IRGA 423 and 424 (Figure 4).
Arsenite (As(III)) is the dominant As species in
reducing environments such as flooded paddy soils
paddy soils leads to mobilization of arsenite into the soil solution and enhanced As bioavailability to rice plants (Xu et al. 2008).
We also have to consider metabolic transfor-mations of rice inside plant cell once it is absorbed by roots. In this view even though arsenite is the mainly As available form to rice plants under pad-dy system, in grains there is a large range of dif-ferent As species (Meharg et al. 2009, Naito et al. 2015, Carey et al. 2015).
In case of exposure to non-essential toxic elements such as As, plants have both direct and secondary effects on metabolism. Direct affects include, an over production of reactive oxygen species (ROS) that lead to cell damage, lipid peroxidation and other injuries (Tripathi et al. 2012). And second effects are often related to changes in nutrient uptake (Abedin et al. 2002, Meharg and Hartley-Whitaker 2002).
Our results go some way to understanding the
role of P nutrition in controlling the effects of As
in rice shoots. With further work, may form the basis of management practices to alleviate As
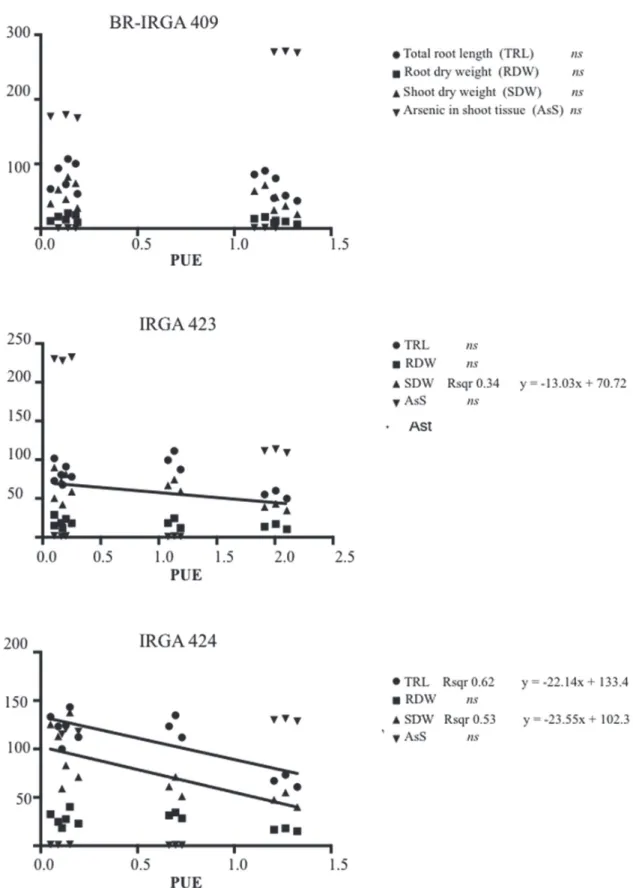
accumulation to toxic levels. Clearer separation of genotypes for PUE occurred at lower shoot P
contents, that was, at higher levels of P deficiency
stress (Figure 5).
Figure 4 - Inorganic arsenic (Asi) concentration in shoot tissues of BR-IRGA 409, IRGA 423 and IRGA 424 cultivars under phosphorus starvation (-P) and normal supply (+P). Means followed by capital letters indicate comparison between cultivars within the same phosphorus and arsenic levels, whereas asterisk indicate comparison between phosphorus levels for the same cultivar and arsenic exposure. Tukey test, α = 0.05.
Figure 5 - Means followed by capital letters indicate comparison between cultivars within the same phosphorus and arsenic levels, whereas lowercase letters indicate comparison of the arsenic exposure for the same cultivars and phosphorus level and asterisk indicate comparison between phosphorus levels for the same cultivar and arsenic exposure. Tukey test, α = 0.05.
Attempts to improve the P efficiency of cropping systems through plant breeding have predominantly focused on enhancing P acquisition from soils (Wissuwa et al. 2009). However, at least conceptually, it is generally agreed that concurrent improvements in vegetative stage PUE should be an important complementary trait to enhanced P uptake in any breeding approach (Wang et al. 2010, Rowe et al. 2016).
availability absorption is limited by P diffusion to
the root surface therefore, so even a low nutrient absorption capacity is adequate to absorb those nutrients that reaches the root (Aerts and Chapin 2000).
The results in our work may indicate that there
are important morphologic differences in roots that directly affect shoot production among the three
rice cultivars. It is therefore possible to control As impact in rice through the selection of rice genotypes with higher PUE, although this doesn’t necessary is related to As uptake and accumulation (Figure 6).
When comes to PUE evaluation there are
many discrepancies in the terminology, definitions
and calculations (Siddiqi and Glass 1981, Ozturk et al. 2005, Wissuwa et al. 2015). Siddiqi and Glass (1981) use total plant biomass, Wissuwa et al. (2015) focused on shoot biomass and agronomic PUE refers to the increase in yield of a variety following the addition of P fertilizer. Assessed
as the difference in yield between fertilized and unfertilized treatments, divided by the difference
in nutrient supplied in each of the treatments (Hammond et al. 2008), agronomic PUE is a measurement of the level of responsiveness to P.
High PUE cultivar IRGA 424 showed the highest tolerance to As exposure under the tested system, with an interestingly potential for further studies. Thus, for this cultivar PUE was related with total root length and shoot dry weight (Figure 6), and this cultivar would still have the highest PUE even with we considered total biomass (Siddiqi and Glass 1981), however this cultivar hasn’t showed high responsiveness to P increment (Figure 2,4, Figure 3, 6).
CONCLUSIONS
The As exposure had significant effects on reducing
dry weights of shoots and roots, thus resulted in elevated concentrations of As in shoot tissues. The
As effect was cultivar-dependent, and BR-IRGA
409 showed the highest susceptibility to As in biomass production and root system parameters regardless of the P level. The response to P levels was also distinct among the cultivars as well as phosphorus use efficiency (PUE). Under P starvation and P starvation combined with As exposure, overall, PUE increased, being higher for IRGA 424 cultivars. This cultivar was the only one with significant correlation for both shoot dry weight and total root length with PUE; while BR-IRGA 409 had no correlation and IRGA 423 only had for shoot dry weight. Even though there was no evidence of relation between PUE and As translocation in early stage in rice plants, however it was related to As tolerance. Thus, our results go some way to understanding the role of P nutrition
in controlling the effects of As in rice growth.
ACKNOWLEDGMENTS
We thank to government funding Coordenação de Aperfeiçoamento de Pessoal de Nível Superior (CAPES) and Conselho Nacional de
Desenvolvimento Científico e Tecnológico (CNPq) for financial support.
REFERENCES
ABEDIN MJ, FELDMANN J AND MEHARG AA. 2002. Uptake kinetics of arsenic species in rice plants. Plant Physiol 128: 1120-1128.
AERTS R AND CHAPIN III FS. 2000. The mineral nutrition of wild plants revisited: A re-evaluation of processes and patterns. Advances in Ecological Research 30: 1-67. AGENCY FOR TOXIC SUBSTANCES AND DISEASE
REGISTRY (ATSDR). 2011. Toxicological Profile for Arsenic. Georgia: ATSDR, 2011, 500 p.
BHATTACHARYA P, SAMAL AC AND MAJUMDAR J. Arsenic contamination in rice, wheat, pulses, and vegetables: a study in an arsenic affected area of West Bengal, India. 2010. Water Air Soil Pollut: 213: 3-13. BLEEKER PM, HAKVOORT HW, BLIEK M, SOUER E
CAREY, M. JIUJIN X, FARIAS JG AND MEHARG AA. 2015. Rethinking rice preparation for highly efficient removal of inorganic arsenic using percolating cooking water. PLOS ONE 10: 1-12.
CHAPIN FS, FOLLETT JM AND O’CONNOR KF. 1982. Growth, phosphate absorption, and phosphorus chemical fractions in two Chionochloa Species. J Ecology 70: 305-321.
CHAPIN FS, GROVES RH AND EVANS LT. 1989. Physiological determinants of growth rate in response to phosphorus supply in wild and cultivated Hordeum species. Oecologia 79: 96-105.
CORDELL D, DRANGERT J AND WHITE S. 2009. The story of phosphorus: Global food security and food for thought. Global Environ Change 19: 292-305.
FAROOQ MA, ISLAM F, ALI B, NAJEEB U, MAO B, GILL RA, YAN G, SIDDIQUE KHM AND ZHOU W. 2016. Arsenic toxicity in plants: Cellular and molecular mechanisms of its transport and metabolism. Environ Exp Bot 132: 42-52.
GENG W, KOMINE R, OHTA T, NAKAJIMA T, TAKANASHI H AND OHKI A. 2009. Arsenic speciation in marine product samples: comparison of extraction-HPLC method and digestion-cryogenic trap method. Talanta 79: 369-375. HAMMOND JP, BROADLEY MR, WHITE PJ, KING GJ, BOWEN HC, HAYDEN R, MEACHAM MC, MEAD A, OVERS T, SPRACKLEN WP ET AL. 2008. Shoot yield drives phosphorus use efficiency in Brassica oleraceae and correlates with root architecture traits. J Exp Bot 60: 1953-1968.
HINSINGER P. 2001. Bioavailability of soil inorganic P in the rhizosphere as affected by root-induced chemical changes: a review. Plant Soil 237: 173-195.
INSKEEP WP, MCDERMOTT TR AND FENDORF S. 2002. Arsenic (V)/(III) cycling in soils and natural waters: chemical and microbiological processes. In: Frankenberger JWT (Ed.), Environmental chemistry of arsenic. New York, NY, USA: Marcel Dekker, p. 183-215.
LIANG F, LI Y, ZHANG G, TAN M, LIN J, LIU W, LI Y AND LU W. 2010. Total and speciated arsenic levels in rice from China. Food Addit Contam 27: 810-816.
LOTT JNA, BOJARSKI M, KOLASA J, BATTEN GD AND CAMPBELL LC. 2009. A review of the phosphorus content of dry cereal and legume crops of the world. IJARGE8: 351-370.
MARSCHNER H. 1995. Mineral Nutrition in higher plants. 2nd ed, San Diego: Academic Press, p. 889.
MARIN AR, MASSCHELEYN PH AND PATRICK JR WH. 1993. Soil redox-pH stability of arsenic species and its in-fluence on arsenic uptake by rice. Plant Soil 152: 245-253. MCLAUGHLIN MJ, MCBEATH TM, SMERNIK R,
STACEY SP, AJIBOYE B AND GUPPY C. 2011. The chemical nature of P accumulation in agricultural soils
– implications for fertiliser management and design: an Australian perspective. Plant Soil 349: 69-87.
MCNEILL AM AND PENFOLD CM. 2009. Agronomic management options for phosphorus in Australian dryland organic and low-input cropping systems. Crop Pasture Sci 60: 163-182.
MEHARG AA AND HARTLEY-WHITAKER J. 2002. Arsenic uptake and metabolism in arsenic resistant and nonresistant plant species. New Phytologist 154: 29-43. MEHARG AA AND MACNAIR MR. 1992. Suppression of
the high-affinity phosphate uptake system: a mechanism of arsenate tolerance in Holcus lanatus L. J Exp Bot 43: 519-524.
MEHARG AA AND RAHMAN M. 2003. Arsenic contamination of Bangladesh paddy field soils: implications for rice contribution to As consumption. Environ Sci Technol 37: 229-234.
MEHARG AA, WILLIAMS PM, ADOMAKO E, LAWGALI YY, DEACON C, VILLADA A, CAMBELL RCJ, SUN G, ZHU YG, FELDMANN J ET AL. 2009. Geographical variation in total and inorganic arsenic content of polished (white) rice. Environ Sci Technol 43: 1612-1617.
MONDAL D AND POLYA DA. 2008. Rice is a major expo-sure route for arsenic in Chakdaha Block, Nadia district, West Bengal, India: A probabilistic risk assessment. Appl Geochem 23: 2987-2998.
NAITO S, MATSUMOTOB E, SHINDOHA K AND NISHIMURAB T. 2015. Effects of polishing, cooking, and storing on total arsenic and arsenic species concentrations in rice cultivated in Japan. Food Chem 168: 294-301. OTERO XL, TIERRA W, ATIAGA O, GUANOLUISA D,
NUNES LM, FERREIRA TO AND RUALES J. 2016. Arsenic in rice agrosystems (water, soil and rice plants) in Guayas and Los Ríos provinces, Ecuador. Sci Total Environ 573: 778-787.
OZTURK L, EKER S, TORUN B AND CAKMAK I. 2005. Variation in phosphorus efficiency among 73 bread and durum wheat genotypes grown in a phosphorus-deficient calcareous soil. Plant Soil 269: 69-80.
PANDA SK, UPADHYAY RK AND NATH S. 2010. Arsenic Stress in Plants. J Agron Crop Sci 196: 161-174.
RICHARDSON AE, HOCKING PJ, SIMPSON RJ AND GEORGE TS. 2009. Plant mechanisms to optimise access to soil phosphorus. Crop Pasture Sci 60: 124-143. ROWE H, WITHERS PJA, BASS P, CHAN NI, DOODY
D, HOLIMAN J, JACOBS B, LI H, MACDONALD GK, MCDOWELL R ET AL. 2016. Integrating legacy soil phosphorus into sustainable nutrient management strategies for future food, bioenergy and water security. Nutr Cycl Agroecosys 104: 393-412.
SIDDIQI MY AND GLASS ADM. 1981. Utilization index: A modified approach to the estimations and comparison of nutrient utilization efficiency in plants. J Plant Nutr 4: 289-302.
SIMPSON RJ, OBERSON A, CULVENOR R, RYAN M, VENEKLAAS E, LAMBERS H, LYNCH J, RYAN P, DELHAIZE E, SMITH F ET AL. 2011. Strategies and agronomic interventions to improve the phosphorus-use efficiency of farming systems. Plant Soil 349: 89-120. STEEN I. 1998. Phosphorus availability in the 21st Century:
Management of a non-renewable resource. Phosphorus and Potassium 217: 25-31.
STEIN RJ, DUARTE GL, SPOHR MG, LOPES SIG AND FETT JP. 2009. Distinct physiological responses of two rice cultivars subjected to iron toxicity under field conditions. Ann Appl Biol 154: 269-277.
TAKAHASHI Y, MINAMIKAWA R, HATTORI KH, KURISHIMA K, KIHOU N AND YUITA K. 2004. Arsenic behavior in paddy fields during the cycle of flooded and non-flooded periods. Environ Sci Technol 38: 1038-1044. TENNANT D. 1975. A test of a modified line intersect method
of estimating root length. J Ecol 63: 995-1001.
TRIPATHI RD, TRIPATHI P, DWIVEDI S, DUBEY S, CHATTERJEE S, CHAKRABARTY D AND TRIVEDI
PK. 2012. Arsenomics: omics of arsenic metabolism in plants. Front Physiol 3: 1-14.
TU C AND MA LQ. 2003. Effects of arsenate and phosphate on their accumulation by an arsenic-hyperaccumulator Pteris vittata L. Plant Soil 249: 373-382.
WANG X, SHEN J AND LIAO H. 2010. Acquisition or utilization, which is more critical for enhancing phosphorus efficiency in modern crops? Plant Sci 179: 302-306. WISSUWA M, KONDO K, FUKUDA T, MORI A, ROSE
MT, TANAKA JP, KRETZSCHMAR T, HAEFELE SM AND ROSE TJ. 2015. Unmasking novel loci for internal phosphorus utilization efficiency in rice germplasm through Genome-Wide Association Analysis. PLOS ONE 10: 1-21.
WISSUWA M, MAZZOLA M AND PICARD C. 2009. Novel approaches in plant breeding for rhizosphere-related traits. Plant Soil 321: 409-430.
XU XY, MCGRATH SP, MEHARG AA AND ZHAO FJ. 2008. Growing rice aerobically markedly decreases As accumulation. Environ Sci Technol 42: 5574-5579. ZHENG W, SCIFLEET J, YU X, JIANG T AND ZHANG R.