1349
Vol.52, n. 6: pp.1349-1356, November-December 2009
ISSN 1516-8913 Printed in Brazil BRAZILIAN ARCHIVES OF
BIOLOGY AND TECHNOLOGY
A N I N T E R N A T I O N A L J O U R N A L
Statistical Optimization of Culture Conditions by Response
Surface Methodology for Synthesis of Lipase with
Enterobacter aerogenes
Annapurna Kumari, Paramita Mahapatra and Rintu Banerjee*
Microbial Biotechnology and Downstream Processing Laboratory; Agricultural and Food Engineering Department; Indian Institute of Technology, Kharagpur; West Bengal, 721302 - India
ABSTRACT
Optimization of lipase production by Enterobacter aerogenes was carried out using response surface methodology (RSM) where the statistical model was obtained by fractional factorial central composite design. The influence of various physico-chemical parameters, viz. temperature, oil concentration, inoculum volume, pH and incubation period on lipase production was examined. Optimization of physico-chemical parameters resulted 1.4- fold increase in lipase activity. The optimum levels of parameters were 34°C, oil concentration 3%, inoculum volume 7%, pH 7 and incubation time 60 h for obtaining a maximum lipase activity of 27.25 U/ml.
Key words: Central composite design, Enterobacter aerogenes, Lipase, optimization, parameter, Response Surface Methodology
* Author for correspondence: [email protected]
INTRODUCTION
Lipases or triacylglycerol acyl ester hydrolases are the special class of esterase enzymes that catalyze both the hydrolysis and the synthesis of esters formed from glycerol and long - chain fatty acids. Multi-faceted microbial lipases have emerged as key enzymes in swiftly growing biotechnology. In addition to their biological significance, lipases have tremendous application in areas such as food, dairy, pharmaceutical, detergent, textile, cosmetic industries and biomedical sciences.
Lipases are ubiquitous in nature and are produced by various plants, animals and microorganisms especially bacteria and fungus. Although pancreatic lipases have been traditionally used for various purposes, it is now well established that lipases produced from microorganism specifically bacterial lipases are preferred for commercial
applications due to their thermostability, multifold properties, easy extraction procedures, and unlimited supply (
Gupta et al
., 2004). Due to the growing importance of lipases within biotechnological perspectives, extensive research is being carried out throughout the world to exploit hyperactive strains for lipase production and to optimize the various parameters for maximizing its production. Several bacterial strains have been studied for their lipase producing ability, while there are few reports on the production and optimization of lipases from Enterobacter aerogenes.temperature, pH, incubation time, oil concentration, inoculum volume, had inducing effect on lipase production by Enterobacter aerogenes when individually supplemented in the fermentation medium. Traditional approach to optimization of biological systems based on One Factor At a Time, commonly abbreviated OFAT, is not as scientific as is Response Surface Methodology (RSM). It is less efficient than a factorial screening design and can provide incorrect conclusions in case of strong interactions among the factors. Hence, in the present study, optimum conditions for lipase production were determined using RSM.
RSM is a compilation of statistical and mathematical techniques widely used to determine the effects of several parameters and to optimize various biotechnological processes (Burkert et al., 2004; Kalil et al., 2000; Vohra and Satyanarayana, 2002; Rao et al., 2000; Puri et al., 2002).This technique gives contours plots from linear, interaction and quadratic effects of two or more parameters and fits the experimental data to calculate the optimal response of the system. This technique has been extensively used to investigate the optimization of physiochemical parameters and factors of several fermentation media with various microorganisms (Chang et al., 2002). There are several reports on optimization of lipase production by RSM (Elibol and Ozer, 2002; Muralidhar et al., 2001).In the present study; RSM was adopted to optimize the fermentation conditions for lipase production from Enterobacter aerogenes.
MATERIALS AND METHODS
Organism
A bacterium Enterobacter aerogenes
(
Enterobacter aerogenes
IABR-0785
) wasisolated from the soil of IIT Kharagpur. It was grown at 30°C for 24 h and then stored at 4°C, and was maintained on nutrient broth agar slants.
Chemical
Chemicals were purchased from Merck.
Media
For the preparation of inoculum, E. aerogenes was cultivated in medium containing potassium dihydrogen phosphate (0.1%), sodium nitrate
(0.1%), magnesium sulphate (0.05%)
supplemented with coconut oil (2%).
Culture Conditions
Lipase production was carried out in 250 ml Erlenmeyer flasks each containing 50 ml medium composed of peptone (0.5%) and yeast extract (0.3%) as nitrogen source, coconut oil as sole carbon source (4%),NaCl (0.25%) and MgSO4
(0.05%) with an initial pH value of 8. The production broth (50 ml) was inoculated with inoculum (4.0 x10⁸ cells/ml) and incubated for 48 h in a shaker at 200 rpm at 30°C, and these conditions were set as the central point for experimental design.
Enzyme assay
Lipase assay was done spectrophotometrically using p-nitrophenyl palmitate (procured from Sigma) as the substrate. The assay mixture contained 1ml of 16.5 mM solution of p -nitrophenyl palmitate in 2-propanol along with Tris-HCl buffer, pH 8 (supplemented with 0.1% arabic gum and 0.4% Triton X-100) in a ratio of 1:9. The enzyme solution (0.025 ml) was added to it and incubated in water bath at 37°C for 10 min.
p-nitrophenol was liberated from p-nitrophenyl palmitate by lipase mediated hydrolysis imparting a yellow color to the reaction mixture. After incubation, 2 ml of dist. water was added and the absorbance was measured at 410 nm (Kordel et al., 1991). Absorbance of control was also recorded. One unit (U) of lipase activity was defined as the amount of enzyme that liberates one micromole of
p-nitrophenol, per min under the assay conditions.
Optimization of five parameters by RSM
Statistical Optimization of Culture Condition by Response Suface Methodology 1351
procedure. The model equation for
analysis is
given below:
Y= β0+β1A+β2B+ β3C+ β4D+ β5E + β12AB+
β13AC+ β14AD+ β15AE+ β23BC+ β24BD+ β25BE+
β34CD+ β35CE+ β45DE+ β11A
2
+ β22B 2
+ β33C 2
+
β44D
2
+ β55E 2
Where A, B, … , E are the levels of the factors and
β1, β2, …, β5 are linear coefficients, β11, β22, … β55
are quadratic coefficients and β12, β13, … , β45 are
interactive coefficient estimates while β0 have a
role of a scaling constant. Analysis of variance (ANOVA), regression analysis were done and contour plots were drawn by using Design expert software.
Table 1 - Control, maximum and minimum values of the parameters chosen for experimental levels.
RESULTS AND DISCUSSION
Fitting of the model
A regression analysis (Table 2) was carried out to fit the mathematical model to the experimental data in order to get an optimal region for the response studied. The predicted model can be described by the following second-order polynomial equation.
Y = 19.67+1.06A-1.11B+0.038C+0.11 D+2.58E+0.13AB+0.52AC-1.03AD
+1.53AE+2.62BC+0.019BD-
0.17BE+0.93CD+1.44CE-0.14DE-2.46A2 +0.48B2+0.12C2-0.024D2-0.43E2
Regression analysis of the experimental data showed that coefficient for four factors (temperature, inoculum volume, pH and incubation time) were positive while oil concentration had negative coefficient. The negative effect of oil concentration on response implied that higher value of this parameter led to lower lipase production.
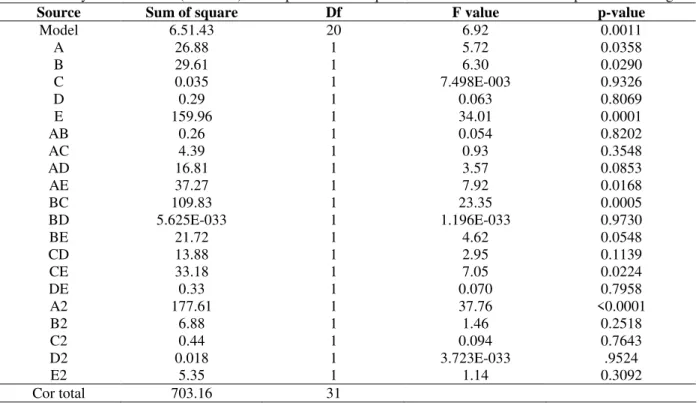
Table 2- Analysis of variance (ANOVA) for response surface quadratic model obtained from experimental designs
Source Sum of square Df F value p-value
Model 6.51.43 20 6.92 0.0011
A 26.88 1 5.72 0.0358
B 29.61 1 6.30 0.0290
C 0.035 1 7.498E-003 0.9326
D 0.29 1 0.063 0.8069
E 159.96 1 34.01 0.0001
AB 0.26 1 0.054 0.8202
AC 4.39 1 0.93 0.3548
AD 16.81 1 3.57 0.0853
AE 37.27 1 7.92 0.0168
BC 109.83 1 23.35 0.0005
BD 5.625E-033 1 1.196E-033 0.9730
BE 21.72 1 4.62 0.0548
CD 13.88 1 2.95 0.1139
CE 33.18 1 7.05 0.0224
DE 0.33 1 0.070 0.7958
A2 177.61 1 37.76 <0.0001
B2 6.88 1 1.46 0.2518
C2 0.44 1 0.094 0.7643
D2 0.018 1 3.723E-033 .9524
E2 5.35 1 1.14 0.3092
Cor total 703.16 31
Independent parameters Level
Symbol -1 0 +1
Temperature (°C ) A 25 30 35
Oil concentration (%) B 3 4 5
Inoculum volume (%) (4.0 x10⁸ cells/ml) C 7 8 9
pH D 7 8 9
Among the four parameters, incubation time had highest impact on lipase production as given by highest linear coefficient (2.58), followed by temperature (1.06), pH (0.11) and inoculum volume (0.038). Gupta et al. (2006) also reported the incubation time as the most significant factor for lipase production.
The significant negative quadratic effects on lipase production indicated that lipase production increased as the level of the parameters (temperature, pH and incubation time) increased, whereas the decrease in the lipase activity could be observed as the level of these parameters was increased above certain values.
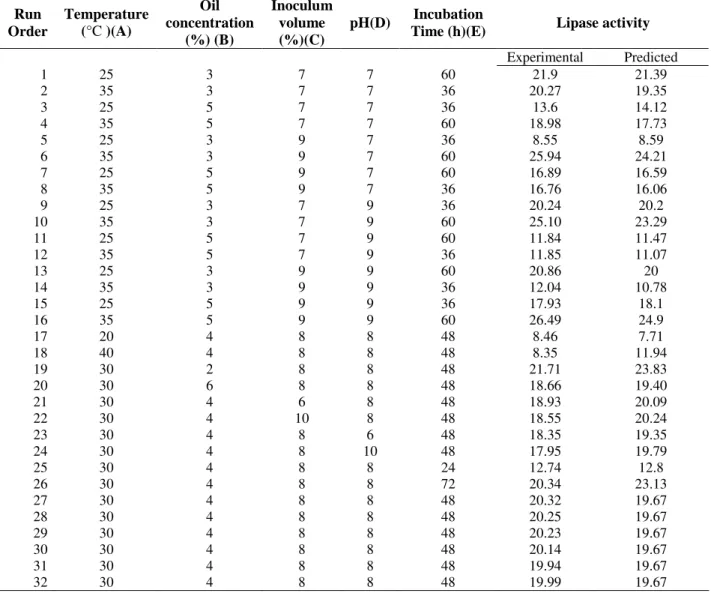
Lipase activity obtained from the designed experiments along with the predicted value is given in Table.3. The analysis of variance for the lipase production obtained from this design is
given in Table.2. ANOVA confirmed the adequacy of the quadratic model and explained, whether this model satisfactorily fitted the variation observed in lipase production with the designed level of physico-chemical parameters. As the F-test for the model was significant at the 5% level (P < 0.05), this model was considered fit and could effectively explain the variation observed. It was seen that parameters with significant model terms were the linear terms of temperature (A), oil concentration (B), incubation time (E) and quadratic term of temperature (A2), followed by the interaction effects of temperature and incubation time (AE), oil concentration and inoculum volume (BC), inoculum volume and incubation time (CE). The result suggested that temperature, oil concentration and incubation time had very significant effect on lipase activity.
Table 3 - Central composite design matrix for the experimental design and predicted lipase activity
Run Order
Temperature (°C )(A)
Oil concentration
(%) (B)
Inoculum volume (%)(C)
pH(D) Incubation
Time (h)(E) Lipase activity
Experimental Predicted
1 25 3 7 7 60 21.9 21.39
2 35 3 7 7 36 20.27 19.35
3 25 5 7 7 36 13.6 14.12
4 35 5 7 7 60 18.98 17.73
5 25 3 9 7 36 8.55 8.59
6 35 3 9 7 60 25.94 24.21
7 25 5 9 7 60 16.89 16.59
8 35 5 9 7 36 16.76 16.06
9 25 3 7 9 36 20.24 20.2
10 35 3 7 9 60 25.10 23.29
11 25 5 7 9 60 11.84 11.47
12 35 5 7 9 36 11.85 11.07
13 25 3 9 9 60 20.86 20
14 35 3 9 9 36 12.04 10.78
15 25 5 9 9 36 17.93 18.1
16 35 5 9 9 60 26.49 24.9
17 20 4 8 8 48 8.46 7.71
18 40 4 8 8 48 8.35 11.94
19 30 2 8 8 48 21.71 23.83
20 30 6 8 8 48 18.66 19.40
21 30 4 6 8 48 18.93 20.09
22 30 4 10 8 48 18.55 20.24
23 30 4 8 6 48 18.35 19.35
24 30 4 8 10 48 17.95 19.79
25 30 4 8 8 24 12.74 12.8
26 30 4 8 8 72 20.34 23.13
27 30 4 8 8 48 20.32 19.67
28 30 4 8 8 48 20.25 19.67
29 30 4 8 8 48 20.23 19.67
30 30 4 8 8 48 20.14 19.67
31 30 4 8 8 48 19.94 19.67
Statistical Optimization of Culture Condition by Response Suface Methodology 1353
Although the linear effect of inoculum volume(C) was not significant but two of its interaction effects were significant which suggested that the inoculum volume had considerable effect on lipase activity.
The coefficient of determination (R2) (0.9264) suggested a good fit of the model with the observed values, which was better than R2 value of the 0.81 and 0.91 for lipase production from
Burkholderia sp. C20 and Candida sp. 99-125 (Chien-Hung et al.,2006; Yao-Qiang and Tian-Wei, 2006).Thus, the model could explain up to 92.64% variation of lipase production.
Analysis of response surface
To investigate the effects of above five factors on the lipase activity, three-dimensional plots were drawn. Figs. 1-3 show response surface plots of lipase production for each pair of selected parameters by keeping the other three factors constant at its control level. Response surface plots showed that simultaneous increase in incubation time with temperature above the control levels resulted in increase in lipase activity up to a certain extent within the range but further rise in temperature led to decrease in enzyme activity. This indicated the presence of optimum point within the range (Fig.1). Fig.2 shows the interaction between inoculum volume and oil concentration.
The response surface demonstrated that increasing inoculum volume and oil concentration above the control levels caused decrease in lipase activity.
Hence, for the optimum lipase production, inoculum volume and oil concentration were kept at their lowest concentration (7 and 3% respectively). Fig.3 shows the interaction between incubation time and inoculum volume. The response surface established that increasing the incubation time with simultaneous decrease in inoculum volume from the control levels resulted in increase in lipase activity with maximum lipase activity after 60 h of incubation. Table 3 showed that on further increase in incubation time, i.e, at 72 h, there was no increase in lipase activity. Thus, for E. aerogenes, the optimum incubation time was fixed as 60 h, which was lesser than that of many other lipase producing bacteria such as,
Pseudomonas sp, P. fragi and P. fluorescens BW 96CC which gives maximum lipase activity after 72 and 96 h of incubation (Dong et al.,1999; Pabai et al.,1996). Other interaction model terms were not shown graphically since they were not found significant for lipase activity.
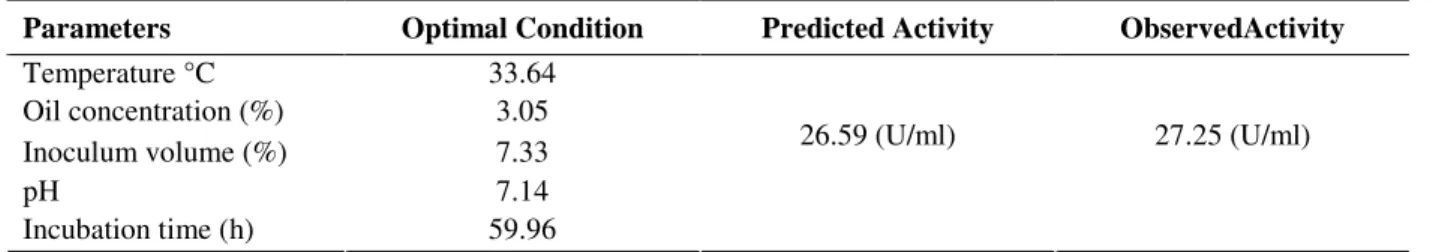
Graphical analysis was combined with the numerical optimization to evaluate the optimum condition for lipase synthesis. After optimization using RSM, 1.4-fold increase in lipase activity was observed with 27.25 U/ml lipase activity. Kaushik et al. (2006) reported approximately 1.8-fold increase in the enzyme activity, resulting in 12.7 U/ml lipase activity. The optimum condition for lipase production was 34°C, oil concentration 3%, inoculum volume 7%, pH 7 and 60 h of incubation.
Figure 2 - Effects of oil concentration and inoculum volume on lipase activity through response surface plot at constant temperature, pH and incubation time.
Figure 3 - Effects of incubation time and inoculum volume on lipase activity through response surface plot at constant temperature, oil concentration and pH.
Model verification experiments
In order to determine the fitness of the model, lipase synthesis experiments were designed using selected optimal condition. The maximum lipase
activity (27.25 U/ml) was obtained experimentally and this was closer to the predicted value 26.59 U/ml (Table 4).
Table 4- Validation of model showing lipase production at optimum level of all parameters
Parameters Optimal Condition Predicted Activity ObservedActivity
Temperature °C 33.64
Oil concentration (%) 3.05 Inoculum volume (%) 7.33
pH 7.14
Incubation time (h) 59.96
Statistical Optimization of Culture Condition by Response Suface Methodology 1355
CONCLUSION
The response surface methodology is an efficient technique for the rapid screening of the significant influencing parameters and development of a polynomial model to optimize fermentation condition for the production of lipase from E. aerogenes. The R2 value of 0.9264 showed a good fit of the model with the experimental data. The model, predicted accurately for maximum lipase production. An overall 1.4-fold increase in lipase activity was achieved after medium optimization, following the statistical approach. The optimum fermentation conditions obtained for the synthesis of lipase from E.aerogenes were 34°C, oil concentration 3%, inoculum volume 7%, pH 7 and incubation time 60 h for obtaining a maximum lipase activity of 27.25 U/ml.
ACKNOWLEDGEMENTS
The authors wish to acknowledge CSIR, Govt. of India and DBT, India for providing research fellowship to Annapurna Kumari and Paramita Mahapatra, respectively.
REFERENCES
Aires-Barros, R., Taipa, M.A. and Cabral, J.M.S. (1994), Isolation and purification of lipases. In-Lipases—their structure, biochemistry and application, eds. P. Wooley and S.B. Petersen. Cambridge University Press, Cambridge, pp 243-270. Brune, K. and Gotz, F. (1992), Degradation of lipids by bacterial lipases. In-Microbial degradation of natural products, ed. G. Winkelman. VCH, Weinhein ,pp 243-266.
Burkert, J.F.M., Maugeri, F. and Rodrigues, M.I. (2004), Optimization of extracellular lipase production by Geotrichum sp. using factorial design. Bioresource Technol., 91, 77-84.
Chang, Y.N., Huang, J-C.and Lee, Ch-Ch. (2002), Use of response surface methodology to optimize culture medium for production of lovastatin by Monascus rubber.Enzyme Microb. Technol., 30,889-894. Chien-Hung, L., Wei-Bin, L. and Jo-Shu, C. (2006),
Optimizing lipase production of Burkholderia sp. by response surface methodology. Process Biochem., 41,1940-1944.
Dong, H., Gao, S., Han, S. and Cao, S. (1999), Purification and characterization of a Pseudomonas sp. lipase and its properties in non-aqueous media. Appl Microbiol Biotechnol., 30,251-256.
Elibol, M. and Ozer, D. (2002), Response surface analysis of lipase production by freely suspended Rhizopus arrhizus. Process Biochem., 38,367-372. Gupta, R., Gupta, N. and Rathi, P. (2004) Bacterial
lipases: an overview of production, purification and biochemical properties. Appl Microbiol. Biotechnol. 64: 763-781.
Gupta, N., Sahai, V. and Gupta, R. (2007), Alkaline lipase from a novel strain Burkholderia multivorans: Statistical medium optimization and production in a bioreactor. Process Biochem., 42, 518-526.
Jaeger, K.E., Ransac, S., Dijkstra, B.W., Colson, C., van Heuvel, M. and Misset, O. (1994), Bacterial Lipases. FEMS Microbiol Rev., 15,29-63.
Kalil, S.J., Mavgeri, F. and Rodrigues, M.I. (2000), Response surface analysis and simulation as a tool for bioprocess design and optimization. Process Biochem., 35, 539-550.
Kaushik, R., Saran, S., Isar, J. and Saxena, R.K. (2006), Statistical optimization of medium components and growth conditions by response surface methodology to enhance lipase production by Aspergillus carneus. J. Mol. Catal. B: Enzym. 40, 121-126.
Kim, S.S., Kim, E.K. and Rhee, J.S. (1996), Effects of growth rate on the production of Pseudomonas fluorescens lipase during the fedbatch cultivation of Escherichia coli. Biotechnol Prog., 12,718-722. Kordel, M., Hofmann, B., Schomburg, D. and Schmid,
R.D. (1991), Ex-tracellular lipase of Pseudomonas sp. strain ATCC-21808, puritication, characterization, crystallization, and preliminary X-ray diffraction data. J Bacteriol., 173, 4836-4841.
Muralidhar, R.V., Chirumanila, R.R., Marchant, R. and Nigam, P. (2001),A response surface approach for the comparison of lipase production by Candida cylindracea using two different carbon sources. Biochem Engg J., 9, 17-23.
Pabai, F., Kermasha, S.and Morin, A. (1996), Use of continuous culture to screen for lipase-producing microorganisms and interesterification of butterfat by lipase isolates. Can J Microbiol., 42,446-452.
Puri, S., Beg, Q.K.and Gupta, R. (2002), Optimization of alkaline protease production from Bacillus sp. by Response surface methodology. Curr Microbiol., 44, 286–290.
Vohra, A. and Satyanarayana, T. (2002), Statistical optimization of the medium components by response surface methodology to enhance phytase production by Pichia anomala. Process Biochem., 37, 999-1004. Yao-Qiang, H.and Tian-Wei, T. (2006),Use of response
surface methodology to optimize culture medium for production of lipase with Candida sp. 99-125. J Molecular Cata B: Enzymatic., 43,9-14.