Engineering
ISSN: 1809-4430 (on-line)
_________________________
2 Universidade Estadual do Sudoeste da Bahia (UESB)/ Itapetinga - BA, Brasil. 3 Universidade Estadual de Santa Cruz (UESC)/ Ilhéus - BA, Brasil.
4 Universidade Federal da Bahia (UFBA)/ Salvador - BA, Brasil.
STARCH EXTRACTION FROM THE PEACH PALM (Bactris gasepaes Kunth.) FRUIT: A MODEL APPROACH FOR YIELD INCREASE
Doi:http://dx.doi.org/10.1590/1809-4430-Eng.Agric.v37n1p148-159/2017
BIANO A. DE MELO NETO1*, RENATA C. F. BONOMO2, MARCELO FRANCO3, PAULO F. DE ALMEIDA4, KAREN V. PONTES4
1*Corresponding author. Instituto Federal Baiano (IFBAIANO)/ Uruçuca - BA, Brasil. E-mail: [email protected]
ABSTRACT: The objective was to study the starch extraction process of the peach palm (Bactris gasipaes Kunth.) fruit focused on increasing yield and in preserving the quality characteristics the
extracted product. Two experimental designs are carried out in order to investigate the effects of NaOH and NaHSO3 concentrations, as well as the decantation time, on the yield of starch and on
product color. Firstly, a 23 full factorial design provided a linear model with 95% of confidence,
indicating major tendencies for optimization. Secondly, a 22 central composite design rendered a
quadratic model which allowed the maximization of yield (it 9.0% higher) without compromising the color of the product. The maximum yield of 23.90%, validated with triplicate experiments, is considerably higher than the yield of starch from other fruits reported in literature.
KEYWORDS: design of experiments, response surface methodology, native starch.
INTRODUCTION
Starch is extracted from the edible part of cereals, tubers, roots, rhizomes and fruits. It is the main source of energy stored in higher plants and provides 70 to 80% of the calories consumed by humans (LEONEL et al., 2003; AGUILERA et al., 2009) as thickener, colloidal stabilizer, gelling agent, glue, adhesive, among others (LEONEL & CEREDA, 2002). Food industries, then, are the greatest consumers of this raw material. This multipurpose polymer is also used in a large number of processes, especially in the cosmetics, pulp and paper, chemical, textile and pharmaceutical industries. A more recent application has been in the development of biomaterials (APLEVICZ & DEMIATE, 2007; ARAUJO-FARRO et al., 2010). Research institutions and industries, therefore, are becoming more interested in identifying native starches with specific characteristics, as well as improving the extraction process towards greater purity and yield (LEONEL, 2007).
The peach palm (Bactris gasipaes Kunth.), native from Costa Rica, has cylindrical trunks
which can reach up to 20 meters tall until adulthood. It is globally recognized by its stem manufacture from the palm heart, and Brazil is considered to be the largest producer (SOUSA et al., 2011). The tree produces fleshy fruits rich in carotene (pro-vitamin A), carbohydrates, oils and starch, hence with great nutritional value and energy. Although these fruits have potential for application in food, they are discarded during the stem production. They are entirely used for obtaining seeds (FARIAS NETO et al., 2013), which are considered a highly polluting waste in major producing regions of the country. Therefore, the extraction of starch from these fruits would increase their added-value also contributing to a more sustainable production of stem from palm heart.
process. In this context, this paper attempts to maximize the yield of starch extracted from the peach palm fruit.
The are several studies on the extraction and characterization of starch in literature, as well as on the relationship between the extraction processes and molecular structure of the final product (LEONEL, 2007; DENARDIN & SILVA, 2009). Studies on the optimization of the extraction process, are still an open issue in literature and is the focus of the present contribution. LIMA et al. (2012) studied three industries of cassava starch with the aim of get viable alternatives for improvement in the production process. They found that optimization of extraction would be of fundamental importance for the development of the sector, however, the authors found no literature on work related to the optimization of starch extraction.
The response surface methodology (RSM) is a collection of mathematical and statistical techniques used for developing, improving and optimizing processes, and can be used to evaluate the relative significance of many factors that are affected by complex interactions. The main objective of RSM is to determine the optimal operating conditions for a system or to determine a region that satisfies the operating specifications (SANTANA et al.; 2007). By put forward better results for optimization than other statistical methods, the RSM was utilized in this work. The independent variables investigated are the concentrations of sodium hydroxide (NaOH) and sodium bisulfite (NaHSO3), in addition to decantation time, according to previous analysis and
contributions of literature (ROCHA et al., 2008; DEVEREUX et al., 2011; MADRIGAL-ALDANA et al., 2011).
So the objective was to study the starch extraction process of the peach palm (Bactris gasipaes Kunth.) fruit focused on increasing yield and in preserving the quality characteristics the
extracted product. Since the color is the main quality parameter of the starch, this response is also investigated through luminosity and chromaticity indices, which are constraints of the optimization problem. In order to accomplish the optimization, two sequential designs of experiments are carried out attempting to validate an empirical model which can satisfactorily describe the extraction process.
MATERIAL AND METHODS
Materials
Plantations owned by the Federal Institute of Baiano Uruçuca Campus and by INACERES S.A. supplied the mature peach palm (Bactris gasipaes Kunth.) fruits Additional materials are:
sodium hydroxide (NaOH) P.A., sodium bisulfite (NaHSO3) P.A. and absolute ethyl alcohol. All
analytical grade reactants are made by the Synt Company.
Methods
Starch extraction
The starch was obtained from the peach palm fruit according to the methodology described by LEONEL et al. (2003) and applied by MELO NETO et al. (2015). The fruits were peeled, shredded and put into plastic containers. A "Croton" type knife mill with a 10 screen mesh grinded the samples in order to separate the mulch from the starch milk which was purified in 100 and 200 mesh sieves. The mulch was then successively washed with running water in order to separate the starch by decanting into plastic containers. The decanted starch was purified with absolute alcohol, filtered and dehydrated at 35°C for 12 hours in a dryer containing silica gel. The obtained starch was then reduced to powder and passed through a 48 mesh sieve in order to obtain the sample for analysis. Attempting to increase the process yield, the mulch from the first extraction was further purified in a 10 mesh sieve.
Extraction yield
(1) Colorimetric analysis
The color was measured by means of direct analysis in a Color Quest XE colorimeter (Hunter Lab). The operating parameters during analysis were: 10° angle, D65 illuminant and a RSIN calibration mode. The color was determined by the international color scale (CIE-International Commission on Illumination) which uses the following coordination: L* represents luminosity (light reflecting ability), ranging from 0 (totally black) to 100 (totally white) - the closer to 100, the more white and clear is the starch; a* represents the color transition from green (-60) to red (+60) - the closer to zero, the less green and/or red pigments mixed with the starch granules; b* represents the color transition from blue (-60) to yellow (+60) - the closer to zero, the less blue and/or yellow pigments exists (LEONEL et al., 2009; YOSHIDA & ANTUNES, 2009). Calorimetric analysis also allows the determination of saturation index and other variables.
Experimental design
First design of experiment: full 23
In order to investigate the effects and significance of the independent variables on both responses, extraction yield and starch color, a 23 full experimental design is carried out. The levels
of the independent variables, summarized in Table 1, were determined based on preliminary tests as discussed above. In order to assess the experimental reproducibility, as well as to provide an extra degree of freedom for the model, three runs at the central point are carried out, as the design matrix in Table 3 illustrates.
TABLE 1. Levels of the independent variables - 23 experimental design.
Variables Level
-1 0 +1
Sodium hydroxide (mol) X1 0,02 0,06 0,10
Sodium bisulfite (%) X2 0,10 0,25 0,40
Time decantation (min) X3 60,0 90,0 120,0
Second design of experiment: 22 central composite design
The first design indicated major tendencies towards optimal yield, as discussed next in Results section. Based on these findings, the levels of independent variables were redefined as Table 2 illustrates, considering the axial level in an attempt to obtain a quadratic model. As in the first design, here three runs at the central point are carried out.
TABLE 2. Levels of the independent variables - 22 central composite design.
Variables Level
-α -1 0 +1 +α
Sodium hydroxide (mol) X1 0,03 0,05 0,10 0,15 0,17
Time decantation (min) X2 77,7 90,0 120,0 150,0 162,3
Data analysis
When carrying out an experimental design, one may obtain a model, according to:
(2) where,
β0 is the mean;
βi is the linear coefficient corresponding to the independent variable I;
βii is the quadratic coefficient corresponding to the independent variable I;
βij is the interaction coefficient between independent variables i and j, and
represents the encoded independent variables.
In order to assess the statistical significance of the proposed model within a confidence level, an analysis of variance (ANOVA) has to be carried out. The data analysis here considered a confidence level of 95%. Only and only if the mathematical model is statistically significant, the response surface methodology (RSM) may be carried out in order to optimize the response. All results were evaluated with the software Statistics for Windows, version 8.0.
RESULTS AND DISCUSSION
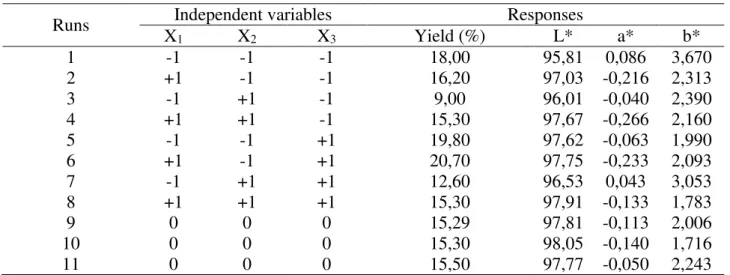
Table 3 presents the design matrix of the first full 23 design as well as both responses, yield
and color. Pareto charts of standardized effects are illustrated in Figure 1 for each investigated response.
TABLE 3.Design matrix - full 23.
When analyzing the yield from Figure 1a, NaHSO3 has the greatest effect. As mentioned
before, it was added to the extraction process in order to avoid darkening of the sample. As NaHSO3 is a salt derived from an acid, a saline hydrolysis reaction may have occurred with the
NaOH, producing water and then reducing the concentration of NaOH. This unexpected reaction might have consumed part of NaOH, diminishing its desired role, i.e., to release the starch granules and then to increase the yield. This finding is corroborated by the significant interaction effect between NaOH x NaHSO3, even higher than the main effect of NaOH. The main effects of NaOH
and DT are positive and significant as expected. The interaction effect NaHSO3 x DT indicates that
a longer DT affords the saline hydrolysis reaction, therefore decreasing the effect of NaOH during the decantation period.
The main role of the NaHSO3 is to whiten the sample so that a significant positive effect on
color was expected. However, as Figure 1b and 1c indicates, it has no significant influence on the color parameters L* and a*. As discussed before regarding Figure 1, NaHSO3 might have been
consumed by a saline hydrolysis reaction, what diminished its main role. The significant effect of NaOH corroborates this hypothesis. Some authors report that NaOH contributes to whitening the product, not only by preventing darkening reactions, but also by degrading starch's natural pigmentations (LEONEL et al., 2003). NaOH has a positive effect on luminosity L*, which measures the black and with scale, hence in accordance with literature. On the other hand, its effect
Runs Independent variables Responses
X1 X2 X3 Yield (%) L* a* b*
1 -1 -1 -1 18,00 95,81 0,086 3,670
2 +1 -1 -1 16,20 97,03 -0,216 2,313
3 -1 +1 -1 9,00 96,01 -0,040 2,390
4 +1 +1 -1 15,30 97,67 -0,266 2,160
5 -1 -1 +1 19,80 97,62 -0,063 1,990
6 +1 -1 +1 20,70 97,75 -0,233 2,093
7 -1 +1 +1 12,60 96,53 0,043 3,053
8 +1 +1 +1 15,30 97,91 -0,133 1,783
9 0 0 0 15,29 97,81 -0,113 2,006
10 0 0 0 15,30 98,05 -0,140 1,716
on a*, which measures the scale from green to red, is negative. Therefore, it is important to monitor the color of the starch in the optimization procedure. DT exerted positive influence on luminosity, unlike expected. This positive effect is associated to the constant temperature of the washing water, 5°C, which might have avoided most darkening reactions (OLIVEIRA, 2008; DAUDT, 2012). The Pareto analysis for the b* color parameter is not shown here since it does not indicate any statistically significant variable.
Based on the significant effects within 95% of confidence level, the mathematical model proposed for the yield (Y1) is given by:
(3) which,
ANOVA has to be carried out in order to verify its statistical significance.
As Table 4 shows, the calculated F value for the regression is much higher than the tabulated, indicating that the model is significant within 95% of confidence. The coefficient of determination, R2 = 99.34%, corroborates the quality of fit, since it explains 99.97% of the variations in the
observed data. Despite the lack of fit also being significant (Fcalculated = 22.98 > Ftabulated = 19.00), the predicted versus observed is random and there is no systematic deviation.
TABLE 4.ANOVA(p≤0,05) for the yield - 23 experimental design.
Source of variation Quadratic sum Degrees of freedom Mean square (MS) Fcalculated Ftabulated
Regression 101,86 6 16,98 100,90[1] 6,16[3]
Residue 0,67 4 0,17 - -
Lack of fit 0,64 2 0,32 22,98[2] 19,00[4]
Pure error 0,03 2 0,01 - -
Total 102,53 10 10,25 - -
[1]MSRegression/MSResidue; [2]MSLack of fit/MSPure error; [3]F95%,6,4; [4]F95%,2,2.
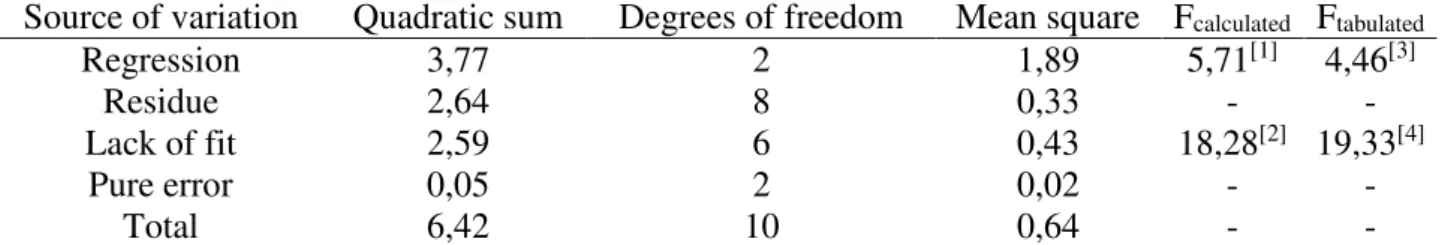
Table 5 presents the analysis of variance (ANOVA) regarding the color factor L*. The model obtained is not statistically significant since Fcalculated is slightly higher than Ftabulated. The coefficient
of determination, R2 = 60.0%, corroborates the low quality of fit. The ANOVA regarding the color
factor a* was not performed since the Pareto chart indicated only one significant effect.
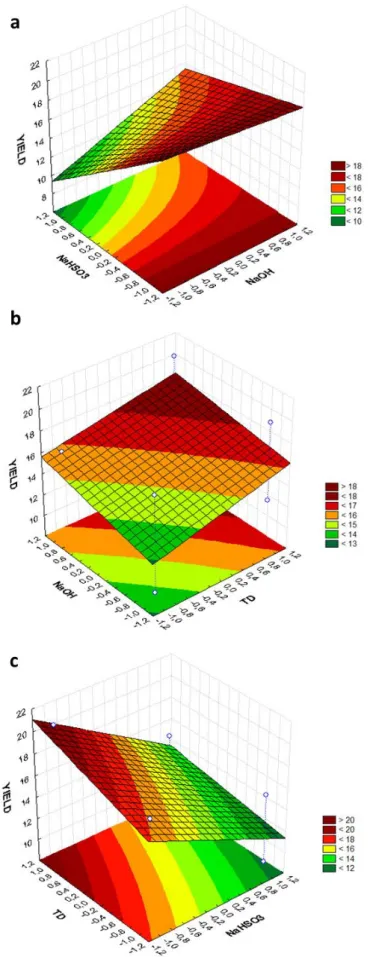
Once validating the model that predict yield, equation (3), the response surfaces might be analyzed. Figure 2a shows yield versus NaHSO3 and NaOH concentrations while the DT is fixed at
the central point. The surface makes more evident the interaction effect between the NaOH and NaHSO3 and its non-linear behavior.
TABLE 5. ANOVA (p≤0,05) for the factor L*- 23 experimental design.
Source of variation Quadratic sum Degrees of freedom Mean square Fcalculated Ftabulated
Regression 3,77 2 1,89 5,71[1] 4,46[3]
Residue 2,64 8 0,33 - -
Lack of fit 2,59 6 0,43 18,28[2] 19,33[4]
Pure error 0,05 2 0,02 - -
Total 6,42 10 0,64 - -
[1]MSRegression/MSResidue; [2]MSLack of fit/MSPure error; [3]F95%,2,8; [4]F95%,6,2.
At a fixed NaOH concentration, an increase in NaHSO3 concentration reduces yield since it
affords the hydrolysis reaction which reduces the NaOH concentration, as discussed before. At lower concentrations of NaHSO3, the interaction effect becomes a negligible.
Figure 2b and 2c illustrates the interaction effects of DT with NaOH and NaHSO3 on yield.
The response surfaces indicate that yield can be optimized towards lower concentrations of NaHSO3, higher concentrations of NaOH and higher decantation times. These tendencies are
corroborated by the analysis of Figure 2. Therefore, the levels might be re-defined (Table 2) in order to carry out a second design of experiment towards yield maximization. Since the NaHSO3
3.2 Second experimental design - 22 central composite design
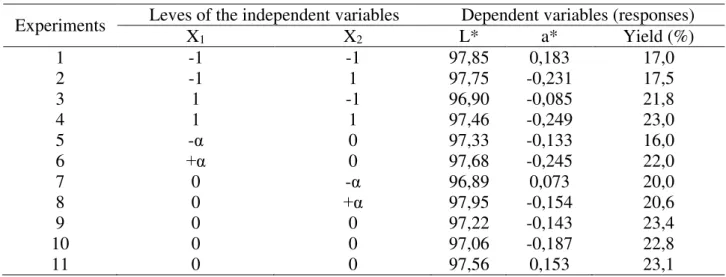
Based on the findings of the first design, a 22 central composite design was carried out, having
NaOH concentration and DT as independent variables. Their levels are given in Table 2 and Table 6 summarizes the design matrix and the responses yield, (L*) and (a*).
TABLE 6. Design matrix - 22 central composite design.
Experiments Leves of the independent variables X Dependent variables (responses)
1 X2 L* a* Yield (%)
1 -1 -1 97,85 0,183 17,0
2 -1 1 97,75 -0,231 17,5
3 1 -1 96,90 -0,085 21,8
4 1 1 97,46 -0,249 23,0
5 -α 0 97,33 -0,133 16,0
6 +α 0 97,68 -0,245 22,0
7 0 -α 96,89 0,073 20,0
8 0 +α 97,95 -0,154 20,6
9 0 0 97,22 -0,143 23,4
10 0 0 97,06 -0,187 22,8
FIGURE 2.Response surface; a) yield versus NaOH and NaHSO3; b) yield versus DT and NaOH;
c) yield versus DT and NaHSO3.
accordance with the first design and the quadratic term is also significant. Analysis for the luminosity (L*) and chromacity (a*) does not indicate any statistically significant variable, therefore are omitted here.
FIGURE 3.Pareto chart of for the yield - 22 central composite design.
Based on the Pareto chart analysis, a model for the yield (Y2) might be proposed, according
to:
(4)
The ANOVA, shown in Table 7, indicates that this model is statistically significant within 95% of confidence since the Fcalculated for the regression is much higher than the Ftabulated. The lack of
fit is not significant, corroborating the quality of fit. Furthermore, the coefficient of determination, R2 = 98.20%, indicates that it explains 99.80% of the variation from the observed data.
TABLE 7. ANOVA (p≤0,05) for the yield - 22 central composite design.
Source of variation Quadratic sum Degrees of freedom Mean square Fcalculated Ftabulated
Regression 81,20 3 27,10 140,45[1] 4,35[3]
Residue 1,35 7 0,20 - -
Lack of fit 1,20 5 0,23 2,60[2] 19,30[4]
Pure error 0,20 2 0,10 - -
Total 82,50 10 8,25 - -
[1]MSRegression/MSResidue; [2]MSLack of fit/MSPure error; [3]F95%,3,7; [4]F95%,5,2.
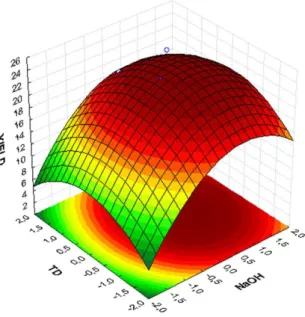
FIGURE 4.Surface the response of yield as function of NaOH and DT.
The yield of starch obtained from the peach palm fruit is much higher than the yield from other starch sources reported in literature as Table 8. It indicates the potential of the peach palm fruit as a competitive source of starch so that this current waste of the stem manufacture can contribute to a more sustainable process.
TABLE 8. Extraction yield from several sources reported in literature.
Source of starch Yield Authors
banana Nanicão (Musa sp. AAA) 5% FREITAS & TAVARES (2005)
banana Terra (Musa sapientum) 8% FREITAS & TAVARES (2005)
arrowroot (Maranta arundinaceae L.) 24.43% LEONEL et al. (2002)
cassava (Manihot esculenta Crantz) 33.25% NUNES et al. (2009)
ahipa (Pachyrhizus ahipa) 43% LEONEL et al. (2003)
cowpea-bean (Vigna unguiculata L.) 48% SALGADO et al. (2005)
CONCLUSIONS
The design of experiments and the response surface methodology indicated main and interacting effects allowing the optimization of the yield of extraction from the peach palm fruit. The design identified that the NaHSO3, a clarifying agent, indeed reduces yield in the presence of
NaOH, which is enough to ensure a pure and white starch. It further indicated the importance of NaOH and decantation time in increasing yield. Two sequential design of experiments allowed the maximization of the yield to 23.90% at 0.1325 M of NaOH and at 120 min, which was validated with triplicate experiments. The optimum yield is much higher than some reported in literature for other sources of starch. Therefore, the starch from the peach palm fruit presents itself as an alternative for higher scale production. Since the peach palm fruit is currently discarded during the steam manufacture, its usage as a source of starch might contribute significantly to a more sustainable process.
ACKNOWLEDGEMENTS
REFERENCES
AGUILERA, Y.; ESTEBAN, R. M.; BENÍTEZ, V.; MOLLÁ, E.; MARTÍN-CABREJAS, M. A.
Starch, functional properties, and microstructural characteristics in chickpea and lentil as affected by thermal processing. Journal of Agricultural and Food Chemistry, Washington, v.57, n.22, p.
10682-10688, 2009. doi: 10.1021/jf902042r.
APLEVICZ, K. S.; DEMIATE, I. M. Caracterização de amidos de mandioca nativos e modificados e utilização em produtos panificados. Ciência e Tecnologia de Alimentos, Campinas, v.27, n.3, p.
478-484, 2007.
ARAUJO-FARRO, P. C. A.; PODADERA, G.; SOBRAL, P. J. A.; MENEGALLI, F. C.
Development of films based on quinoa (Chenopodium quinoa Willdenow) starch. Carbohydrate Polymers, Baking, v.81, n.4, p.839-848, 2010. doi:10.1016/j.carbpol.2010.03.051.
OLIVEIRA, F. C. Estudos tecnológicos e de engenharia de armazenamento e processamento do pinhão. 197 p. Doutorado (Tese). Departamento de Engenharia Química. Universidade Federal
do Rio Grande do Sul, Porto Alegre, 2008.
DAUDT, R. M. Estudo das propriedades do amido de pinhão visando a sua utilização como excipiente farmacêutico. 103p. Mestrado (Dissertação). Departamento de Engenharia Química.
Universidade Federal do Rio Grande do Sul, Porto Alegre, 2012.
DENARDIN, C. C.; SILVA, L. P. Estrutura dos grânulos de amido e sua relação com propriedades físico-químicas. Ciência Rural, Santa Maria, v.39, n.3, p.945-954, 2009.
DEVEREUX, S.; SHUTTLEWORTH, P. S.; MACQUARRIE, D. J.; PARADISI, F. Isolation and Characterization of Recovered Starch from Industrial Wastewater. Journal of Polymers and the Environment, New York, v.19, n.4, p.971-979, 2011. doi: 10.1007/s10924-011-0342-0.
FARIAS NETO, J. T.; CLEMENT, C. R.; RESENDE, M. D. V. Estimativas de parâmetros genéticos e ganho de seleção para produção de frutos em progênies de polinização aberta de pupunheira no Estado do Pará, Brasil. Bragantia, Campinas, v.72, n.2, p.122-126, 2013.
FREITAS, M. C. J.; TAVARES, D. Q. Caracterização do grânulo de amido de bananas (AAA-nanicão e AAB-terra) musa musa. Ciência e Tecnologia de Alimentos, Campinas, v.25, n.2, p.
217-222, 2005.
LEONEL, M.; CEREDA, M. P. Caracterização físico-química de algumas tuberosas amiláceas. Ciência e Tecnologia de Alimentos, Campinas, v.22, n.1, p.65-69, 2002.
LEONEL, M.; SARMENTO, S. B. S; CEREDA, M. P.; CÂMARA, F. L. A. Extração e
caracterização de amido de jacatupé (Pachyrhizus ahipa). Ciência e Tecnologia de Alimentos,
Campinas, v.23, n.3, p.362-365, 2003.
LEONEL, M. Análise da forma e tamanho de grânulos de amidos de diferentes fontes botânicas.
Ciência e Tecnologia de Alimentos, Campinas, v.27, n.3, p.579-588, 2007.
LEONEL, M.; FREITAS, TS. MISCHAN. Características físicas mm de amido de mandioca extrusado. Scientia Agricola, Piracicaba,v 66, n. 4, p.486-493, 2009.
LIMA, B. N.; CABRAL, T. B.; NETO, R. P.; TAVARES, M. I. B.; PIERUCCI, A. P. T. Estudo do amido de farinhas comerciais comestíveis. Polímeros, v. 22, n. 5, p. 486-490, 2012.
http://dx.doi.org/10.1590/S0104-14282012005000062.
MADRIGAL-ALDANA, D. L.; TOVAR-GÓMEZ, B.; OCA, M. M. M.; SÁYAGO-AYERDI, S. G.; GUTIERREZ-MERAZ, F.; BELLO-PÉREZ, L. A. Isolation and characterization of Mexican jackfruit (Artocarpus heterophyllus L.) seeds starch in two mature stages. Starch - Stärke,
MELO NETO, B. A.; BARBOSA, A. A.; SANTOS LEITE, C. X.; ALMEIDA, P. F.; BONOMO, R. C. F.; PONTES, K. V. Chemical composition and functional properties of starch extracted from the pejibaye fruit (Bactris gasepaes Kunth.). Acta Scientiarum. Technology, Maringá, v.37, n.1, p.
105-110, 2015. doi: 10.4025/actascitechnol.v37i1.20740.
NUNES, L. B.; SANTOS, W. J.; CRUZ, R. S. Rendimento de extração e caracterização química e funcional de féculas de mandioca da região do Semi-Árido Baiano. Alimentos e Nutrição
Araraquara, v.20, n.1, p.129-134, 2009.
ROCHA, T. S.; DEMIATE, I. M.; FRANCO, C. M. L. Características estruturais e físico-químicas de amidos de mandioquinha-salsa (Arracacia xanthorrhiza). Ciência e Tecnologia de Alimentos,
Campinas, v.28, n.3, p.620-628, 2008.
SALGADO, S. M.; GUERRA, N. B.; ANDRADE, S. A. C.; OLIVERA, A. V. S Caracterização físico-química do grânulo do amido do feijão-caupi. Ciência e Tecnologia de Alimentos,
Campinas, v.25, n.3, p.525-530, 2005.
SANTANA, R. A. C.; CAMPOS, A. R. N.; MEDEIROS, E. A.; OLIVEIRA, A. L. M.; SILVA, L. M. F.; PRASAD, S. Studies on electrodeposition and corrosion behaviour of a Ni–W–Co
amorphous alloy. Journal of Materials Science, Andover, v.42, n.22, p.9137-9144, 2007.
SOUSA, E. P. D.; SOARES, N. S.; CORDEIRO, S. A.; SILVA, M. L. D. Competitividade da produção de palmito de pupunha no Espírito Santo e em São Paulo. Revista de Economia e Sociologia Rural, v. 49, n. 1, p. 157-179, 2011.
YOSHIDA, C. M. P.; ANTUNES, A. J. Aplicação de filmes proteicos à base de soro de leite.