2018 | Lavras | Editora UFLA | www.editora.ufla.br | www.scielo.br/cagro
http://dx.doi.org/10.1590/1413-70542018421003417
Atlantic Forest scenarios under the parameters of forestry laws
Cenários da Mata Atlântica sob os parâmetros das leis florestais
Liliane Garcia da Silva1*, Bruno Araujo Furtado de Mendonça2, Eliane Maria Ribeiro da Silva3, Márcio Rocha Francelino4
1Instituto Federal de Educação, Ciência e Tecnologia de Tocantins/IFTO, Paraíso do Tocantins, TO, Brasil 2Universidade Federal Rural do Rio de Janeiro/UFRRJ, Seropédica, RJ, Brasil
3Empresa Brasileira de Pesquisa Agropecuária/EMBRAPA, Embrapa Agrobiologia, Seropédica, RJ, Brasil 4Universidade Federal de Viçosa/UFV, Departamento de Solos, Viçosa, MG, Brasil
*Corresponding author: [email protected]
Received in February 2, 2017 and approved in September 6, 2017
ABSTRACT
Remote sensing allows for identification of regularities and irregularities in land use and land coverage (LULC) change in relation to environmental legislation. The aim of this study was to delimit scenarios in the permanent preservation areas (PPAs) according to the Brazilian forestry law, with or without consolidated uses in the basin of Capivari River and the State of Rio de Janeiro in the Atlantic Forest biome. Mapping and analysis were performed on LULC in areas of permanent preservation using the following data: RapidEye-REIS satellite scenes acquired in 2012 and Bhattacharyya distance classifier and hydrography of the basin and digital elevation model (1:25.000) using Spring and ArcGIS software. The legal scenarios adopted were as follows: I) Federal Law N°. 4,771/1965 and the National Council for the Environment (CONAMA) N°. 303/2002; II) Federal Law N°. 12,651/2012; and III) Federal Law N°. 12,651/2012 and N°. 12,727/2012. The classification presented an excellent overall accuracy of 91.15% and a Kappa Index of 0.86 in relation to the samples of the six multipurpose classes having the anthropic uses of agriculture, burned pasture, exposed soil and urbanization, which were present with conflicting uses for Scenarios I, II and III. The new forest legislation for the PPAs of Scenario III impacted the reduction of 68% compared to Scenario I, which corroborates with the concerns on the conservation of water and soil resources.
Index terms: Permanent preservation areas; remote sensing; conflicting uses; hotspot; Brazilian New Forest Code.
RESUMO
O sensoriamento remoto permite a identificação das regularidades e irregularidades do uso e cobertura do solo em relação à legislação ambiental e pode ser decisivo em tomadas de decisões para intervenção. O objetivo do trabalho foi delimitar cenários em áreas de preservação permanentes com e sem usos consolidados na bacia hidrográfica do Rio Capivari, Estado do Rio de Janeiro-Brasil, no bioma da Mata Atlântica. Foram realizados no mapeamento e a análise do uso e ocupação das áreas de preservação permanente, através dos seguintes dados: cenas do satélite RapidEye-REIS de 2012, classificador Bhattacharya Distance e hidrografia da bacia e modelo digital de elevação (1:25.000), e os softwares Spring5.2.7 e ARCGis 10.3.1. Os cenários adotados foram: I) Lei Federal n.º 4.771/1965 e Resolução do Conselho Nacional de Meio Ambiente (CONAMA) n.° 303/2002; II) Lei Federal n.º 12.651/20120; e III) Leis Federais n.º 12.651/2012 e n.º 12.727/2012. A classificação apresentou excelente acurácia de 91,15% para exatidão global e o índice Kappa de 0,86 em relação as amostras de treinamento das seis classes de usos múltiplos, tendo os usos antrópicos de Agropecuária, Queimadas, Solo Exposto e Urbanização, os quais estiveram presentes com usos conflitivos para Cenários I, II e III. A nova legislação florestal para as APPs do Cenário III impactou na redução em 68% em relação ao Cenário I, onde corrobora a preocupação na conservação dos recursos hídricos e edáficos, e o cumprimento da legislação.
Termos para indexação: Áreas de preservação permanente; sensoriamento remoto; usos conflitivos; hotspot; Novo
Código Florestal Brasileiro.
INTRODUCTION
According to Soares-Filho et al. (2014), the majority of areas of native vegetation in Brazil are under the rule of private properties (approximately 53%), in which the uses and land management are governed in part by the New Forest Code (Federal Law N°. 12,651/2012), which lists priority areas for preservation and is essential for mitigation of impacts in a changing climate (Castelo 2015; Altieri; Nicholls, 2017).
The permanent preservation areas (PPAs) are listed in the New Forest Code for the protection of natural resources (Brazil, 1965; 2012a; 2012b). These areas are covered or not by vegetation and are located alongside water courses, around springs, on steep slopes, and hilltops, among others, and they offerenvironmental services of the PPAs. Among the main ecosystem services of the PPAs are the preservation of water resources, edaphic and landscape,
society (Brazil, 2012a; Coutinho; Freitas; Philippi Júnior, 2014; Rendon; Dallimer; Paavola, 2016).
Nevertheless, geospatial information demonstrates that approximately 90% of the PPAs have anthropic uses of these areas (Soares-Filho et al., 2014), especially in Atlantic Forest locations (hotspots) (Alarcon et al., 2015).
Concerning this issue, Brazil (2012a, 2012b) reformulated the forest legislation, which highlighted the changes on the criteria for delimitation of PPAs on hilltops, the activities allowed with low potential environmental impacts on riparian areas of the PPA, and amnesty for persons who deforested the PPA before 28 Jul. 2008.
Some of these changes were considered concerning
by the scientific community during the discussions of these
laws, especially the issues of reduction and utilization of the PPAs (Lima et al., 2015), environmental impacts to biodiversity, water and soil resources, and carbon emissions to the climate panel (Di-Gregorio et al., 2017).
Furthermore, the New Forest Code created the Rural Environmental Registry (RER) to integrate environmental information of rural properties (Soares-Filho et al., 2014), which uses satellite images for delimitation of the PPAs and property boundaries (Francelino; Silva, 2014; Oliveira; Fernandes-Filho, 2016).
Accordingly, the objective of this study was the mapping and analysis of the land use and land cover (LULC)
in the PPAs (water springs, around water courses, hilltops
and slopes) using geospatial information for a specific area in
the Atlantic Forest, from the perspectives of environmental legislation and comparing different scenarios.
MATERIAL AND METHODS
The basin of the Capivari River is located in the Silva Jardim and Rio Bonito municipalities (Figure 1) in the State of Rio de Janeiro, within the Atlantic Forest. The populations of those municipalities are 55,551 for Rio Bonito and 22,349 for Silva Jardim, and their populations are 26% and 24% rural, respectively (Brazil, 2010).
The Capivari River has its headwaters in the Serra das Lavras in Rio Bonito; it has a catchment with a total area of 160.38 km², and its course extends for approximately 15 km, flowing into the Juturnaíba Dam, which empties into the basin of the São João River with an area of 1,394.00 km² (Bidegain; Pereira, 2005).
The ArcGIS (version 10.2) and Spring (version 5.2.7) softwares were used for processing the RapidEye sensor-REIS satellite imagery (spatial resolution of 6.5 metres) from the catalogue of images of the Brazilian Ministry of Environment; two scenes were utilized, dated 17 Sept. and 5 Dec. 2012, the projection UTM zone 23 South, datum SIRGAS 2000.
Figure 1: Location of the basin of the Capivari River, in the Silva Jardim and Rio Bonito municipalities, State of Rio
Furthermore, the limits used in the basin of the Capivari River and its sub-basins and hydrography are from the database prepared by Bidegain and Pereira (2005); for the construction of a digital elevation model (MDE) and areas of surface water runoff (ASWR), a base map was adopted of 1: 25.000 with pixels ranging from 10 to 10 metres, as developed by Rio de Janeiro (2016).
In the Spring (version 5.2.7), supervised classification was carried out by the Hattacharyya Distance algorithm (Das; Sarma; Sengupta, 2015; Xun; Wang, 2015) for class: agriculture, water bodies, clouds, burned pasture, exposed soil, urbanization and dense vegetation.
To assess the quality of classification, a matrix of confusion was developed, as in Congalton and Green (2009), with the commission of errors and the classification omission; the Kappa index (K) was calculated for the classes of land use and land coverage, where the values were interpreted as in Landis and Kock (1977).
For this study, the following categories of permanent protection areas (PPAs) were listed: PPAs that are located in the surroundings of water springs areas (PPAWS), PPAs bordering watercourses (PPAWC) having widths up to 10 metres; PPAs on hilltops (PPAH), and finally, PPAs that are on slopes greater than 45° (PPAS).
In addition, three scenarios were elaborated concerning these PPA categories, as follows (Table 1): Scenario I takes into account the limits set by the Old Forest Code (Federal Law N°. 4,771/1965, plus the parameters for delimitation of APPT by CONAMA resolution N°. 303/2002); Scenario II adopts the limits and criteria of the New Forest Code (Federal Law N°. 12,651/2012) and; Scenario III follows the current legal scenario which is a new alteration made in the New Forest Code (Federal Law N°. 12,727/2012), which considers only rural properties with 2 to 4 fiscal modules, which, for consolidated uses up to 28 Jul. 2008, determines the PPAWS area as 15 metres
Table 1: Proposed scenarios for delimitation of PPAs in the study area.
Scenario I
PPAs Methodology
PPAWS Buffer was elaborated with a radius of 50 metres at the starting point of the hydrography. PPAWC Buffer was delimited 30 metres surrounding the hydrography.
PPAH Hilltops with hills at least 50 m high and with most slopes above 30% in the upper third
of the hillsides, according to Ribeiro et al. (2005).
PPAS Slope Reclassify tools were used on the cells (grid) in MDEs that have a steepness greater than 45°.
Scenario II
PPAs Methodology
PPAWS Buffer was elaborated with a radius of 50 metres at the starting point of the hydrography. PPAWC Buffer was delimited 30 metres from the surrounding hydrography.
PPAH Hilltops with hills at least 100 m high and with most slopes above 25% in the upper
third of the hillsides in relation to the base, as defined by the horizontal plane, which
is determined by adjacent plain or water surfaces or, in wavy relief, the height of the
nearest saddle point, using Oliveira; Fernandes-Filho (2016) instructions.
PPAS Slope Reclassify tools were used on the cells (grid) in MDEs that have a steepness greater than 45°.
Scenario III
PPAs Methodology
PPAWS Buffer was elaborated with a radius of 15 metres at the starting point of the hydrography. PPAWC Buffer was delimited 15 metres surrounding the hydrography.
PPAH Hilltops with hills at least 100 m high and with most slopes above 25% in the upper third
of the hillsides in relation to a base, defined by the horizontal plane, which is determined
by adjacent plain or water surfaces or, in wavy relief, the height of the nearest saddle
point, using the method of Oliveira; Fernandes-Filho (2016).
PPAS Slope Reclassify tools were used on the cells (grid) in the MDE that have steepness greater than 45°.
from the spring and the PPAWC as 15 metres from the water stream. A fiscal module is a rural unit of measure, which can vary in size throughout Brazilian municipalities. We use the Brazil (2013) database to estimate the average size of rural properties of the Rio Bonito and Silva Jardim municipalities.
To determine areas with conflicting use, data of use classification and land covering were utilized, crossing them with the limits of the PPAs in the scenarios proposed in ArcGIS 10.2.
RESULTS AND DISCUSSION
Figure 2 shows the results of a supervised classification using the Bhattacharyya Distance algorithm. Dense vegetation occupies mostly the north and northwest border areas of the basin, and agriculture is the most represented class and is distributed in all study areas. Agriculture is an important economic factor for this region (Brazil, 2010) and is represented mostly by extensive livestock production.
Table 2 shows the results of a classification using 1,315 training samples, and the Bhattacharyya Distance
algorithm correctly classified 1,198 samples in the study area, with a value of 91.15% for overall accuracy and a Kappa index (K) of 0.86 (excellent).
The K values of the thematic classes (Table 2), on average, achieved excellent values, with the exception of the urbanization class, which had a classification with a reasonable quality (0.39). The largest error occurred in classes related to urbanization, with a 0.57 commission error, which indicates that 57% of the pixels of this class were not classified correctly, and soil exposed (0.17), indicating that 17% of the pixels of this class were also not classified correctly.
Nunes and Roing (2015), note that similar spectral sample values used in automatic classification decrease its accuracy, as verified for urbanization classes and exposed soil. The urbanization class has a mixture of spectral patterns of agriculture, exposed soil and vegetation, because in a more detailed scale, these classes of use and land coverage can also occur in urbanized areas such as backyards, unpaved roads, derelict land, and squares.
Moreover, the urbanization class also had the highest error of omission (0.39), indicating that the pixels were allocated improperly when generating the classified map, which increases the difficulty of mapping this class. The burned pasture class also showed a high error of omission (0.26), with approximately 20% of the samples being confused with the urbanization class.
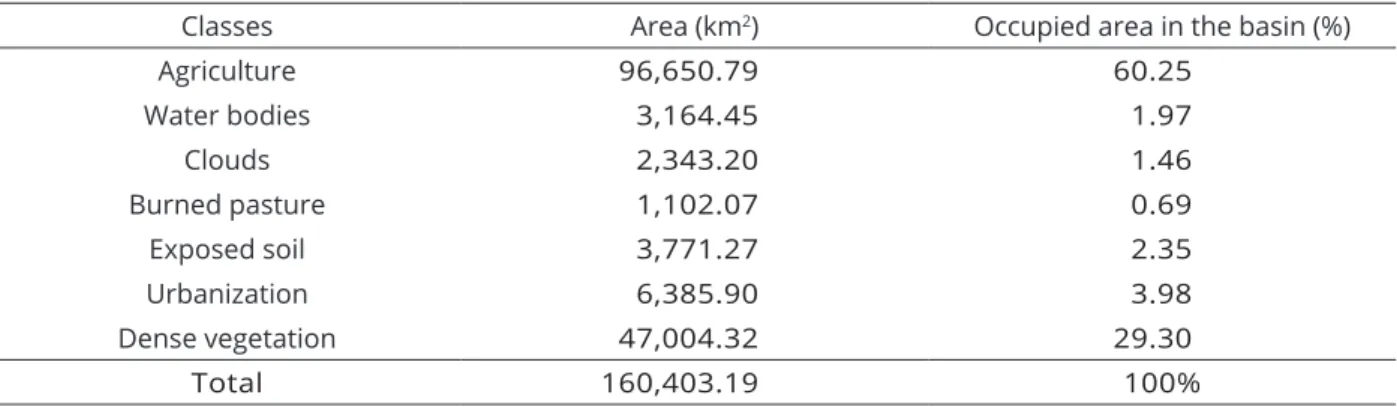
Regarding the distribution of areas and relative percentages for use and occupation (Table 3), the predominant class was agriculture, followed by dense vegetation, and then areas of urbanization, exposed
soil, water bodies, clouds, and finally, areas of burned pasture. The study area showed a predominance of anthropogenic uses over 107,910.03 km2, or 67%, by agriculture, urbanization, exposed soil and burned pasture. Although the majority of the population in the study area is concentrated in urban areas (approximately 75%)
(Brazil, 2010), this LULC consist of only 4% of the area. The major area mapped is represented by Agriculture and corroborates the importance of agriculture for this region (Brazil, 2010).
The Food and Agriculture Organization of the United Nations (2014) and Lima et al. (2015) stated that anthropogenic uses, as presented in the study area, are responsible for the Atlantic Forest land loss in Brazil.
Therefore, Ferreira et al. (2012) and Silva and Ranieri (2014) note the need to reduce the negative effects on conservation of biodiversity that are associated with habitat loss; among the measures, changes and limitations are suggested in anthropogenic uses in these spaces. In this sense, the legal requirements determined by the new Forest Code and legislations of the Rio de Janeiro State are adequate, which are fundamental to the maintenance of biodiversity in all planning scales (Soares-Filho et al., 2014).
Table 2: Matrix of confusion obtained by the supervised classification for the basin of the Capivari River, Silva
Jardim and Rio Bonito, Rio de Janeiro State, Brazil.
Classes A WB C BP ES U DV UA CE K Quality
A 280 2 0 1 0 1 10 294 0.05 0.94 Excellent
WB 2 21 0 0 0 0 0 23 0.09 0.91 Excellent
C 0 0 10 0 0 1 0 11 0.09 0.91 Excellent
BP 0 0 0 48 0 5 0 53 0.09 0.90 Excellent
ES 1 1 0 2 90 15 0 109 0.17 0.81 Excellent
U 14 2 2 13 17 43 10 101 0.57 0.39 Reasonable
DV 0 0 0 1 1 5 600 607 0.01 0.98 Excellent
PA 297 26 12 65 108 70 620 1198 -- --
--OE 0.06 0.19 0.17 0.26 0.17 0.39 0.03 -- -- --
--Legend: A= Agriculture; WB= Water Bodies; C= Clouds; BP= Burned Pasture; ES= Exposed Soil; U= Urbanization; DV= Dense Vegetation; UA = User Accuracy; CE= Commission Error; K= Kappa Index; PA= Producer Accuracy; OE= Omission Error.
Table 3: Classes of land use and land covering in the study area.
Classes Area (km2) Occupied area in the basin (%)
Agriculture 96,650.79 60.25
Water bodies 3,164.45 1.97
Clouds 2,343.20 1.46
Burned pasture 1,102.07 0.69
Exposed soil 3,771.27 2.35
Urbanization 6,385.90 3.98
Dense vegetation 47,004.32 29.30
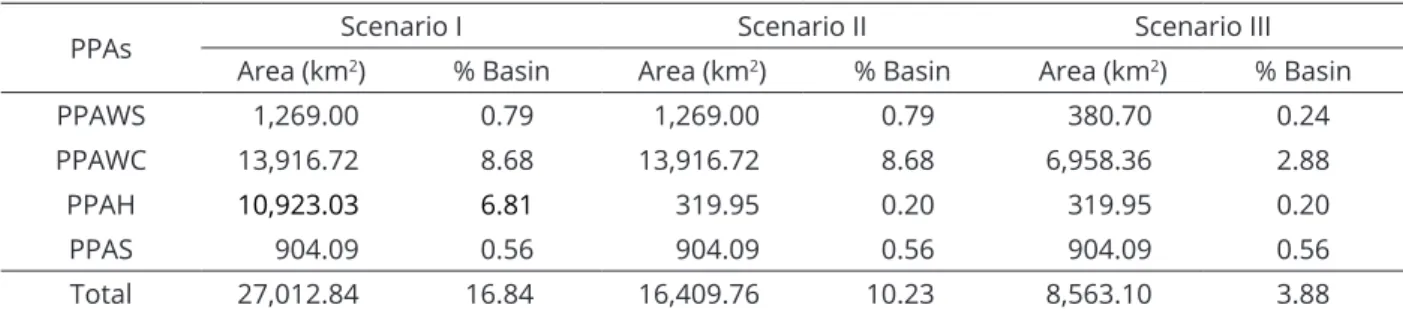
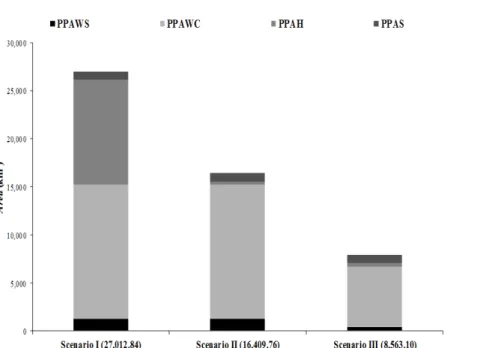
Table 4 presents the information obtained in the proposed scenarios for PPAs in the basin of the Capivari River; considering it has an area of 160,403.20 km2, a reduction of 39% in the PPAs of Scenario II and a reduction of 68% of the PPAs of Scenario III were found when compared to Scenario I; in other words, Federal Laws N°. 12,651/2012 and N°. 12,727/2012 were not able to protect 39% and 68% of the PPAs, respectively.
Fraga et al. (2014), comparing the delimitation of PPAs by using the 2012 (Federal Law N°. 12,651/2012) and 1965 (Federal Law N°. 4,771/1965) laws in areas without consolidated uses, found a 27% reduction in PPAs. In comparison, Santos et al. (2015) identified a change of 31.26% (Federal Law N°. 4,771/1965) compared to 24.82% (Federal Law N°. 12,651/2012) in areas without consolidated uses.
The values (Table 4) of areas of the PPAH from Scenario II and III were reduced by 97.07% compared to the PPAH from Scenario I; this result is associated with changes in the criteria/parameters for defining the PPAH made by Brazil (2012a). Francelino and Silva (2014) explained that the minimum height and inclination of the terrain to delimit a PPAH was altered from 100 m to 50 m, while the declivity (inclination measurement) was altered more than 30% (approximately 17°) on the line of greater declivity, and now being considered the average of the feature (saddle point) and values higher than 25°, resulting in a loss of areas with lower limits on grounds with average slopes greater than 25° and a height of 100 metres that were previously protected (Santos et al., 2016); hence, this reduction has had a negative impact on the preservation of such spaces (Nery et al., 2013).
Regarding the values of the PPAWC and PPAWS from Scenario III (Figure 3), reductions of 50% and 70% were found, respectively, when compared to the same categories of PPAs from Scenarios I and II.
The data in Figure 3 demonstrate that the changes in limits and permitted uses of the PPAWC and PPAWS in Article 61a of the Federal Law N°. 12,727/2012 corroborate the controversy generated by approval of forest legislation in 2012, which brought discontentment by part of the scholars in relation to legislators (Platiau et al., 2014).
Coutinho et al. (2014) and Nassar and Antoniazzi (2012) emphasize that the decisions that guided part of the changes of Law N°. 12,727/2012 derived from articulations and political negotiations necessary to meet specific interests (businessmen and farmers), and the recommendations and notes from the scientific community were not explored in coverage of the discussions for the resolution of environmental problems.
In this regard, Alarcon et al. (2015) and Gouvea (2013) note that the PPAs located near riparian areas and hilltops have a fundamental role in the protection of water resources. Thus, their removal brings negative effects for the quality and quantity of surface and underground water, accelerating sedimentation of ponds, dams and rivers, and reducing the stock of water in streams and aquifers, Moreover, if these PPAs are not implemented, there is a high chance of environmental degradation.
Accordingly, Fraga et al. (2014) and Sparovek et al. (2012) stated that Federal Law N°. 12,651/2012 eased the possibility of different anthropogenic uses of Scenarios I and II in the PPAs surrounding water springs and water courses, Nevertheless, these are still the main instruments for environmental protection in Brazil.
Table 5 presents the conflicting uses within the PPAs within 4,721.79 km2 or 17% in Scenario I, 1,933.97 km2 or 12% in Scenario II; and 978.79 km2 or 11% in Scenario III, which were considered the total of the PPAs (Table 4).
Table 4: Proposed scenarios of permanent preservation areas for the study area.
PPAs Scenario I Scenario II Scenario III
Area (km2) % Basin Area (km2) % Basin Area (km2) % Basin
PPAWS 1,269.00 0.79 1,269.00 0.79 380.70 0.24
PPAWC 13,916.72 8.68 13,916.72 8.68 6,958.36 2.88
PPAH 10,923.03 6.81 319.95 0.20 319.95 0.20
PPAS 904.09 0.56 904.09 0.56 904.09 0.56
Total 27,012.84 16.84 16,409.76 10.23 8,563.10 3.88
Figure 3: Delimitation of PPAs in Scenarios I, II and III for the basin of the Capivari River, Silva Jardim and Rio Bonito, Rio de Janeiro State, Brazil.
The existence of conflicting uses in the basin of the Capivari River in Scenarios I (17%), II (12%) and III (11%) is not unique. Silva and Ranieri (2014) and Soares-Filho et al. (2014) note that the majority of Brazilian rural properties accumulate environmental liabilities in relation to native forests in the PPAs.
Studies that considered limits of the PPAs in Scenarios I and II, as Fraga et al. (2014) demonstrated the existence of uses (Agriculture) in PPAs in both Scenarios I (53%) and II (38%). While the studies use the same legal parameters of Scenario II, Gasparini et al. (2013), showed 28% (Agriculture) and Nardini et al. (2015) found valu
es for conflicting uses (Agriculture) in PPAs of 38%, and Ribeiro et al. (2014) delimited 39% (Agriculture).
Based on the existence of anthropogenic uses in all scenarios studied (Table 5), Fraga et al. (2014) noted that, in spite of the changes proposed by reformulation of forest legislation, which reduced the areas of PPAs from Scenario I, there was no impact on enforcement of the laws governing Scenarios II and III. In addition, legally, Scenario II was replaced by Scenario III.
In addition, changes on the limits of PPAs in Scenarios III weakens the protection of the Atlantic Forest, as the considerations of Alarcon et al. (2015)
and Lima et al. (2015) showed on permission granted by the law, which is in disagreement with Federal Law N°. 11,428/2006, as follows: “the cutting and suppression of primary vegetation or in advanced and middle stages of regeneration in the Atlantic Forest are sealed, when these are engaged in the task of protecting water sources or preventing and controlling erosion” (Brazil, 2006).
The situation concerning conflicting uses in the PPAs found in the proposed scenarios, according to Altieri and Nicholls (2017), Ferreira et al. (2012) and Silva et al. (2015), accelerates the process of erosion and may compromise the sustainability of agriculture in the short term, as it is present in 60% (Table 3) of the study area.
Furthermore, the Capivari River is itself a tributary that converges into the Juturnaíba dam. Hence, Richards et al. (2017) and Rodrigues-Filho et al. (2015) signalled that uses by anthropic activities will imply a reduction in quality of surface water.
Table 5: Areas with conflicts of use depending on the thematic classes of utilization and land occupation for the
scenarios of the proposed PPAs in the study area.
PPAs
Scenario I
Agriculture Burned pasture Exposed soil Urbanization Total PPA use Area (km2) % Area (km2) % Area (km2) % Area (km2) % Area (km2) %
PPAWS 64.35 1.5 1.25 8.9 1.2 0.85 0.73 0.6 67.53 1.4
PPAWC 1,610.42 36.4 12.25 87.3 42.6 30.17 99.0 78.9 1,764.27 37.4
PPAH 2,682.76 60.7 20.48 1.6 91.7 64.94 25.5 20.3 2,820.44 59.7
PPAS 63.27 1.4 0.32 2.3 5.7 4.04 0.26 0.2 69.55 1.5
Total classes 4,420.80 100 34.30 100 141.20 100 125.49 100 4,721.80 100
PPAs
Scenario II
Agriculture Burned pasture Exposed soil Urbanization Total PPA use Area (km2) % Area (km2) % Area (km2) % Area (km2) % Area (km2) %
PPAWS 64.35 3.63 1.25 8.90 1.2 2.42 0,73 0.73 67.53 3.49
PPAWC 1,610.42 90.9 12.25 87.25 42.6 86.0 99.0 99.01 1,764.27 91.23
PPAH 32.40 1.83 0.22 1.57 0.0 0.0 0.0 0.0 32.62 1.69
PPAS 63.27 3.57 0.32 2.28 5.7 11.5 0,26 0.26 69.55 3.60
Total classes 1,770.44 100 14.04 100 49.5 100 99.99 100 1,933.97 100
PPAs
Scenario III
Agriculture Burned pasture Exposed soil Urbanization Total PPA use Area (km2) % Area (km2) % Area (km2) % Area (km2) % Area (km2) %
PPAWS 0.96 0.9 0.01 1.23 0.02 0.30 0.0 0.0 0.99 0.49
PPAWC 805.21 89.2 6.12 91.7 21.3 78.8 43.0 99.4 875.63 89.4
PPAH 32.40 30.5 0.22 27.16 0.0 0.0 0.0 0.0 32.62 16.11
PPAS 63.27 59.6 0.32 39.51 5.7 88.5 0.26 0.3 69.55 34.35
Total classes 901.84 100 6.67 100 27.02 100 43.26 100 978.79 100
Legend: Scenario I= Federal Law N°. 4,771/1965 and Resolution CONAMA No 303/2002; Scenario II= Federal Law N°. 12,651/ 2012; Scenario III= Federal Law N°. 12,651/2012 and N°. 12,727/2012; PPAWS= Permanent preservation areas surrounding water springs; PPAWC= Permanent preservation areas bordering water courses; PPAH= Permanent preservation areas on hilltops; PPAS= Permanent preservation areas on slopes.
The values of the conflicting uses present in the agricultural area of study in Scenarios I (94%) and II (91%) were different when compared to data found in the same class in studies by Moreira et al. (2015) and Ribeiro et al. (2014), which showed 53.73% and 37.37% within the PPAs, respectively. Ferrari et al. (2015) also identified the occurrence of conflicts by agriculture (88%) in PPAWC, as verified for Scenarios II and III.
Scenario III represents a real and a current legal situation in Brazil, which indicates an increase of legal agriculture uses for this area; however, it is related to
Nevertheless, Brazil (2012a) provides positive alternatives for regularization of natural landscapes for the social agents involved, through the development of the Rural Environmental Registration (RER) and adherence to the Environmental Adjustment Program (EAP), and also, by the recovery of shares of deforested areas with native species or the compensation in another area with the same biome, or by allowing the natural regeneration of the environment, and permitting the management of these areas with low environmental impact activities, such as an agro-forestry system.
Accordingly, Silva-Filho et al. (2014) highlight that while the new Brazilian Forest Code changes the parameters to delimit the PPAs, it also grants amnesty to illegal loggers (until July 22, 2008); however, it creates new mechanisms for forest conservation (Antunes, 2016), such as the RER, the EAP and the conservationist uses in the PPAs with low-impact activities (Alarcon, 2015).
Although anthropogenic uses can act negatively on the preservationist prism of the PPAs in Scenarios III, Bertini, Fushita and Lima (2015), Platiau et al. (2014), and Rendon, Dallimer and Paavola, (2016)
found that there is a growing interest in the conservation community in developing strategies to ensure production with conservation of biodiversity and the generation of environmental services in the PPAs.
The integration of an agroforestry system within the PPAs is emphasized by Alarcon et al. (2015) and Di-Gregorio et al. (2017) as a positive change, as this management can generate promising environmental and socioeconomic benefits in areas that have conflicting uses, such as in Scenarios II and III. The possibility of obtaining economic benefits stimulates interest in promoting recovery of these areas (Lima et al., 2015), allowing the protection of biodiversity (Martins; Ranieri, 2015).
CONCLUSIONS
The adoption of the limits established by the current new forest legislation for PPAs in Scenario III caused a reduction of 68%, compared to that of Scenario I in the study area. The legislative changes in 2012 caused a considerable reduction in PPAs in Scenario II in the category of PPAH and Scenario III in the categories Figure 4: Conflicts of uses in the scenarios for the basin of the Capivari River, Silva Jardim and Rio Bonito, Rio de
of PPAH, PPAWS and PPAWC, both in relation to Scenario I. Agricultural and urbanization activities are significantly present in parts of the PPAs surrounding water courses in Scenarios I, II and III, which corroborates the hypothesis that this study area suffers from environmental pressures, even though the new legislation opposes aspects for protection of the Atlantic Forest (Federal Law N°. 11,428/2006). The use of geospatial techniques, with the crossing of information on forest legislation, potentially detected areas with use conflicts for PPAs with and without consolidated anthropogenic uses. This information (Scenarios) can contribute to the reflection, planning, monitoring and environmental management of these regions.
REFERENCES
ALARCON, G. G. et al. Weakening the Brazilian legislation for forest conservation has severe impacts for ecosystem services in the Atlantic Forest. Land Use Policy,
47(4):1-11, 2015.
ALTIERI, M. A.; NICHOLLS, C. I. The adaptation and mitigation potential of traditional agriculture in a changing climate.
Climatic Change,140(1):33-45, 2017.
AMARAL, M. V. F. et al. Assessment and comparison of methods of classification of orbital images for the mapping of forest succession stadiums. Brazilian Journal of Forest and Environment, 33(3):575-582, 2009.
ANTUNES, P. B. The precautionary principle in the Brazilian environmental law. Veredas do Direito, 13(27):63-88, 2016.
BIDEGAIN, P.; PEREIRA, L. F. M. Plano das Bacias Hidrográficas
da Região dos Lagos e do Rio São João - Rio de Janeiro. Araruama-RJ: Consórcio Intermunicipal para Gestão das Bacias da Região dos Lagos, Rio São João e Zona Costeira – CILSJ, 2005. 153p.
BERTINI, M. A.; FUSHITA, A. T.; LIMA, M. I. S. Vegetation coverage in hydrographic basins in the central region of the State of São Paulo, Brazil. Brazilian Journal of Biology, 75(3):
709-717, 2015.
BRASIL, R. F. Geocatálogo de imagens de satélite RapidEye-REIS do Ministério do Meio Ambiente: Cenas dos municípios de Rio Bonito e Silva Jardim datadas de 17 de setembro e 05 de dezembro do ano de 2012. 2015b. Available in: <//http://geocatalogo.ibama.gov.br/>. Access in: November, 19, 2015.
BRASIL, R. F. Índices Básicos de 2013. Brasília: Instituto Nacional de Colonização e Reforma Agrária, 2013. 149p.
BRASIL, R. F. Lei Federal n.º 12.651, de 25 de maio de 2012. Brasília: Diário Oficial da República Federativa do Brasil, 2012a. 23p.
BRASIL, R. F. Lei Federal n.º 12.727, de 17 outubro de 2012. Brasília: Diário Oficial da República Federativa do Brasil, 2012b. 6p.
BRASIL, R. F. Censo Demográfico 2010. Aglomerados subnormais. Informações territoriais. Instituto Brasileiro de Geografia e Estatística (IBGE): Rio de Janeiro. 2010. 251p. BRASIL, R. F. Lei Federal n.º 11.428, de 22 de dezembro de
2006. Brasília: Diário Oficial da República Federativa do Brasil, 2006. 7p.
BRASIL, R. F. Resolução do Conselho Nacional do Meio Ambiente (CONAMA) nº 303, de 20 de março de 2002. Brasília: Diário Oficial da República Federativa do Brasil, 2002. 2p.
BRASIL, R. F. Lei Federal n.º 4.771, de 15 de setembro de 1965. Rio de Janeiro: Diário Oficial da República Federativa do Brasil, 1965. 9p.
CASTELO, T. B. Brazilian forestry legislation and to combat deforestation government policies in the Amazon (Brazilian Amazon). Environment and Society, 18(4):221-242, 2016.
CONGALTON, R.; GREEN, K. Assessing the accuracy of remotely sensed data: Principles and practices. Boca Raton: CRC/Taylor & Francis, 2009. 183p.
COUTINHO, S. M. V.; FREITAS, V. P.; PHILIPPI JÚNIOR; A. El papel de la academia en la elaboración del Código Forestal Brasileño. Monfragü, 2(2):1-26, 2014.
DAS, K.; SARMA, P. D.; SENGUPTA, S. Discrimination and plot wise area estimation of seasonal crops from high resolution World View 2 Multispectral Image. Asian Journal of Geoinformatics, 15(2):10-21, 2015.
DI-GREGORIO, M. et al. Climate policy integration in the land use sector: Mitigation, adaptation and sustainable development linkages. Environmental Science and Policy, 67(2): 35-43, 2017.
FERREIRA, J. et al. Towards environmentally sustainable agriculture in Brazil: Challenges and opportunities for applied ecological research. Journal of Applied Ecology, 49(3):535-541, 2012.
FRAGA, N. C. et al. Impact of the new forest code: An analysis of the case “Engenho de Ferro” river, in Ibiporã city, Paraná state. Geographia Opportuno Tempore, 3(1):80-101,
2014.
FRANCELINO, M. R.; SILVA, J. A. Impact of average slope on the delimitation of permanent preservation areas.
Brazilian Journal of Forest and Environment,
21(4):41-448, 2014.
GASPARINI, K. A. C. et al. Geoprocessing techniques and remote sensing applied to the identification of land use conflicts in Seropédica, RJ. Brazilian Journal of Forest and Environment, 20(3) 296-306, 2013.
GOUVÊA, Y. M. G. Novo código florestal: Comentários à Lei nº.12.651/2012, à Lei nº. 12.727/2012 e do Decreto 7.830/2012. In.: GOUVÊA, Y. M. G. Direito Ambiental Brasileiro. São Paulo: Revista dos Tribunais, 2013. 1466p.
LANDIS, J. R.; KOCH, G. G. The measurement of observer agreement for categorical data. Biometrics, 33(2):159-174, 1977.
LIMA, R. A. et al. How much do we know about the endangered Atlantic Forest? Reviewing nearly 70 years of information on tree community surveys. Biodiversity and Conservation, 24(9):2135-2148, 2015.
MARTINS, T. P.; RANIERI, V. E. L. Agroforestry as an alternative to legal reserves. Environment and Society, 17(3):79-96, 2015.
MOREIRA, T. R. et al. Land use and occupation analysis of
permanent preservation areas in the municipality of Muqui, Espirito Santo state, Brazil. Brazilian Journal of Forest and Environment, 22(2):141-152, 2015.
NARDINI, R. C. et al. Evaluation of the use of conflict areas in app stream Morro Grande watershed. Geography Paths, 16(55):104-113, 2015.
NASSAR, A. M.; ANTONIAZZI, L. B. Reform of the forest code: A balanced vision. Agricultural View, 4(8):4-7, 2012.
NERY, C. V. M. et al. Application of the new forest code in the evaluation of permanent preservation areas on hill top in the sub-basin of Canoas river at municipality of Montes Claros/MG.Brazilian Journal of Physical Geography, 6(6):1673-1688, 2014.
NUNES, J. F.; ROIG, H. L. Land use and land occupation a n a l y s i s a n d m a p p i n g o f t h e A l t o D e s c o b e r t o hydrographic basin, DF/GO, using a fuzzy rule-based automatic classification. Brazilian Journal of Forest Science, 39(1): 25-36, 2015.
OLIVEIRA, G. C.; FERNANDES-FILHO, E. I. Automated mapping of permanent preservation areas on hilltops. Cerne, 22(1):111-120, 2016.
UNITED NATIONS ORGANIZATION FOR FOOD AND AGRICULTURE. Evaluation of global forest resources 2015: Country report Brazil. 2014. Available in: <http:// www.fao.org/3/a-ae.pdf.> Access in April, 22, 2016.
PLATIAU, A. F. B.; VIANA, F. C.; SILVA, C. H. R. T. Brazil’s institutional dissonance and its challenges for the Rio+20 Conference. Brazilian Journal of International Law, 9(3):159, 2014.
RENDON, O.; DALLIMER, M.; PAAVOLA, J. Flow and rent-based opportunity costs of water ecosystem service provision in a complex farming system. Ecology and Society, 21(4): 1-16, 2016.
RIBEIRO, C. A. A. S. et al. Permanent preservation areas in
conflict with the use and the occupation of the soil in the
hydrographic basin of the Stream Sertão, Cajuri, Minas Gerais. Agrogeoambiental, 6(2):21-29, 2014.
RIBEIRO, C. A. A. S. et al. The challenge of the delineation of natural preserves. Brazilian Journal of Forest Science, 29(2): 203-212, 2005.
RICHARDS, R. C. et al. Considering farmer land use decisions in efforts to ‘scale up’ payments for watershed services.
Ecosystem Services, 23(1):238-247, 2017.
RIO DE JANEIRO, E. Base de dados do estado do Rio de Janeiro.
2016. Available in: <http://webgeo.desenvolvimentoregional. rj.gov.br>. Access in: May 22, 2016.
RODRIGUES-FILHO, J. L. et al. Spatial patterns of water quality in Xingu River Basin (Amazonia) prior to the Belo Monte dam impoundment. Brazilian Journal of Biology, 75(3):
34-46, 2015.
SANTOS, A. R. et al. Influence of relief on permanent preservation areas. Science of the Total Environment, 541(3):1296-1302, 2016.
SILVA, J. S.; RANIERI, V. E. L. The legal reserve areas compensation mechanism and its economic and environmental implications. Environment and Society, 17(7):115-132, 2014.
SOARES-FILHO, B. et al. Cracking Brazil’s forest code. Science, 344(6182):363-364, 2014.
SPAROVEK, G. et al. The revision of the Brazilian Forest Act: Increased deforestation or a historic step towards balancing
agricultural development and nature conservation?
Environmental Science and Policy, 16(4) 65-72, 2012.