http://www.uem.br/acta ISSN printed: 1679-9275 ISSN on-line: 1807-8621
Doi: 10.4025/actasciagron.v37i1.18061
Liming and fertilisation in
Pinus taeda
plantations with severe
nutrient deficiency in savanna soils
Araína Hulmann Batista1*, Antônio Carlos Vargas Motta1, Carlos Bruno Reissmann1, Thays Schneider2, Iara Lang Martins1 and Maurício Hashimoto1
1
Programa de Pós-graduação em Ciência do Solo, Universidade Federal do Paraná, Rua dos Funcionários, 1540, 80035-050, Curitiba, Paraná, Brazil. 2Universidade Estadual de Ponta Grossa, Ponta Grossa, Paraná, Brazil. *Author for correspondence. E-mail: arainahulmann@gmail.com
ABSTRACT. Soils with high acidity and low exchangeable bases may be responsible for low yields of Pinus taeda in a forest plantation at Jaguariaíva, Paraná State, Brazil. The aim of this study was to evaluate the effect of liming and fertilisation, applied over litter, on two selected areas with Pinus taeda plantations. Soil, litter and pine needles were evaluated for K, Ca and Mg concentrations and soil acidity parameters. Seven treatments were applied: (i) complete (N, P, K, Zn, Cu, B, Mo, and lime); (ii) without N, P, and K; (iii) without Zn, Cu, B, and Mo; (iv) without K; (v) without Zn; (vi) without lime; and (vii) control (without nutrients and lime). Soil samples were collected at five soil depths (0-5, 5-10, 10-20, 20-40 and 40-60 cm) simultaneously with litter samples. Needles were also collected from the first and second pine flushes. Liming induced soil pH, Ca2+, and Mg2+ increases, and the opposite was observed for Al3+ and Al saturation. Fertilisation increased soil exchangeable K+ concentrations and needle and litter K concentrations. The low Ca and Mg concentrations found in the plant needles might be attributable to their low mobility.
Keywords: nutrient deficiency, reforestation, litter, soil reaction, acidification.
Calagem e adubação em plantios de
Pinus taeda
com severa deficiência nutricional em
solos de cerrado
RESUMO. Solos com alta acidez e baixos teores de bases trocáveis podem ser a causa da baixa produtividade de plantios de Pinus taeda, em Jaguariaíva, PR, Brasil. O objetivo deste estudo foi avaliar o efeito da calagem e adubação aplicadas sobre a serapilheira, em duas áreas com Pinus taeda. Foram avaliadas as concentrações de K+, Ca2+ e Mg2+ no solo, serapilheira e acículas, além dos parâmetros da acidez do solo. Sete tratamentos foram aplicados: (i) completo (N, P, K, Zn, Cu, B, Mo e calagem); (ii) omissão de N, P e K; (iii) omissão de Zn, Cu, B e Mo; (iv) omissão de K; (v) omissão de Zn; (vi) omissão de calagem; (vii) controle. As amostras de solo foram coletadas nas profundidades de 0-5, 5-10, 10-20, 20-40 e 40-60 cm, simultaneamente às amostras de serapilheira. Foram coletadas amostras de acículas do primeiro e segundo lançamentos. A calagem induziu ao aumento do pH, Ca2+ e Mg2+ no solo, ocorrendo o oposto com os teores de Al3+ e saturação por Al. A adubação promoveu incremento nos teores de K+ no solo, serapilheira e acículas. Não ocorreu variação nas concentrações de Ca e Mg nas acículas em relação aos tratamentos.
Palavras-chave: deficiência nutricional, reflorestamento, serapilheira, reação no solo, acidificação.
Introduction
Commercial pine plantations in southern Brazil generally show fast growth and no visual nutrient deficiency symptoms, which has led to the idea that these species could grow without liming and fertilisation (FERREIRA et al., 2001; REISSMANN; ZÖTTL, 1987; REISSMANN; WISNIEWSKI, 2004). This assumption has continued amongst most growers, as the majority of pine plantations do not receiving any fertiliser or lime application.
Since the commercial plantations were introduced, the planted areas have been spread over a wide range of vegetation types, climates and
geological and soil classes within a characteristic subtropical pattern. The expansion over the highly weathered soils of the Cerrado (Brazilian savannah) has tested the ability of commercial pine species to grow under very low levels of exchangeable bases and highly acidic soils. Under this natural condition,
Pinus caribaea showed nutritional imbalances in some
pine planting cycles without the replacement of exported nutrients. Therefore, nutrient deficiency problems are expected to increase with time, especially in the low-nutrient soils of the Cerrado.
In the last few decades, the negative effects of inadequate soil management in Brazilian areas of forest plantations have been investigated and highlighted (CHAVES; CORREA, 2005; LILIENFEIN et al., 2000; REISSMANN; ZÖTTL, 1987) As reported in more recent trials, significant increases in productivity due to lime and fertiliser applications have been observed in coniferous forests (FERREIRA et al., 2001). However, according to Brito et al. (1986) Pinus caribeae forests planted in soils treated with liming and macronutrients showed increasing growth-ring mass production up to the third year; but opposite results were obtained with older trees. Reduced productivity and nutrient deficiencies in forest plantations in Germany, France and Norway have been investigated since the 1950's. Positive responses in wood production to liming and fertilisation (N, P, K) with reduced plant deficiency symptoms have been observed (HÜTTL, 1989). However, according to a survey done by Hüttl and Zöttl (1993), several factors must be taken into consideration before the recommendation of liming and fertilisation, as the negative effects may outweigh the benefits, especially the leaching of large amounts of NO3-.
Litter plays a key role in forest ecosystems, affecting soil protection and nutrient cycling. Several studies in southern Brazil have attempted to find relationships between litter quality and quantity and pinus yield (SCHUMACHER et al., 2008; VIERA; SCHUMACHER, 2010). Also, plant needle chemical analysis may be an interesting tool to evaluate pine nutrition and its demand for nutrients (ZÖTTL; TSCHINKEL, 1971). However, Chaves and Correa (2005) could not find clear evidence of nutrient imbalances using needle chemical analysis.
The aim of this study was to characterise the effect of superficial liming and mineral fertilisation on soil acidity, on soil K+, Ca2+ and Mg2+ dynamics
and on K, Ca and Mg concentrations in litter and pine needles in two five-year-old Pinus taeda plantations with severe nutrient deficiency visual symptoms.
Material and methods
Characterisation of the site
The experiment was performed in two selected areas of Pinus taeda commercial plantations of the Forest Value Company, located at Jaguariaíva county
(area I) (24o 13’ 29.13” S latitude and 49o 36’
21.12” W longitude) and Arapoti county (area II) (24o 18’ 56.72” S latitude and 49o 44’ 13.16” W
longitude). The areas are situated in the second high plain of Paraná State, Brazil (960 to 1,320 m above sea level), where the soil parent material is derived from the geological sandstone formation of Itararé and Furnas. The vegetation was predominantly Cerrado (savannah) and was gradually replaced by forest plantations, agriculture and livestock (MELLO et al., 2003). Soil samples were collected and analysed in each area near the pinus plantation for the main physical and chemical characteristics (Table 1).
Table 1. Soil chemical analysis and particle size determination in samples from areas I (Jaguariaíva) and II (Arapoti), performed prior to treatments.
Depth pH CaCl2
pH SMP Al
3+ H +
Al3+ Ca 2+
Mg2+
K+
SB2
P
cm cmolc kg
-1 mg dm-3
Area I
0-20 3.83 4.98 2.70 10.88 0.38 0.20 0.05 0.63 6.38 20-40 4.08 5.40 1.70 7.85 0.28 0.10 0.03 0.41 3.23 40-60 4.10 5.53 1.60 7.13 0.25 0.10 0.03 0.38 1.93
Area II
0-20 3.85 5.65 1.25 6.45 0.15 0.06 0.03 0.24 0.38 20-40 4.00 5.88 0.88 5.50 0.15 0.10 0.02 0.27 0.18 40-60 4.05 5.93 0.75 5.30 0.14 0.08 0.02 0.25 0.10
Depth CEC
1 effective
CEC
potential
O.M.3 m4 V5 Sand Silt Clay Textural
class cm cmol kg-1 % g kg-1
Area I
0-20 3.33 11.5 5 81 6 833 80 87 sandy 20-40 2.11 8.26 4 81 5 827 83 90 sandy 40-60 1.98 7.50 3 81 5 812 108 80 sandy
Area II
0-20 1.49 6.69 3 84 4 734 26 240 medium 20-40 1.14 5.77 2 77 5 713 50 237 medium 40-60 1.00 5.55 2 75 4 684 66 250 medium
1Cation Exchange capacity. 2Sum of Bases. 3Organic matter. 4Al saturation. 5Base saturation.
The regional climate is classified as subtropical (Cfa) transitioning to tropical (Cfb), according to Köppen. The average annual rainfall and temperature vary between 1,440 and 1,600 mm and 17 and 19ºC, respectively. The winter is usually dry with low rainfall and occurrence of frost.
Experimental design
Prior to this planting of Pinus taeda, currently at the second rotation, there was a Eucalyptus sp. plantation that, in turn, replaced the native cerrado vegetation. The two tree species were cultivated without liming and fertilisation. Before the current rotation, both areas were burnt after harvest. In the spring of 2008, both pinus plantations were pruned to a 2.0 m height using a manual saw, and the pruned material was left on the ground.
The experimental design consisted of randomised complete blocks with seven treatments and four replications. The experimental unit (plot) consisted of eight lines, each line with eight plants, totalling 64 plants in an area of 384 m2. All areas
together represent a total area of 10,752 m2
(approximately 1 ha). The central 16 plants of each plot were considered for measurement and analysis.
The first fertiliser application occurred in October 2008 and the second in January 2010. The fertiliser inputs per 1 ha were: 40 kg nitrogen (89 kg urea, 45% N), 60 kg P2O5 (146 kg triple
superphosphate, 41% P2O5), 80 kg K2O (133 kg KCl,
60% K2O), 3 kg zinc (20 kg ZnSO4, 15% Zn), 2 kg
boron (20 kg ulexite, 10% of B), 2 kg copper (8.3 kg CuSO4, 24% Cu), and 20 g molybdenum
(61 g Na2MoO4, 39% Mo).
Lime (1.3 Mg ha-1) was manually broadcasted
over litter after fertiliser application. The applied lime quantity was calculated to supply approximately 500 kg Ca, which is the amount exported by Pinus sp. in two cycles. The limestone used presented the following characteristics: CaO = 28.9%; MgO = 19.9%; NP (neutralisation power) = 99.4%; RE (reactivity efficiency) = 90%; and RPTN (relative power of total neutralisation) = 89.4%.
To diagnose the nutrient disorders, the following treatments with the omission of nutrients were adopted: (i) complete - application of all nutrients [N, P, K, Zn, Cu, B, Mo, Ca + Mg (dolomitic lime)]; (ii) without macro: application of nutrients without the macronutrients N, P, K; (iii) without micro: application of nutrients without the micronutrients Zn, Cu, B and Mo; (iv) without K: application of nutrients without K; (v) without Zn: application of nutrients without Zn; (vi) without lime: application of all nutrients except for lime (Ca + Mg); and (vii) control: no fertiliser or lime addition.
Sampling and soil analysis
The soil and litter sampling were performed in the same place at the same time. The soil samples were collected at the following depths: 0-5, 5-10, 10-20, 20-40, and 40-60 cm. The soil samples were air dried at room temperature, ground and sieved. Chemical
analyses were performed according to the method of Embrapa (1997) for the determination of the following: active acidity (pH in 0.01 mol L-1 CaCl
2
solution); potential exchangeable acidity (Al3+),
extracted with a 1 mol L-1 KCl solution and
determined by titration with a 0.2 mol L-1 NaOH
solution; exchangeable Ca2+ and Mg2+ extracted with a
1 mol L-1 KCl solution and determined by atomic
absorption spectrometry; and exchangeable K+
extracted with Mehlich I and determined by flame photometry.
Sampling and analysis of litter and plants
Litter samples were collected from each plot and separated in Ln and La subsamples, according to Babel’s (1972) definition: Ln (new litter) is composed of freshly fallen needles, and La (aged litter) consists of needles at the beginning of decomposition. Four points were randomly chosen within the plots. The litter was then marked by a wooden frame of 0.25 x 0.25 m, cut using a blade and removed. The material was collected in August 2010.
The needle samplings were conducted in November 2009 and December 2010. In each plot, five dominant trees were selected, which is equivalent to one hundred trees per hectare with a larger diameter at breast height (DBH). The needle samples were collected from the first and second releases (the second whorl) of the top at the north face.
The samples were dried in a forced-air oven at 60°C up to constant weight and were weighed and ground in a Willey type mill. Then, 1 g was submitted to dry digestion in a muffle furnace at 500°C, and the ashes were suspended in 10 mL of a 3 mol L-1 HCl
solution, according to method described by Martins and Reissmann (2007). The concentrations of Ca and Mg were determined by atomic absorption spectrophotometry, while the concentration of K was determined by flame photometry.
Statistical analysis
The experiment was arranged in a completely randomised design. All the data reported are average values of four replicates. The data were statistically evaluated using ANOVA, and significant differences between means were compared with the Tukey test normal distribution (p < 0.05). The statistical analyses were performed using Assistat 7.9 (SILVA, 2012).
Results and discussion
Influence of liming and fertilisation on pH and levels of Al3+ in soil
values at a 0-5 cm depth were 3.03 and 3.18 for areas I and II, respectively (Table 2).
Table 2. Values of pH (in 0.01 mol dm-3 CaCl
2 solution),
exchangeable Al3+ and Al saturation in soil samples from
Jaguariaíva (Area I) and Arapoti (Area II), collected from five soil layer depths, in response to application of lime and fertilizer.
pH Al3+ m1
Soil depth Treatments Area IArea II Area I Area IIArea IArea II
cm cmolc kg-1 %
0-5
Complete 4.07ab 3.76ab 0.65b 1.35b 11b 42b
Without macro 4.07ab 3.67ab 0.63b 1.48b 14b 57ab
Without micro 3.82bc 4.09a 0.73b 0.98b 16b 34b
Without K 4.15ab 3.75ab 0.50b 1.20b 9b 49b
Without Zn 4.74a
3.73ab
0.15b
1.38b
2b
43b
Without lime 3.20cd
2.95b
2.38a
2.85a
73a
78a
Control 3.03d
3.18ab
2.55a
2.43a
86a
92a
5-10
Complete 3.74ab 3.83a 1.35ab 1.05b 44bc 51ab
Without macro 4.36a 3.74ab 1.18b 1.30ab 39c 65ab
Without micro 3.85ab 3.96a 1.40ab 0.93b 48abc 37b
Without K 3.80ab 3.78ab 1.38ab 1.33ab 45bc 58ab
Without Zn 4.05ab
3.76ab
1.18b
1.20ab
41c
53ab
Without lime 3.43b
3.14b
2.18a
2.28a
77ab
88a
Control 3.41b
3.44ab
2.00ab
1.88ab
81a
92a
10-20
Complete 3.70a 3.84a 1.68a 1.05a 78a 77a
Without macro 3.72a 3.90a 1.55a 0.93a 72a 86a
Without micro 3.75a 3.94a 1.68a 0.88a 77a 78a
Without K 3.67a 3.88a 1.63a 1.00a 81a 86a
Without Zn 3.89a
3.86a
1.63a
0.93a
71a
84a
Without lime 3.71a
3.67a
1.93a
1.23a
79a
90a
Control 3.66a
3.77a
1.73a
0.95a
81a
94a
20-40
Complete 3.57a 3.91a 1.70 a 0.93 a 79 a 75 a
Without macro 3.73a 3.93a 1.65 a 0.83 a 80 a 80 a
Without micro 3.77a 3.91a 1.78 a 0.90 a 80 a 79 a
Without K 3.75a 3.89ab 1.50 a 0.88 a 79 a 83 a
Without Zn 3.90a 3.89ab 1.53 a 0.83 a 75 a 78 a
Without lime 3.78a
3.79b
1.80 a
0.98 a
79 a
79 a
Control 3.73a
3.84ab
1.55 a
0.90 a
80 a
87 a
40-60
Complete 3.76 a
3.93 a
1.73 a
0.88 a
82 a
78 a
Without macro 3.80 a 3.94 a 1.50 a 0.83 a 80 a 82 a
Without micro 3.78 a 3.78 a 1.78 a 0.93 a 81 a 81 a
Without K 3.78 a 3.80 a 2.00 a 0.80 a 83 a 83 a
Without Zn 3.93 a 3.93 a 1.65 a 0.83 a 79 a 81 a
Without lime 3.81 a 3.85 a 1.70 a 0.95 a 80 a 83 a
Control 3.75 a 3.92 a 1.60 a 1.00 a 81 a 85 a
1Al saturation. Stand parameters with no letters in common represent means that are
significantly different (p < 0.05).
Soil samples taken close to the experimental area and representing the same soil formation and supporting native vegetation showed similar pH values (Table 1). However, it is well known that pine plantations may acidify the soil (ALEXANDER; CRESSER, 1995; BRANDÃO; LIMA, 2002; INGERSLEV, 1997; LILIENTFEIN et al., 2000; SOUZA; SOUZA, 1981; PADUA et al., 2006).
The lime effect on soil pH was observed in both areas up to the 10 cm depth (Table 2). The results were highly satisfactory, considering the amount of low lime applied, the short period between applications and samplings and the high soil buffer capacity. Supporting this fast alteration under forestry conditions in Norway, Ingerslev (1997) showed changes in pH, Al, CEC and the sum of
bases up to a 35 cm depth after eight years of liming. Maeda et al. (2008), studying sandy soils in the state of Paraná, verified decreased soil acidity after one year of surface application of plant biomass ashes up to a 20 cm depth.
More significant changes in pH due to liming were found in area I (pH increased from 3.03 to 4.75) compared with area II (3.18 to 3.76). This result was not expected, as the highest soil potential acidity levels (H + Al) expressed by the buffering power were found in area I up to a 20 cm depth. Other differences between the two soils are the texture and organic matter content (Table 1). Such pH variation may be explained by the changes in exchangeable Al and Al saturation in the first 10 cm of the soil (Table 2).
Although pine species are considered tolerant to
Al3+ (ALEXANDER; CRESSER, 1995;
GONÇALVES, 1995; HÜTTL; ZÖTTL, 1993) some studies have clearly shown negative effects of the element on tree development (NOWAK; FRIEND, 2006).
Liming and fertilisation effects on the soil-exchangeable K+
, Ca2+
and Mg2+
concentrations
Lime application resulted in higher sum of bases (data not shown) and higher base saturation values (Table 3) within the 0-10 cm layer. The fertiliser alone did not significantly change SB compared with the control treatment. In addition to the direct effect of lime on neutralising exchangeable Al, the consequent pH rise also promotes deprotonation of the organic colloid and mineral surfaces, which are essential to increasing the soil CEC and base saturation.
The base availability under native conditions (Table 3) was far below the minimum recommended for agricultural crops (IAC, 1997) for both areas. The low available K concentration in the control treatment evidenced the poor primary mineral content in the source material (Furnas Sandstone and Itararé). The K application provided significant soil K increments up to the 20 and 40 cm depths for areas I and II, respectively, confirming the high mobility of the soil K. Although the applied amount of K fertiliser was not high, the combined effect of sandy texture, low effective CEC and high precipitation may explain the high K mobility. The present results are corroborated by other studies that showed close relationships between soil characteristics and nutrient movement. Frank and Stuanes (2003) obtained an increase in K+ levels up
Table 3. Values of soil K+, Ca2+ and Mg2+ concentrations, effective CEC and base saturation (V%) in samples from Jaguariaíva (area I)
and Arapoti (area II), at five soil layer depths in response to application of lime and fertilizer.
K+
Ca2+
Mg2+
CECeffective V 1
Soil depth Treatment Area I Area II Area I Area II Area I Area II Area I Area II Area I Area II
cm cmolc kg
-1 cmol
c kg
-1 %
0-5
Complete 0.17 ab 0.12 ab 2.19 a 1.29 a 3.33 a 1.24 ab 6.34 a 4.00 a 51 ab 24 ab
Without macro 0.03 c 0.04 b 1.41 ab 0.45 b 2.92 a 0.69 ab 4.98 ab 2.50 a 45 ab 17 ab
Without micro 0.13 abc 0.10 ab 1.44 ab 1.26 a 2.55 a 1.38 a 4.85 ab 3.75 a 42 b 34 a
Without K 0.07 bc 0.04 b 1.78 ab 0.85 ab 2.86 a 0.86 ab 5.22 ab 3.25 a 47 ab 27 ab
Without Zn 0.19 a 0.16 a 2.38 a 0.88 ab 3.96 a 0.94 ab 6.67 a 3.25 a 61 a 26 a
Without lime 0.14 abc 0.13 ab 0.47 bc 0.65 b 0.21 b 0.51 ab 3.19 b 4.14 a 11 c 13 ab
Control 0.03 c 0.04 b 0.22 c 0.09 c 0.16 b 0.05 b 2.96 b 2.61 a 4 c 2 b
5-10
Complete 0.15 a
0.11 a
0.59 a
0.52 ab
1.04 ab
0.53 ab
3.13 a
2.21 a
25 ab
16 ab
Without macro 0.03 b
0.03 b
0.63 a
0.28 ab
1.46 a
0.40 ab
3.29 a
2.02 a
29 a
12 ab
Without micro 0.08 ab 0.09 ab 0.53 ab 0.85 a 1.04 ab 0.95 a 3.05 a 2.81 a 25 ab 27 a
Without K 0.03 b 0.03 b 0.63 a 0.50 ab 1.15 ab 0.50 ab 3.17 a 2.35 a 26 ab 15 ab
Without Zn 0.15 a 0.13 a 0.75 a 0.49 ab 1.25 ab 0.51 ab 3.33 a 2.32 a 31 a 18 ab
Without lime 0.11 ab 0.12 a 0.31 b 0.18 b 0.21 b 0.06 b 2.80 b 2.63 a 10 ab 4 b
Control 0.03 b 0.03 b 0.22 b 0.08 b 0.21 b 0.05 b 2.45 b 2.03 a 7 b 2 b
10-20
Complete 0.09 a 0.09 a 0.22 a 0.27 a 0.16 a 0.21 a 2.14 a 1.61 a 25 a 12 a
Without macro 0.02 b 0.07 ab 0.25 a 0.16 ab 0.31 a 0.11 ab 2.14 a 1.25 ab 29 a 9 a
Without micro 0.07 ab
0.07 ab
0.22 a
0.22 ab
0.21 a
0.19 ab
2.17 a
1.35 ab
25 a
12 a
Without K 0.01 b
0.02 b
0.16 a
0.17 ab
0.21 a
0.13 ab
2.00 a
1.31 ab
26 a
7 a
Without Zn 0.10 a
0.09 a
0.22 a
0.17 ab
0.31 a
0.10 ab
2.26 a
1.27 ab
31 a
8 a
Without lime 0.11 a 0.08 a 0.19 a 0.10 bc 0.21 a 0.05 b 2.43 a 1.45 ab 10 a 5 a
Control 0.02 b 0.02 b 0.19 a 0.09 c 0.21 a 0.05 b 2.14 a 1.10 b 7 a 6 a
K+ Ca2+ Mg2+ CEC
effective V(1)
Soil depth Treatment Area I Area II Area I Area II Area I Area II Area I Area II Area I Area II
cm cmolc kg
-1
cmolc kg
-1
%
20-40
Complete 0.08 a 0.07 ab 0.16 a 0.16 a 0.21 a 0.08 a 2.14 a 1.24 a 11 a 10 a
Without macro 0.01 ab 0.01 b 0.22 a 0.14 a 0.21 a 0.06 ab 2.08 a 1.03 a 8 a 6 a
Without micro 0.05 ab
0.05 ab
0.19 a
0.13 a
0.21 a
0.07 ab
2.22 a
1.14 a
8 a
6 a
Without K 0.01 ab 0.01 b 0.19 a 0.12 a 0.21 a 0.06 ab 1.90 a 1.05 a 8 a 5 a
Without Zn 0.07 ab 0.07 ab 0.22 a 0.12 a 0.21 a 0.05 ab 2.02 a 1.07 a 10 a 6 a
Without lime 0.05 ab 0.11 a 0.22 a 0.09 a 0.21 a 0.05 ab 2.27 a 1.22 a 10 a 6 a
Control 0.00 b 0.01 ab 0.19 a 0.09 a 0.21 a 0.03 b 1.95 a 1.03 a 7 a 4 a
40-60
Complete 0.02 ab
0.05 ab
0.16 a
0.14 a
0.21 a
0.06 a
2.11 ab
1.13 a
9 a
7 a
Without macro 0.01 ab 0.05 a 0.16 a 0.13 a 0.21 a 0.06 a 1.87 b 1.01 a 7 a 6 a
Without micro 0.04 a 0.06 a 0.16 a 0.12 a 0.21 a 0.06 a 2.17 ab 1.16 a 8 a 6 a
Without K 0.01 ab
0.05 a
0.19 a
0.11 a
0.21 a
0.05 a
2.40 a
0.96 a
9 a
5 a
Without Zn 0.03 ab 0.06 a 0.19 a 0.11 a 0.21 a 0.04 a 2.07 ab 1.03 a 7 a 6 a
Without lime 0.02 ab 0.07 a 0.19 a 0.08 a 0.21 a 0.04 a 2.12 ab 1.14 a 9 a 5 a
Control 0.00 b
0.07 a
0.16 a
0.07 a
0.21 a
0.04 a
1.96 b
1.18 a
6 a
6 a
1V = Base saturation. Stand parameters with no letters in common represent means that are significantly different (p < 0.05).
Available Ca concentration increments were observed up to the 5 cm (area I) and 20 cm (area II) layers (Table 3). The Ca availability increased below a 5 cm depth for area II, suggesting a higher mobility under this condition than area I. The low Ca backgrounds indicated the influence of broadcast lime application, the observed Ca increases can be considered low. By comparing the complete treatment to that without macronutrients and without lime to control, it was possible to verify that fertiliser enhanced Ca availability in the 0-5 cm layers. This result was not expected, as the only extra source of Ca was triple superphosphate, with approximately 10% of Ca [Ca (H2PO4)2 . 2H2O];
that is, the Ca input was much smaller than that of lime. The Ca increment difference between soil areas was not expected either, as both received the same amount of lime, but a higher available Ca concentration was found in area I than area II.
Ingerslev (1997), after eight years of limestone application in an area with conifers, found
differences in the soil Ca2+ and Mg2+ concentrations
up to a 35 cm depth. Frank and Stuanes (2003), in a four-year study, observed increased Ca2+
concentrations up to a 22 cm depth in sandy soils under coniferous planting. This result can be compared with this research, as the differences were significant up to the 20 cm depth, in less than two years.
Significant effects of lime application on available Mg2+ concentrations were also observed
It is important that there was a greater increase in Mg2+ than in Ca2+ concentrations with soil profile
depth, despite the two nutrients being derived from the same corrective. According to Hüttl and Zöttl (1993), when both nutrients come from dolomitic lime, as in the present study, the Mg2+ is generally
more available than Ca2+, which may be explained
by the higher MgCO3 (0.106 g L-1) solubility than
CaCO3 (0.014 g L-1) in the limestone (the first is 7.6
times more soluble).
The symptoms of Mg2+deficiency in forest
plantations and the study of appropriate rates of Mg fertiliser have been investigated since the 1980s in various regions of Germany (EVERS; HÜTTL, 1990; HÜTTL, 1989; HÜTTL; ZÖTTL, 1993; UEBEL; HEINSDORF, 1997). In a review paper on conifer plantations in Germany, Hüttl and Zöttl (1993) concluded that the application of Mg2+
through liming was effective at increasing the Mg level in the soil and reversing the nutrient deficiency symptoms. However, Uebel and Heinsdorf (1997), studying the application of fertilisers containing Mg2+ and K+ in sandy soils under Pinus sp.,
observed no significant improvement in the two nutrient availability levels in the soil, despite the increased productivity. Nevertheless, the Mg2+
dynamics in soils under forest plantations are still unknown, and there are few answers about its addition to the soil, especially in soils under coniferous plantations in regions with warmer climates.
The responses achieved in the present study allow inferring that changes in the levels of K+, Ca2+
and Mg2+ observed at even the most superficial
depths (less than 10 cm) are important. The finest roots, responsible for most nutrient absorption, occupy the first 20 cm, including litter or the organic horizon. Thus, the surface application of fertilisers in forest areas can be considered an excellent procedure to correct low nutrient levels in the soil, even in established plantings.
Distribution of K+, Ca2+ and Mg2+ in the new litter (Ln) and aged litter (La) in response to liming and fertilisation
The low K+, Ca2+, and Mg2+ concentrations
found in the litter from the control treatment (Table 4) confirmed their low availability in the biogeochemical cycle of the studied areas. The obtained values were lower than those observed by Brum (1980) in Pinus elliottii plantations in northern Santa Catarina. Brum (1980) reported K+ and Ca2+
levels of approximately 0.6 and 2.5 g kg-1,
respectively. Even more expressive differences are observed in comparison with the data reported by Viera and Schumacher (2010), who found Ca2+
concentrations of 7.88 g kg-1 in the litter of Pinus
taeda grown in basaltic soils of Rio Grande do Sul
State.
Table 4. Concentrations of K+, Ca2+, and Mg2+ in thenew litter
(Ln) and aged litter (La) from Jaguariaíva (area I) and Arapoti (area II), in response to application of lime and fertilizers.
K Ca Mg
Treatment Ln La Ln La Ln La
Area I
g kg-1
Complete 1.18 a 0.53 ab 1.95 a 20.46 a 1.23 ab 8.90 a
Without Macro 0.38 b 0.25 c 2.45 a 17.82 a 1.64 a 9.97 a
Without micro 0.83 ab
0.45 abc
2.25 a
18.51 a
1.23 ab
10.13 a
Without K 0.50 b 0.40 abc 2.39 a 13.38 a 1.50 ab 6.68 b
Without Zn 1.13 a 0.43 abc 1.80 a 19.81 a 1.35 ab 7.43 a
Without lime 1.08 a
0.58 a
1.23 a
2.79 b
0.55 b
0.30 b
Control 0.35 b 0.33 bc 1.33 a 1.28 b 0.76 a 0.40 b
Área II
Complete 1.20 a 0.60 abc 2.45 ab 18.29 a 1.08 ab 8.81 a
Without Macro 0.30 b
0.28 cd
2.41 ab
13.35 abc
1.18 a
7.83 a
Without micro 1.23 a 0.60 abc 1.58 abc 16.97 ab 0.78 abc 8.72 a
Without K 0.45 b 0.40 bcd 2.84 a 8.86 abc 1.19 a 5.43 ab
Without Zn 1.33 a
0.83 a
1.55 abc
6.93 abc
0.69 abc
4.46 ab
Without lime 1.33 a 0.70 ab 0.83 bc 1.19 c 0.41 bc 0.34 b
Control 0.35 b 0.25 d 0.48 c 3.01 bc 0.33 c 1.75 b Stand parameters with no letters in common represent means that are significantly different (p < 0.05).
The results (Table 4) indicate a distinct behaviour between the K+ and Ca2+ plus Mg2+ concentrations in
the litter from the same treatment. Thus, the litter samples from the complete treatment showed higher K+ levels in more recently fallen needles (Ln) than
aged needles (La), suggesting K leaching by rainfall. However, the low-litter K concentrations were found in the litter samples from treatments without the addition of macronutrients or K and control, and the expected decrease in aged-needle K concentrations was either unclear or did not happen.
In the complete treatment, however, significantly lower concentrations of Ca2+ were observed in the new
litter, Ln (1.95 and 2.45 g kg-1, in areas I and II,
respectively), than in the aged litter, La (20.46 and 18.29 g kg-1, in areas I and II, respectively). Similar
results were obtained for Mg2+:1.23 and 1.08 g kg-1 for
Ln in areas I and II, respectively, and 8.90 and 8.81 for g kg-1 for La in areas I and II, respectively. The increase
observation during the litter sampling. Another hypothesis is that part of lime reacted but that the released Ca and Mg remained bound to the litter exchange sites, becoming unavailable.
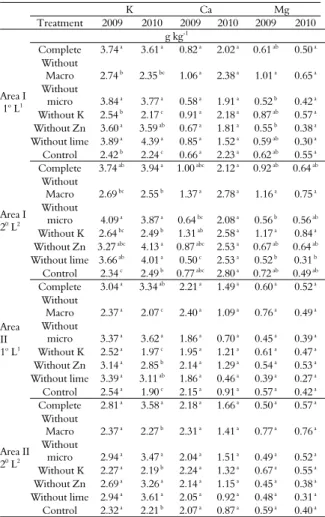
Effect of treatments on the needle K+, Ca2+, and Mg2+ concentrations in the first and second flushes during the years 2009 and 2010
A clear positive effect of K fertiliser on the needle K concentration was observed for both flushes and years at area I (Table 5). At area II, this effect was significant for the year 2010. These results confirm the soil K availability enhancement (Table 2). Also, lime omission resulted in higher needle K concentration in the first flush at area I due to the antagonic effect of increased Ca and Mg on decreasing K uptake by pine plants.
Table 5. Concentrations of K+, Ca2+ and Mg2+ in the first and
second needle flushes, at Jaguariaíva (area I) and Arapoti (area II), during 2009 and 2010, in response to lime and fertilizer application.
K Ca Mg
Treatment 2009 2010 2009 2010 2009 2010
g kg-1
Area I 1o L1
Complete 3.74 a 3.61 a 0.82 a 2.02 a 0.61 ab 0.50 a
Without
Macro 2.74 b 2.35 bc 1.06 a 2.38 a 1.01 a 0.65 a
Without
micro 3.84 a 3.77 a 0.58 a 1.91 a 0.52 b 0.42 a
Without K 2.54 b 2.17 c 0.91 a 2.18 a 0.87 ab 0.57 a
Without Zn 3.60 a 3.59 ab 0.67 a 1.81 a 0.55 b 0.38 a
Without lime 3.89 a 4.39 a 0.85 a 1.52 a 0.59 ab 0.30 a
Control 2.42 b
2.24 c
0.66 a
2.23 a
0.62 ab
0.55 a
Area I 20 L2
Complete 3.74 ab 3.94 a 1.00 abc 2.12 a 0.92 ab 0.64 ab
Without Macro 2.69 bc
2.55 b
1.37 a
2.78 a
1.16 a
0.75 a
Without
micro 4.09 a 3.87 a 0.64 bc 2.08 a 0.56 b 0.56 ab
Without K 2.64 bc 2.49 b 1.31 ab 2.58 a 1.17 a 0.84 a
Without Zn 3.27 abc
4.13 a
0.87 abc
2.53 a
0.67 ab
0.64 ab
Without lime 3.66 ab 4.01 a 0.50 c 2.53 a 0.52 b 0.31 b
Control 2.34 c 2.49 b 0.77 abc 2.80 a 0.72 ab 0.49 ab
Area II 1o L1
Complete 3.04 a
3.34 ab
2.21 a
1.49 a
0.60 a
0.52 a
Without
Macro 2.37 a 2.07 c 2.40 a 1.09 a 0.76 a 0.49 a
Without
micro 3.37 a 3.62 a 1.86 a 0.70 a 0.45 a 0.39 a
Without K 2.52 a 1.97 c 1.95 a 1.21 a 0.61 a 0.47 a
Without Zn 3.14 a 2.85 b 2.14 a 1.29 a 0.54 a 0.53 a
Without lime 3.39 a 3.11 ab 1.86 a 0.46 a 0.39 a 0.27 a
Control 2.54 a 1.90 c 2.15 a 0.91 a 0.57 a 0.42 a
Area II 20 L2
Complete 2.81 a 3.58 a 2.18 a 1.66 a 0.50 a 0.57 a
Without
Macro 2.37 a 2.27 b 2.31 a 1.41 a 0.77 a 0.76 a
Without
micro 2.94 a 3.47 a 2.04 a 1.51 a 0.49 a 0.52 a
Without K 2.27 a 2.19 b 2.24 a 1.32 a 0.67 a 0.55 a
Without Zn 2.69 a 3.26 a 2.14 a 1.15 a 0.45 a 0.38 a
Without lime 2.94 a 3.61 a 2.05 a 0.92 a 0.48 a 0.31 a
Control 2.32 a 2.21 b 2.07 a 0.87 a 0.59 a 0.40 a
1
First flush. 2
Second flush. Stand parameters with no letters in common represent means that are significantly different (p < 0.05).
However the observed K values were lower than the average K concentration (6 g kg-1) suggested as
adequate for pine trees by several authors (REISSMANN; WISNIEWSKI, 2004; VOGEL, 2003). Apparently, K fertilisation was not enough to reach the satisfactory value (6.0 g kg-1), despite the
high soil K concentration observed in the 0-20 cm layer. Nevertheless, the abovementioned authors indicated an adequate K concentration for pine trees without taking into consideration the sampling time and species. Chaves and Correa (2005) found no K deficiency symptoms in Pinus caribeae with needle K of 3.8 mg kg-1.
Although many authors did not relate K+ with
yield (CHAVES; CORRÊA, 2005; HÜTTL; ZÖTTL, 1993), studies with Pinus sp. in the second plateau of Paraná, indicated that K is one of the most growth-limiting nutrients (REISSMANN; WISNIEWSKI, 2004). The present results indicate that more research is needed to better evaluate the effects of K on pinus nutrition and development. However, a low needle K concentration in the control treatment and a consistent increasing needle K concentration in fertilised treatments were observed. These results suggest that there must be concern over pinus tree demand for K and that this nutrient may be responsible for the deficiency symptoms observed in the field.
Reissmann and Wisniewski (2004) observed higher demand for K+ than for Ca2+ in this species.
The authors concluded that plots with poor quality soil showed K Ca-1 ratios close to 1, while the best
areas showed K Ca-1 ratios above 3. In this study, the
K Ca-1 ratios were observed to be close to 1, except
for some results where the ratios approached 3 in response to the treatments. Low ratios confirmed plant K deficiency.
In contrast, significant differences in the Ca concentrations appeared only in the second flush in 2009 (Table 5), despite their increase in the superficial soil layer (Table 3).
In some samples, the needle Ca concentration was below 1.0 or 1.5 g kg-1, values that are
considered adequate for pine trees by Zöttl and Tschinkel (1971) and Allen (1987), respectively. However, the needle Ca concentration was above 1 g kg-1 in the control treatment, where the natural
soil Ca2+ levels were very low, indicating the
influence of other factors on Ca uptake by pine trees. Furthermore, Chaves and Corrêa (2005), studying plantations of Pinus caribeae in the Cerrado of Minas Gerais State, Brazil, found visual symptoms of mineral deficiency followed by early death in plants with Ca2+ ranging from 0.1 to
0.2 g kg-1. Meanwhile normal plants showed needle
Ca concentrations ranging from 0.6 to 2.0 g kg-1.
research do not allow certainty that the Ca deficiency occurred under this experimental condition.
The needle Mg concentrations obtained in this study were consistently lower than 0.8 and 0.6 g kg-1,
values indicated as adequate for pine trees by Zöttl and Tschinkel (1971) and Reismann and Wisniewski (2004), respectively. Significant differences for this nutrient were only observed in area I. The highest needle Mg2+ concentration was observed in the first
and second flushes in the plots without macro in 2009 and in the second flush in 2010 (Table 5). The K omission in this treatment may have contributed to the increased Mg2+ absorption. The needle
chemical analysis confirmed the low Mg concentrations previously observed in the soil and litter samples, indicating that Mg deficiency was much more plausible than Ca in this study.
In general, there was close agreement between the first and second needle flushes for predicting Ca, Mg and K nutritional status. The large and irregular span between years for the Ca results did not allow a conclusion to be made, and further studies are required. The distinct movements of nutrients in plant tissues evidenced the well-known high K and Mg mobility in the plants compared with Ca (REISSMANN; WISNIEWSKI, 2004), which explains the high K/Ca ratio in young tissues.
The present results indicate that low levels of soil exchangeable bases, high acidity and Al3+ saturation
were partially corrected in a short-term experiment with Pinus taeda plantations. However, more research is needed and long-term experiments must be performed to better evaluate the effects of increasing fertilisation and liming rates on both soil and plant nutrient concentrations. Specific lime and fertiliser calibration curves for pine forest plantations should be investigated to ensure the maximum positive effects of this type of crop management in pine tree productivity.
Conclusion
Potassium concentration increments in soils, plants and litter were more evident than those of other macronutrients in response to fertilisation. These responses suggest that surface fertilisation may be effective to correct K disorders in pine trees. However, the same cannot be said for Ca and Mg, as their needle concentrations showed irregular responses to the treatments.
There is no doubt about the need to provide nutrients via liming and fertilisation, even in forest plantations. This management is essential to maintaining the quality of soils and plants. However, more studies such as analysis of height
increments and diameter are essential to evaluate the efficiency of liming and fertilisation on reversing the nutritional deficiency and improving the low growth rates in sites with these kinds of problems. A long period between application and sampling is needed for a more accurate conclusion.
Acknowledgements
We thank Valor Florestal, and its technicians Renato Teixeira Lima, Antônio Esteves Lemes and Fabiana Vargas Reis for their support. We also thank to professor Angela Furlani for helping us in translating the material, the researcher Edilson Batista de Oliveira for all the help in this search and even the Federal University of Paraná for all support to achieve work.
References
ALEXANDER, C. E.; CRESSER, M. S. An assessment of the possible impact of expansion of native woodland on the chemistry of Scottish freshwater. Forest Ecology Management, v. 73, n. 1, p. 1-27, 1995.
ALLEN, H. L. Forest fertilizers: nutrient amendment, stand productivity and environmental impact. Journal of Forestry, v. 85, n. 2, p. 37- 46, 1987.
BABEL, U. Moderprofile in waldern. Ulmen: Stuttgart, 1972.
BRANDÃO, S. L.; LIMA, S. C. pH e condutividade elétrica de Pinus e cerrado na Chapada, em Uberlândia (MG). Caminhos de Geografia, v. 3, n. 1, p. 46-54, 2002.
BRITO, J. O.; FERRAZ, E. S. B.; BARRICHELO, L. E.; COUTO, H. T. Z. A adubação mineral e seus efeitos sobre os anéis de crescimento da madeira de Pinus caribaea VAR. bahamensis. IPEF, v. 32, n. 1, p. 5-17, 1986.
BRUM, E. Composição química de acículas verdes e da litteira de Pinus elliottii Engelm. Revista Floresta, v. 11, n. 1, p. 17-23, 1980.
CHAVES, R. Q.; CORRÊA, G. F. Macronutrientes no sistema solo - Pinus caribaea Morelet em plantios apresentando amarelecimento das acículas e morte das plantas. Revista Árvore, v. 29, n. 5, p. 691-700, 2005. EMBRAPA-Empresa Brasileira de Pesquisa Agropecuária. Manual de análises químicas de solos, plantas e fertilizantes. Brasília: Embrapa Comunicação para Transferência de Tecnologia, 1997.
EVERS, F. H.; HÜTTL, R. F. A new fertilization strategy in declining forests. Water, Air and Soil Pollution, v. 54, n. 1, p. 495-508, 1990.
FERREIRA, C. A.; SILVA, H. D.; REISSMANN, C. B.; BELLOTE, A. F. J.; MARQUES, R. Nutrição de Pinus
no sul do Brasil, diagnóstico e prioridades de pesquisa. Colombo: Embrapa Florestas, 2001.
Norway. Forest Ecology Management, v. 176, n. 1-3, p. 371-386, 2003.
GONÇALVES, J. L. M. Recomendações de adubação para Eucalyptus, Pinus e espécies típicas da Mata Atlântica. Documentos Florestais, v. 15, n. 1, p. 1-23, 1995. HÜTTL, R. F. Liming and fertilization as mitigation tools in declining forest ecosystems. Water, Air and Soil Pollution, v. 44, n. 1, p. 93-118, 1989.
HÜTTL, R. F.; ZÖTTL, H. W. Liming as a mitigation tool in Germany’s declining forests- reviewing results from former and recent trials. Forest Ecology Management, v. 61, n. 3-4, p. 325-338, 1993.
IAC-Instituto Agronômico de Campinas. Recomendação de adubação e calagem para o Estado de São Paulo. Campinas: Instituto Agronômico; Fundação IAC, 1997.
INGERSLEV, M. Effects of liming and fertilization on growth, soil chemistry and soil water chemistry in a Norway spruce plantation on a nutrient-poor soil in Denmark. Forest Ecology Management, v. 92, n. 1, p. 55-66, 1997.
LILIENFEIN, W. W.; AYARZA, M. A.; VILELA, L.; LIMA, S. C.; ZECH, W. Soil acidification in Pinus caribaea forests on Brazilian savanna Oxisols. Forest Ecology Management, v. 73, n. 1, p. 1-27, 2000.
MAEDA, S.; SILVA, H. D.; CARDOSO, C. Resposta de Pinus taeda à aplicação de cinza de biomassa vegetal em Cambissolo Húmico, em vaso. Pesquisa Florestal Brasileira, v. 56, n. 1, p. 43-52. 2008.
MARTINS, A. P. L.; REISSMANN, C. B. Material vegetal e as rotinas laboratoriais nos procedimentos químico-analíticos. Scientia Agraria, v. 8, n. 1, p. 1-17, 2007.
MELLO, M. S.; MORO, R. S.; GUIMARÃES, G. B. Patrimônio natural dos campos gerais. Ponta Grossa: UEPG, 2003.
NOWAK, J.; FRIEND, A. Loblolly pine and slash pine responses to acute aluminum and acid exposures. Tree Physiology, v. 26, n. 9, p. 1207-1215, 2006.
PADUA, T. R. P.; SILVA, C. A.; MELO, C. A. Calagem em latossolo sob influência de coberturas vegetais: neutralização da acidez. Revista Brasileira de Ciência do Solo, v. 30, n. 5, p. 869-878, 2006.
REISSMANN, C. B.; WISNIEWSKI, C. Nutricional aspects of pine plantation. In: GONÇALVES, J. L. M.;
BENEDETTI, V. (Org). Forest nutrition and fertilization. Piracicaba: IPEF, 2004. p. 141-170.
REISSMANN, C. B.; ZÖTTL, H. W. Problemas nutricionais em povoamentos de Pinus taeda em áreas do arenito da formação Rio Bonito-Grupo Guatá. Revista Ciência Agrária, v. 9, n. 1, p. 75-80, 1987.
SCHUMACHER, M. V.; VIERA, M.; WITSCHORECK, R. Produção de serapilheira e tranferência de nutrientes em área de segunda rotação com floresta de Pinus taeda no município de Cambará do Sul, RS. Ciência Florestal, v. 18, n. 4, p. 471- 480, 2008.
SILVA, F. A. ASSISTAT versão beta. Grande: Assistência Estatística, Departamento de Engenharia Agrícola do CTRN – Universidade Federal de Campina Grande, Campus de Campina. Available from: <http://www.assistat.com>. Access on: Aug. 5 2012. SOUZA, D. M. P.; SOUZA, M. L. P. Alterações provocadas pelo florestamento de Pinus sp. na fertilidade de solos da região da Lapa-PR. Revista Floresta, v. 12, n. 1, p. 36-50, 1981.
UEBEL, E.; HEINSDORF, D. Results of long-term K and Mg fertilizer experiments in afforestation. Forest Ecology Management, v. 91, n. 1, p. 47-52, 1997. VIERA, M.; SCHUMACHER, M. V. Teores e aporte de nutrientes na serapilheira de Pinus taeda L., e sua relação com a temperatura do ar e pluviosidade. Revista Árvore, v. 34, n. 1, p. 85-94, 2010.
VOGEL, H. L. M. Crescimento de Pinus taeda, relacionado a doses de N, P, K e sua diagnose nutricional pelo DRIS. R. Ciência Florestal, v. 13, n. 1, p. 182-188, 2003.
ZÖTTL, H. M.; TSCHINKEL, H. Nutrición y fertilización forestall: una guía práctica. Medellin: Universidade Nacional de Colombia, 1971.
Received on July 25, 2012. Accepted on November 5, 2012.