Optical Coherence Tomography:
a window to multiple sclerosis?
Rita Pinto Proença1, Joana Cardigos1, Lívio Costa1, André Vicente1, Arnaldo Santos2, Duarte Amado2, Joana Ferreira2, João Paulo Cunha3
1Médico Interno de Oftalmologia 2Assistente Hospitalar de Oftalmologia 3Assistente Hospitalar Graduado Sénior de Oftalmologia
Serviço de Oftalmologia do Centro Hospitalar de Lisboa Central, Lisboa, Portugal
Resumo
Introdução: A esclerose múltipla (EM) é a doença inflamatória desmielinizante imunomediada
que mais frequentemente afecta o sistema nervoso central. Aproximadamente 20% dos doentes têm nevrite óptica como manifestação inicial da doença. A sua frequência, heterogeneidade e ausência de tratamento curativo tornam esta patologia um desafio diagnóstico e terapêutico tanto para o doente como para o médico.
material e métodos: Estudo retrospectivo de 133 olhos de 87 indivíduos, 38 doentes com
es-clerose múltipla (Grupo 1), 9 doentes com nevrite óptica isolada (Grupo 2) e 40 indivíduos saudáveis (Grupo 3) da Consulta de Neuroftalmologia do Centro Hospitalar de Lisboa Central, através da consulta do processo e exames complementares de diagnóstico, entre Janeiro de 2013 e Agosto de 2015.
Foram caracterizados os doentes de acordo com o género, idade, anos de seguimento, melhor acuidade visual corrigida, presença de outras anomalias oculares concomitantes e episódios de nevrite óptica. Foram excluídos doentes com outras patologias oculares.
Foi realizada uma tomografia de coerência óptica (OCT Spectralis, Heidelberg Engineering) da região macular, seguida de segmentação automática das camadas retinianas.
O estudo estatístico permitiu calcular diferenças estatisticamente significativas entre os diferen-tes grupos do estudo.
Resultados: Nos 87 doentes avaliados, a média de idades do grupo 1 foi de 41.55 anos, versus
36.88 do grupo 2 e 44.73 do grupo de controlo. A mediana da idade do diagnóstico nos doentes com esclerose múltipla foi de 33.73 anos e do tempo de seguimento de 8.01 anos, e no grupo da nevrite óptica isolada de 34.33, com 2.88 anos de seguimento. A melhor acuidade visual corrigi-da variou entre 0.2 e 1.0 no grupo 1 e 0.5 a 1.0 no grupo 2.
Nos doentes com antecedentes de nevrite óptica isolada ou associada a esclerose múltipla obser-vou-se uma diminuição significativa (p<0.05) da espessura média da retina com diminuição da camada de fibras nervosas, da camada de células ganglionares e da plexiforme interna em relação ao grupo controlo.
Conclusões: As espessuras, especialmente das camadas mais internas da retina (camada de
fi-bras nervosas, camada de células ganglionares e plexiforme interna), estavam reduzidas de for-ma estatisticamente significativa (p<0.05) em relação ao grupo controlo.
Palavras-chave
Esclerose Múltipla; Tomografia de Coerência Óptica; Nevrite Óptica; Camada de células gan-glionares
Introduction: Multiple sclerosis (MS) is an inflammatory immune-mediated demyelinating
disease that frequently affects the central nervous system. Approximately 20% of patients have optic neuritis as the first manifestation of the disease. Its frequency, heterogeneity and absence of definitive treatment make it a therapeutic and diagnostic challenge for both the patient and the clinician.
material and methods: Retrospective study of 133 eyes of 87 patients, 38 patients with MS
(Group 1), 9 patients with isolated optic neuritis (Group 2) and 40 healthy patients (Group 3) from the Neurophthalmology Department of Centro Hospitalar de Lisboa Central from January 2013 to August 2015.
Patients were characterized according to gender, age, years of follow-up, best corrected visual acuity, presence of other ocular disorders and episodes of optic neuritis. Patients with other ocular pathologies were excluded.
Optical coherence tomography (OCT Spectralis, Heidelberg Engineering) of the macular region was done in all patients, followed by automatic segmentation of the retinal layer. Statisti-cal tests were made to Statisti-calculate statistiStatisti-cally significant results between different groups.
Results: Of the 87 patients evaluated, the mean age in Group 1 was 41.55 compared to 36.88
in Group 2 and 44.73 in the control group. Mean age of diagnosis for patients with MS was 33.73 years with a mean follow up of 8.01 years, whereas patients with isolated optic neuritis had a mean age of diagnosis of 34.33 years, with a mean follow-up of 2.88 years. Best corrected visual acuity ranged from 0.2 to 1.0 in Group 1 and 0.5 to 1.0 in Group 2.
In patients with previous episodes of optic neuritis isolated or associated with multiple scle-rosis we observed a statistically significant (p<0.05) reduction of the average retinal thickness as well as a thinner retinal nerve fiber layer, ganglion cell layer and inner plexiform layer when compared to the control group.
Conclusion: Thickness of the internal retinal layers was reduced (retinal nerve, ganglion cell
and inner plexiform layer) in a statistically significant (p<0.05) when compared to the control group.
Keywords
Multiple sclerosis; optical coherence tomography; optic neuritis; ganglion cell layer.
IntRoduCtIon
Multiple sclerosis (MS) is a chronic, predominantly immune-mediated, inflammatory and demyelinating disease of the central nervous system (CNS) characterized by suba-cute neurologic deficits correlating with CNS lesions, sepa-rated in time and space, excluding other possible diseases. Approximately 20% of MS patients present with acute optic neuritis (AON) as a first demyelinating event and about 40 to 70% experience ON at some point during the course of the disease1.
Optical coherence tomography (OCT) is a noninvasive, noncontact, reproducible, quantitative technique that uses the interference patterns produced by low coherence light to generate high-resolution (<5μm) from optical scatte-ring media (e.g. retina). This technique has been used to define and differentiate specific forms of optic neuropathy,
document changes in retinal nerve fiber layer thickness (RNFL) and macular volume2 over time and help corre-late structural retinal nerve fiber layer changes with visual function.
Since the RNFL is composed only of unmyelinated axons of the retinal ganglion cells (which convey informa-tion from the retina to the lateral geniculate nucleus), mea-suring RNFL thickness can be a viable method for monito-ring axonal loss in MS patients. Following the publication of the first quantitative OCT study of RNFL thickness in multiple sclerosis (MS) in 1999,1,3 there has been a rapidly growing interest in various applications of OCT in the diag-nosis and management of patients with MS, both in those with optic neuritis (MS ON+) and those without optic neu-ritis (MS ON-).
Subsequently, OCT studies turned to the segmentation of retinal layers from which the individual retinal layers
can be delimited, qualitatively and quantitatively assessed to extend the analysis of axonal damage (RNFL) to neu-ronal degeneration. Ganglion cell layer thinning has been proved to be a sensitive marker to detect damage even in the absence of a previous episode of ON.
This study aims to determine changes in thickness of the eight different retinal layers in patients with MS ON+, MS ON- and clinically isolated syndrome (demyelinating lesion suggestive of MS that does not fulfill the criteria for MS diagnosis) and compare them with healthy subjects by using an automated segmentation program of spectral domain optical coherence tomography.
Since the heterogeneity of the MS disease course remains a challenge for patient management and treatment, our study tries to evaluate if inner retinal thickness can serve as a direct biomarker for monitoring the course of this disease.
mateRIal and methods
Retrospective study of 133 eyes of 87 individuals, 47 patients and 40 healthy controls from the Multiple Sclero-sis and Neuro-Ophthalmology Department of Hospital de Santo António dos Capuchos, between January 2013 and August 2015.
The design of this study followed the Declaration of Helsinki principles. All participants provided written infor-med consent.
Patients were characterized according to gender, age, years of follow-up, episodes of optic neuritis and treatment. All participants underwent a full ophthalmologic examina-tion including best corrected visual acuity, biomicroscopy, Goldmann applanation tonometry, and ophthalmoscopy. Participants were excluded if there was any history of a comorbidity that could plausibly account for the presence of macular or neuropathy, including a prior history of glau-coma, uveitis, diabetes, retinal vein occlusion, age-related macular degeneration, retinosquisis, or refractive errors of more or less than six diopters. This happened in two patients with subclinical epiretinal membrane and macular edema.
Study participants were recruited and divided in three groups: Group 1 included 38 patients with MS, subdivided in eyes with optic neuritis (ON+) (n=44), or without optic neuritis (ON-) (n= 31); Group 2 with 9 patients with cli-nically isolated syndrome (CIS) subdivided in eyes with optic neuritis (ON+) (n=10) or without optic neuritis (ON-) (n=8); Group 3 of healthy controls (n=40).
Patients with MS were diagnosed according to the 2010 modified McDonald criteria by treating neurologists.
In patients with CIS, other diseases such as neuromyelitis optica (NMO), and chronic relapsing inflammatory neuro-pathy were excluded (negative NMO-IgG). All were treated with corticosteroids and one had another episode of optic neuritis in the other eye during follow-up. Disease duration was defined as the time from the first clinical symptom attri-butable to multiple sclerosis to the date of OCT evaluation. Patients with acute optic neuritis or optic disc edema within three months of the examination were excluded from the study.
All patients underwent retinal OCT imaging and auto-mated retinal segmentation to identify each retinal layer and to quantify its thickness. OCT was performed by an expe-rienced operator using spectral-domain OCT (Heidelberg
Spectralis, Heidelberg Engineering, Germany).
Macular scanning was obtained and qualitatively asses-sed for the presence of other macular pathologies. Macular segmentation was performed using Heidelberg Eye Explo-rer software provided by the manufactuExplo-rer. Corresponding data was obtained from single horizontal axial scans to separate the retina into 8 layers: 1- nerve fiber layer; 2- gan-glion cell layer; 3-inner plexiform layer; 4- inner nuclear layer; 5- outer plexiform layer; 6- outer nuclear layer; 7- photoreceptor layer; 8- retinal pigment epithelium.
Scans were centered at the fovea and obtained at a radius of 3 to 6 mm from the central, superior, inferior, nasal and temporal sectors. Values of mean thickness, nasal (N), superonasal (SN), inferonasal (IN), temporal (T), temporo--nasal (TN) and superonasal (SN) thickness were collected from all retinal layers. All scans were assessed before seg-mentation analysis and low quality scans were rejected.
Statistical analysis was performed using SPSS software. Mean layer and sectorial thickness were compared between the different groups using Student t test, considering P values less than 0.05 statistically significant.
Results
In this retrospective study of 133 eyes of 87 indivi-duals, 47 patients and 40 healthy controls, participants were recruited and divided in three groups (Table I):
- Group 1 included 75 eyes of 38 patients with MS, subdivided in eyes with previous acute optic neuri-tis (ON+, N=44) or without previous optic neurineuri-tis (ON-, N= 31). In this group mean age was 41.55 ± 12.38 years, with a mean follow-up of 8.02 ± 8.24 years.
- Group 2 included 18 eyes of 10 patients with cli-nically isolated syndrome (CIS) subdivided in eyes
with optic neuritis (ON+, N=10) or without optic neuritis (ON-, N=8). These patients had a mean age of 34.89 ± 11.75 years and a mean follow-up of 2.88 ± 3.09 years.
- Group 3 (control) included 40 eyes of 40 healthy controls with a mean age of 45.62 ± 13.70 years.
Patient age ranged from 21 years to 68 years (Group 1 and 2) and the ratio of women to men was approximately 2.13:1 (32 women, 15 men).
No significant difference in age was found between groups (two-sample student’s t test, p>0.05) but Group 1 and 2 were found to differ significantly regarding disease duration (two-sample student’s t test, p<0.001).
All 87 patients underwent retinal OCT imaging and automated retinal segmentation to identify each retinal layer and to quantify its thickness.
average total retinal thickness
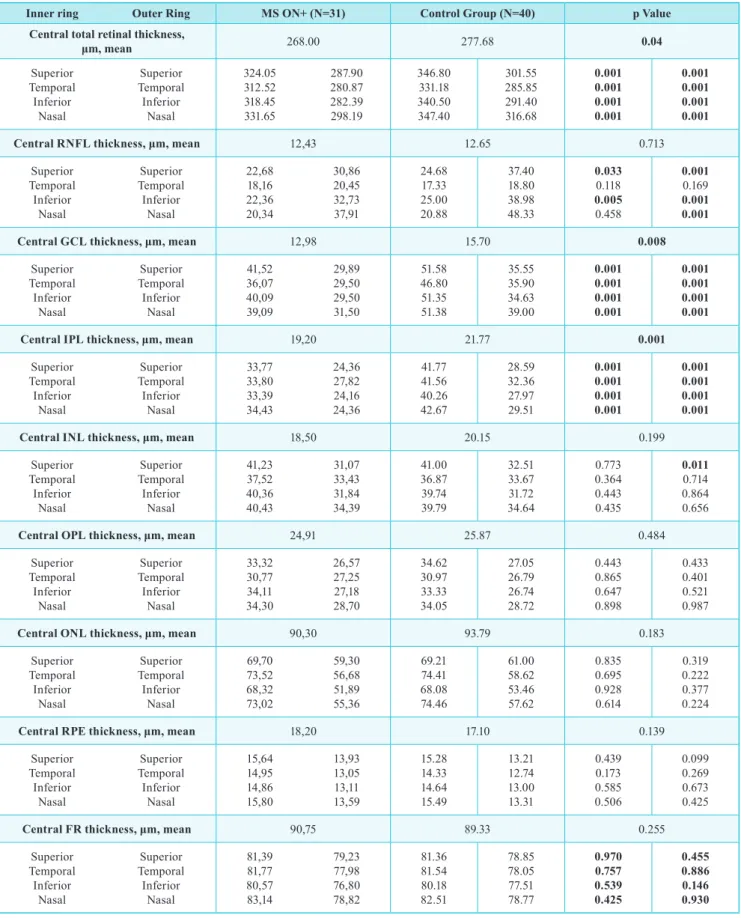
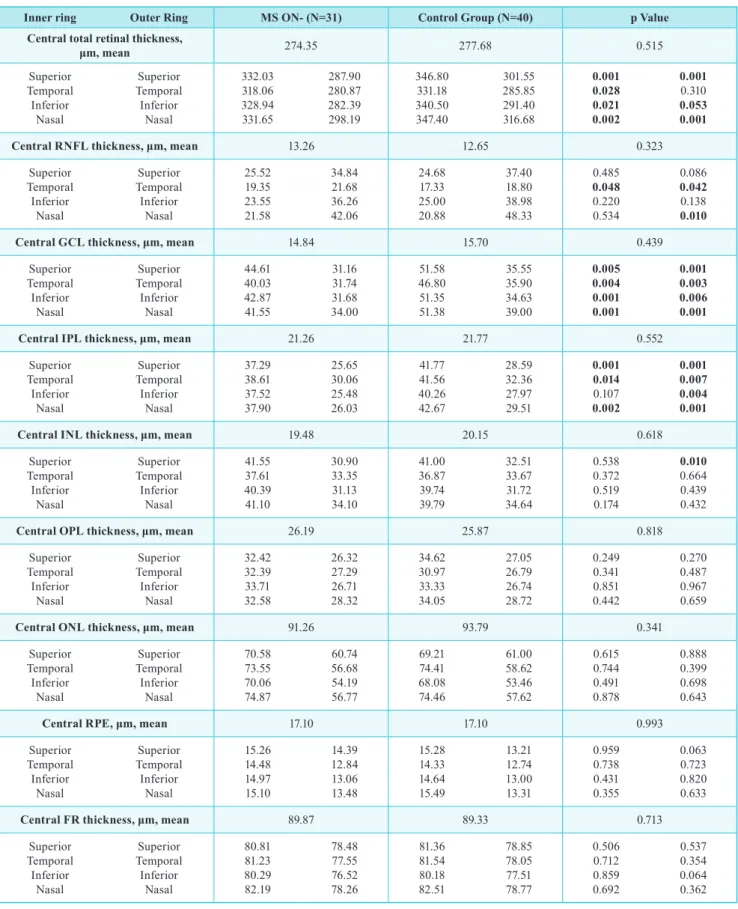
In this study the average total retinal thickness was initially compared between MS ON + eyes and MS ON- of Group 1 and 2 with the eyes of control Group 3. This revealed a statistical significant difference (Student T test, p< 0.05) between MS ON+ and the control group, demons-trating a reduced macular thickness in MS ON + eyes at the fovea and also all sectors (Table II). Although MS ON- eyes didn’t reveal a statistically significant reduction at the fovea, they did in all other sectors except in T6 (Table III). Both CIS ON+ and CIS ON- eyes did not reveal a sta-tistical significant difference (Student T test, p<0.05) to the control group.
There was no statistical difference in macular volume between MS ON+ and ON- eyes.
Retinal layer thickness
After comparing total macular thickness, the thickness of all eight retinal layers was measured (RNFL, GCL, IPL,
INL, OPL, ONL, RPE, FR) with scans centered at the fovea and at a radius of 3 to 6 mm from the central, superior, infe-rior, nasal and temporal sectors. Values of mean thickness, nasal (N), superonasal (SN), inferonasal (IN), temporal (T), temporo-nasal (TN) and superonasal (SN) thickness were collected from all retinal layers (Table IV).
Retinal nerve Fiber layer
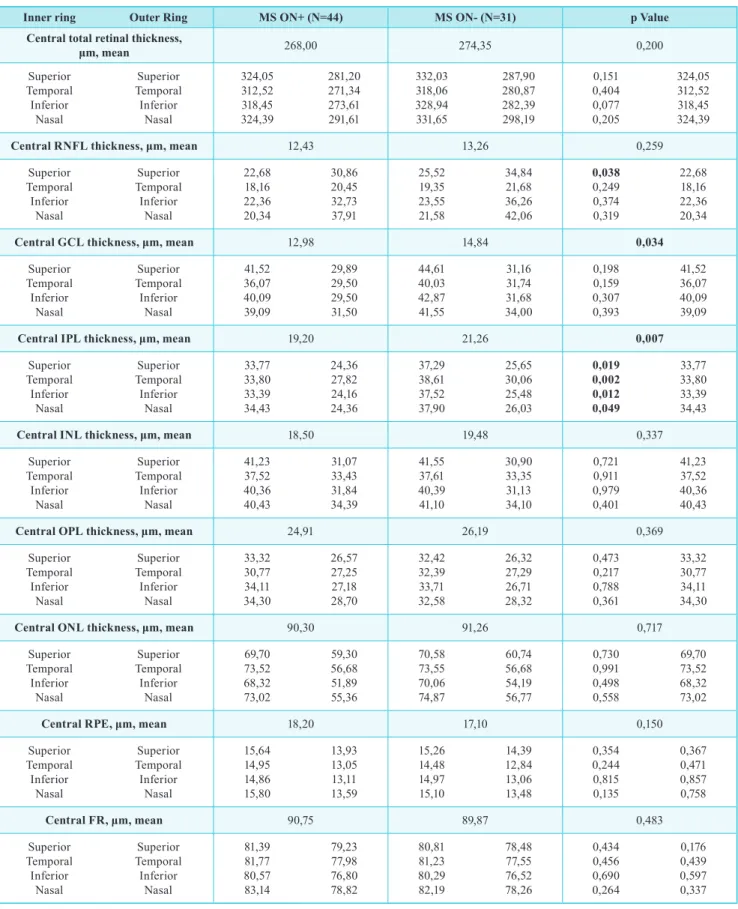
Statistical significant differences (p<0.05) were found between MS ON+ eyes and Control Group 3, with a reduc-tion in average retinal thickness at the RNFL, with a more significant reduction in respectively the superior and infe-rior sectors. Although a statistical significance was not obtained in the temporal and nasal sectors, it showed a statistical trend towards reduction. This reduction did not respect the ISNT rule for glaucomatous eyes. MS ON- only showed a significant reduction in the temporal sector of both inner and outer ring and in the nasal sector of the outer ring. Superior RNFL thickness was reduced in MS ON+ compared to MS ON- (p<0.05). CIS ON- had a significantly reduced RNFL thickness (p<0.05) in the superior sector of the inner and outer ring whereas CIS ON+ had a temporal and nasal reduction also of both rings.
Ganglion Cell layer
GCL was found to be significantly thinner (p<0.05) in both MS ON+ and MS ON- eyes compared with Control Group 3, with a reduction in average retinal thickness in all sectors except for the central one. Central GCL thickness was reduced in MS ON+ compared to MS ON- (p<0.05). CIS ON+ had a significant reduced GCL thickness (p<0.05) in the superior sector of the outer ring whereas CIS ON- did not show a significant reduction.
Inner Plexiform layer
The calculated measurements revealed a thinner IPL in all sectors (p<0.001) in MS ON+ and in all sectors except table I | Baseline demographic and clinical characteristics.
Group 1 (MS patients) Group 2 (MS patients)
Patients (eyes) 38 (75) 9 (18)
age, years, mean (sd) 41.55 (±12.38) 34.89 (±11.75)
Female (%) 25 (65.79%) 7 (77.78%)
BCVa (snellen) 0.862 (±0.21) 0.986 (±0.05)
disease duration, years 8.01 (±8.24) 2.88 (±3.09)
table II | Baseline demographic and clinical characteristics.
Inner ring outer Ring ms on+ (n=31) Control Group (n=40) p Value
Central total retinal thickness,
μm, mean 268.00 277.68 0.04 Superior Temporal Inferior Nasal Superior Temporal Inferior Nasal 324.05 312.52 318.45 331.65 287.90 280.87 282.39 298.19 346.80 331.18 340.50 347.40 301.55 285.85 291.40 316.68 0.001 0.001 0.001 0.001 0.001 0.001 0.001 0.001
Central RNFL thickness, μm, mean 12,43 12.65 0.713
Superior Temporal Inferior Nasal Superior Temporal Inferior Nasal 22,68 18,16 22,36 20,34 30,86 20,45 32,73 37,91 24.68 17.33 25.00 20.88 37.40 18.80 38.98 48.33 0.033 0.118 0.005 0.458 0.001 0.169 0.001 0.001
Central GCL thickness, μm, mean 12,98 15.70 0.008
Superior Temporal Inferior Nasal Superior Temporal Inferior Nasal 41,52 36,07 40,09 39,09 29,89 29,50 29,50 31,50 51.58 46.80 51.35 51.38 35.55 35.90 34.63 39.00 0.001 0.001 0.001 0.001 0.001 0.001 0.001 0.001
Central IPL thickness, μm, mean 19,20 21.77 0.001
Superior Temporal Inferior Nasal Superior Temporal Inferior Nasal 33,77 33,80 33,39 34,43 24,36 27,82 24,16 24,36 41.77 41.56 40.26 42.67 28.59 32.36 27.97 29.51 0.001 0.001 0.001 0.001 0.001 0.001 0.001 0.001
Central INL thickness, μm, mean 18,50 20.15 0.199
Superior Temporal Inferior Nasal Superior Temporal Inferior Nasal 41,23 37,52 40,36 40,43 31,07 33,43 31,84 34,39 41.00 36.87 39.74 39.79 32.51 33.67 31.72 34.64 0.773 0.364 0.443 0.435 0.011 0.714 0.864 0.656
Central OPL thickness, μm, mean 24,91 25.87 0.484
Superior Temporal Inferior Nasal Superior Temporal Inferior Nasal 33,32 30,77 34,11 34,30 26,57 27,25 27,18 28,70 34.62 30.97 33.33 34.05 27.05 26.79 26.74 28.72 0.443 0.865 0.647 0.898 0.433 0.401 0.521 0.987
Central ONL thickness, μm, mean 90,30 93.79 0.183
Superior Temporal Inferior Nasal Superior Temporal Inferior Nasal 69,70 73,52 68,32 73,02 59,30 56,68 51,89 55,36 69.21 74.41 68.08 74.46 61.00 58.62 53.46 57.62 0.835 0.695 0.928 0.614 0.319 0.222 0.377 0.224
Central RPE thickness, μm, mean 18,20 17.10 0.139
Superior Temporal Inferior Nasal Superior Temporal Inferior Nasal 15,64 14,95 14,86 15,80 13,93 13,05 13,11 13,59 15.28 14.33 14.64 15.49 13.21 12.74 13.00 13.31 0.439 0.173 0.585 0.506 0.099 0.269 0.673 0.425
Central FR thickness, μm, mean 90,75 89.33 0.255
Superior Temporal Inferior Nasal Superior Temporal Inferior Nasal 81,39 81,77 80,57 83,14 79,23 77,98 76,80 78,82 81.36 81.54 80.18 82.51 78.85 78.05 77.51 78.77 0.970 0.757 0.539 0.425 0.455 0.886 0.146 0.930
table III | mean thickness of all 10 retinal layers (central and sectorial) obtained by automatic segmentation of the spectralis oCt in ms on- eyes and control group.
Inner ring outer Ring ms on- (n=31) Control Group (n=40) p Value
Central total retinal thickness,
μm, mean 274.35 277.68 0.515 Superior Temporal Inferior Nasal Superior Temporal Inferior Nasal 332.03 318.06 328.94 331.65 287.90 280.87 282.39 298.19 346.80 331.18 340.50 347.40 301.55 285.85 291.40 316.68 0.001 0.028 0.021 0.002 0.001 0.310 0.053 0.001
Central RNFL thickness, μm, mean 13.26 12.65 0.323
Superior Temporal Inferior Nasal Superior Temporal Inferior Nasal 25.52 19.35 23.55 21.58 34.84 21.68 36.26 42.06 24.68 17.33 25.00 20.88 37.40 18.80 38.98 48.33 0.485 0.048 0.220 0.534 0.086 0.042 0.138 0.010
Central GCL thickness, μm, mean 14.84 15.70 0.439
Superior Temporal Inferior Nasal Superior Temporal Inferior Nasal 44.61 40.03 42.87 41.55 31.16 31.74 31.68 34.00 51.58 46.80 51.35 51.38 35.55 35.90 34.63 39.00 0.005 0.004 0.001 0.001 0.001 0.003 0.006 0.001
Central IPL thickness, μm, mean 21.26 21.77 0.552
Superior Temporal Inferior Nasal Superior Temporal Inferior Nasal 37.29 38.61 37.52 37.90 25.65 30.06 25.48 26.03 41.77 41.56 40.26 42.67 28.59 32.36 27.97 29.51 0.001 0.014 0.107 0.002 0.001 0.007 0.004 0.001
Central INL thickness, μm, mean 19.48 20.15 0.618
Superior Temporal Inferior Nasal Superior Temporal Inferior Nasal 41.55 37.61 40.39 41.10 30.90 33.35 31.13 34.10 41.00 36.87 39.74 39.79 32.51 33.67 31.72 34.64 0.538 0.372 0.519 0.174 0.010 0.664 0.439 0.432
Central OPL thickness, μm, mean 26.19 25.87 0.818
Superior Temporal Inferior Nasal Superior Temporal Inferior Nasal 32.42 32.39 33.71 32.58 26.32 27.29 26.71 28.32 34.62 30.97 33.33 34.05 27.05 26.79 26.74 28.72 0.249 0.341 0.851 0.442 0.270 0.487 0.967 0.659
Central ONL thickness, μm, mean 91.26 93.79 0.341
Superior Temporal Inferior Nasal Superior Temporal Inferior Nasal 70.58 73.55 70.06 74.87 60.74 56.68 54.19 56.77 69.21 74.41 68.08 74.46 61.00 58.62 53.46 57.62 0.615 0.744 0.491 0.878 0.888 0.399 0.698 0.643
Central RPE, μm, mean 17.10 17.10 0.993
Superior Temporal Inferior Nasal Superior Temporal Inferior Nasal 15.26 14.48 14.97 15.10 14.39 12.84 13.06 13.48 15.28 14.33 14.64 15.49 13.21 12.74 13.00 13.31 0.959 0.738 0.431 0.355 0.063 0.723 0.820 0.633
Central FR thickness, μm, mean 89.87 89.33 0.713
Superior Temporal Inferior Nasal Superior Temporal Inferior Nasal 80.81 81.23 80.29 82.19 78.48 77.55 76.52 78.26 81.36 81.54 80.18 82.51 78.85 78.05 77.51 78.77 0.506 0.712 0.859 0.692 0.537 0.354 0.064 0.362
table IV | mean thickness of all 10 retinal layers (central and sectorial) obtained by automatic segmentation of the spectralis oCt in ms on+ eyes and ms on-.
Inner ring outer Ring ms on+ (n=44) ms on- (n=31) p Value
Central total retinal thickness,
μm, mean 268,00 274,35 0,200 Superior Temporal Inferior Nasal Superior Temporal Inferior Nasal 324,05 312,52 318,45 324,39 281,20 271,34 273,61 291,61 332,03 318,06 328,94 331,65 287,90 280,87 282,39 298,19 0,151 0,404 0,077 0,205 324,05 312,52 318,45 324,39
Central RNFL thickness, μm, mean 12,43 13,26 0,259
Superior Temporal Inferior Nasal Superior Temporal Inferior Nasal 22,68 18,16 22,36 20,34 30,86 20,45 32,73 37,91 25,52 19,35 23,55 21,58 34,84 21,68 36,26 42,06 0,038 0,249 0,374 0,319 22,68 18,16 22,36 20,34
Central GCL thickness, μm, mean 12,98 14,84 0,034
Superior Temporal Inferior Nasal Superior Temporal Inferior Nasal 41,52 36,07 40,09 39,09 29,89 29,50 29,50 31,50 44,61 40,03 42,87 41,55 31,16 31,74 31,68 34,00 0,198 0,159 0,307 0,393 41,52 36,07 40,09 39,09
Central IPL thickness, μm, mean 19,20 21,26 0,007
Superior Temporal Inferior Nasal Superior Temporal Inferior Nasal 33,77 33,80 33,39 34,43 24,36 27,82 24,16 24,36 37,29 38,61 37,52 37,90 25,65 30,06 25,48 26,03 0,019 0,002 0,012 0,049 33,77 33,80 33,39 34,43
Central INL thickness, μm, mean 18,50 19,48 0,337
Superior Temporal Inferior Nasal Superior Temporal Inferior Nasal 41,23 37,52 40,36 40,43 31,07 33,43 31,84 34,39 41,55 37,61 40,39 41,10 30,90 33,35 31,13 34,10 0,721 0,911 0,979 0,401 41,23 37,52 40,36 40,43
Central OPL thickness, μm, mean 24,91 26,19 0,369
Superior Temporal Inferior Nasal Superior Temporal Inferior Nasal 33,32 30,77 34,11 34,30 26,57 27,25 27,18 28,70 32,42 32,39 33,71 32,58 26,32 27,29 26,71 28,32 0,473 0,217 0,788 0,361 33,32 30,77 34,11 34,30
Central ONL thickness, μm, mean 90,30 91,26 0,717
Superior Temporal Inferior Nasal Superior Temporal Inferior Nasal 69,70 73,52 68,32 73,02 59,30 56,68 51,89 55,36 70,58 73,55 70,06 74,87 60,74 56,68 54,19 56,77 0,730 0,991 0,498 0,558 69,70 73,52 68,32 73,02
Central RPE, μm, mean 18,20 17,10 0,150
Superior Temporal Inferior Nasal Superior Temporal Inferior Nasal 15,64 14,95 14,86 15,80 13,93 13,05 13,11 13,59 15,26 14,48 14,97 15,10 14,39 12,84 13,06 13,48 0,354 0,244 0,815 0,135 0,367 0,471 0,857 0,758 Central FR, μm, mean 90,75 89,87 0,483 Superior Temporal Inferior Nasal Superior Temporal Inferior Nasal 81,39 81,77 80,57 83,14 79,23 77,98 76,80 78,82 80,81 81,23 80,29 82,19 78,48 77,55 76,52 78,26 0,434 0,456 0,690 0,264 0,176 0,439 0,597 0,337
for the central one in MS ON- compared to the control group. IPL was significantly reduced in MS ON+ in con-trast with MS ON- in all sectors except for the nasal outer ring. IPL was significantly thinner in CIS ON+ eyes compa-red to the control group only in the superior outer ring. CIS ON- did not appear to have a significant reduction.
Inner nuclear layer, outer Plexiform layer, ou-ter nuclear layer, Retinal Pigment epithelium and Photoreceptor layer
Both MS ON+ and MS ON- patients did not demons-trate statistically significant differences when compared to the Control Group. A trend was observed with an increase in thickness in some sectors of the INL-OPL and ONL--RPE layer although this was not statistically significant. CIS ON+ and ON- eyes exhibited the same trend.
Clinically isolated syndrome
Eyes with CIS ON+ and CIS ON- did not show statis-tically significant differences between them in any retinal layer except for a reduction in the RPE central layer in CIS ON- (P<0.02).
dIsCussIon
Multiple sclerosis is a central nervous system disease characterized by inflammation and neuro-axonal degene-ration. The eye itself is commonly affected by MS. Optic neuritis is a frequent inaugural sign of MS ant it can also develop during the course of this disease. During acute ON, fluorescein leakage has proved a disruption of the blood--retina barrier as well as showed retinal perivascular inflam-mation (periphlebitis). Studies demonstrated that active periphlebitis could be a risk factor for relapses and brain lesions. Intermediate uveitis (pars planitis) can also occur in up to 15-25% of patients.
Neuro-axonal degeneration affecting the retina can be structurally and functionally related to pathology of the visual pathways. Inflammation and activation of the micro-glia have also been demonstrated in the inner retina of MS patients but the relationship between inflammation and neu-rodegeneration needs more studies.
Optical Coherence Tomography (OCT) has become one of the most important tools in ophthalmology practice and especially in neuro-ophthalmology practice. It is a fast, relia-ble and non-invasive method that can provide high quality images of the optic nerve, retinal nerve fiber layer, macular volume and ganglion cell layer which can be relevant for diagnosis, prognosis and follow-up of different diseases.
In MS, OCT can have a potential role in quantifying axonal loss and assessing longitudinal alterations6. The first studies with time-domain OCT showed that peripapi-llary RNFL thinning was associated with macular volume reduction in eyes with previous MS ON+.1 More recently spectral-domain OCT studies confirm that eyes with thinner macula are associated with reduced thickness of the macu-lar RNFL, ganglion cell layer (GCL), and inner plexiform layer (IPL) thinning3,14.
The temporal and spatial associations between axonal injury and ganglion cell loss have yet to be determined, although retrograde degeneration of the RNFL has been implicated as an important mechanism leading to macular damage. It seems that in a subset of patients with MS, a disproportionate thinning of the macular inner and outer nuclear layers has been reported in the presence of normal peripapillary RNFL thickness and these patients may pre-sent a MS-related macular pathology as a primary process independent of optic nerve pathology4.
Recently various protocols of segmentation of OCT images, both manual and automated11,14,15, have been used to quantify changes in different retinal layers in patients with MS, with variable levels of success10. These segmen-tation algorithms rely on techniques such as edge detection, intensity variations, active contours, multiresolution hie-rarchical support vector machines and graph-cut segmen-tation. Most of these approaches introduce complex models or methodologies to obtain reliable results and are therefore very computationally intensive. Previous results of manual and automatic segmentation have yielded similar results insofar, except for the RNFL and INL layers. These layers are thinner than others making it difficult to determine their limits correctly. One study suggests that segmentation of both layers together with their neighboring layers, namely RNFL-GCL-IPL together, and similarly the INL-OPL, can be a method to overcome this issue. This approach is also applied by other widely used automatic segmentation methods. However, Spectralis OCT is effective in distin-guishing and measuring these layers when compared to the Cirrus OCT used in the first studies.
In our study, we use a fast approach for automatic seg-mentation of the 8 retinal layers: 1- retinal nerve fiber layer (RNFL); 2- ganglion cell layer (GCL); 3- inner plexiform layer (IPL); 4- inner nuclear layer (INL); 5- outer plexiform layer (OPL); 6- outer nuclear layer (ONL); 7- photorecep-tor layer (FR); 8- retinal pigment epithelium (RPE). To validate our method in a real-world setting, we quantified retinal changes caused by ON in two separate cohorts of patients with MS and CIS, comparing them with a control group of healthy aged-matched individuals.
Our results revealed a significant reduction in average macular layer and retinal nerve fiber layer in MS patients with previous episodes of optic neuritis and even in the absence of optic neuritis, when compared to the control group. However, there was no statistical significance in this reduction between MS ON+ and MS ON- except for a greater reduction in the superior sector in MS ON+ eyes. This finding is in line with previous studies that show a reduce thickness of both the macula and RNFL in MS patients10,11,12,14,15.
In our study, GCL and IPL layers were also thinned in both MS ON+ and MS ON- with this thickness being more pronounced in eyes with previous optic neuritis. Thinning in ON- eyes can perhaps be explained by subclinical epi-sodes of optic neuritis, degeneration of the ganglion cells and their axons without inflammation or retrograde neration of MS lesions. This type of trans-synaptic dege-neration has been reported in patients with homonymous hemianopia due to retrogeniculate lesions. Albrecht et al16 applied manual segmentation to a similar cohort of patients obtaining the same results.
We did not detect alterations in other layers except for a trend in the increase in thickness in some sectors of the INL-OPL and ONL-RPE layer although this was not sta-tistically significant. This can be because the ON episodes did not affect outer retinal layers or retrograde degenera-tion does not have a part in altering outer retinal layer’s thickness. Some studies, however, show a thickening of the ONL + FR layer (and less pronounced of the INL+OPL) that may be mediated be the same retrograde degenera-tion mechanism. Vitreous tracdegenera-tion has also been implica-ted but recently deemed unrelaimplica-ted7,8,9,13. Another plausible explanation can be the presence of the earlier mentioned retinal inflammation, with perivenous sheating and peri-venous leakage, which occurs in eyes with AON within eight weeks of symptom onset5. This corroborates studies that refer to the dynamic changes occurring in deep retinal layers following AON, with a mean increased in ONL+FR layer at four months followed by a decreased in retinal thi-ckness at about 4-12 months and similar thithi-ckness compa-ring to baseline after four months13. Our results may be at this stage since none of the patients had had an episode of AON in the last year before OCT5,11.
Our study has some limitations. Firstly we did not sepa-rate different MS types, which, in more aggressive types, can possibly have a more evident pathway of neuronal degeneration. Different follow-up times can also inter-fere with the results. Standard OCT techniques, although offering high resolution imaging, still cannot achieve cellular-resolution imaging. Therefore it is not possible to
determine if the alterations detected in our study are due to activation of microglia cells (Müller cells in the retina) in response to ganglion cell death, hypertrophic neuronal cell bodies, alterations in subretinal fluids or a combination of these factors. Future studies, perhaps with adaptive optics technology, can possibly shed a light in this phenomenon.
OCT can currently be considered an imaging biomarker of global CNS atrophy for both monitoring neuronal dege-neration and assessing non-invasively effectiveness of the-rapies that reduce neuroaxonal loss. We believe that gan-glion cell atrophy that occurs so early in the course of MS is still undermined and could be reduced with valid neuro-protective therapies during therapeutic window using OCT technology has a primary or secondary outcome metric for MS patients.
ReFeRenCes
1. Parisi V, Manni G, Spadaro M, et al. Correlation between morphological and functional retinal impairment in multiple sclerosis patients. Invest Ophthalmol Vis Sci. 1999;40:2520-2527.
2. Trip SA, Schlottmann PG, Jones SJ, et al. Retinal nerve fiber layer axonal loss and visual dysfunction in optic neuritis. Ann Neurol. 2005;58:383-391.
3. Walter SD, Ishikawa H, Galetta KM, et al. Ganglion cell loss in relation to visual disability in multiple sclerosis. Ophthalmology. 2012;119:1250-1257.
4. Saidha S, Syc SB, Ibrahim MA, et al. Primary retinal pathology in multiple sclerosis as detected by optical coherence tomography. Brain. 2011;134:518-533. 5. Saidha S, Sotirchos ES, et al. Microcystic macular
oedema, thickness of the inner nuclear layer of the retina, and characteristics in multiple sclerosis: a retrospective study. Lancet Neurol 2012;11:963-972
6. Green AJ, McQuaid S, Hauser SL, et al. Ocular pathology in multiple sclerosis: retinal atrophy and inflammation irrespective of disease duration. Brain 2010;133(Pt6):1591–601.
7. Lujan BJ and Horton JC. Microcysts in the inner nuclear layer from optic atrophy are caused by retrograde trans--synaptic degeneration combined with vitreous traction on the retinal surface. Brain. 2013;136(Pt11):e260. 8. Barboni P, Carelli V, Savini G, et al. Microcystic
macu-lar degeneration from optic neuropathy: Not inflamma-tory, not trans-synaptic degeneration. Brain. 2013;136(Pt 7):e239.
Dynamic formation of macular microcysts independent of vitreous traction changes. Neurology. 2014;83:73–77. 10. Droby A, Panagoulias M, Albrecht P, et al. A novel auto-mated segmentation method for retinal layers in OCT images proves retinal degeneration after optic neuritis. Br J Ophthalmol. 2015;0:1–7.
11. Rebolleda G, Laura Diez-Alvarez L, Casado A, et al. OCT: New perspectives in neuro-ophthalmology. Saudi J Ophthalmol. 2015;29:9–25.
12. Feng L, Shen J, Jin X, Li J, Li Y. The Evaluation of the Retinal Nerve Fiber Layer in Multiple Sclerosis with Special-Domain Optical Coherence Tomography. Ophthalmologica. 2013;230:116–120
13. Al-Louzi O, Bhargava P, Newsome S, et al. Outer retinal changes following acute optic neuritis. Mult Scler. 2015 Jul 24. pii: 1352458515590646. [Epub ahead of print] 14. Lamirel C, Newman NJ, Biousse V. Optical Coherence
Tomography (OCT) in Optic Neuritis and Multiple Scle-rosis. Rev Neurol (Paris). 2010;166(12):978–986. 15. Garcia-Martin E, Polo V, et al. Retinal Layer Segmentation
in patients with multiple sclerosis using spectral domain optical coherence tomography. Ophthalmology, 2014-02-01, Volume 121, issue 2, Pages 573-579
16. Albrecht P et al. Degeneration of retinal layers in mul-tiple sclerosis subtypes quantified by optical coherence tomography; Mult Scler. 2012 Oct;18(10):1422-9. Epub 2012 Mar 2.
Os autores não têm conflitos de interesse a declarar.
Trabalho não publicado cedendo os direitos de autor à Sociedade Portu-guesa de Oftalmologia.
ContaCto
Rita Pinto Proença Serviço de Oftalmologia
Hospital de Santo António dos Capuchos, Alameda de Santo António dos Capuchos 1169-050 Lisboa