In this study we analyzed the mandibular cortical bone of patients with type 1 diabetes mellitus (T1DM) and non-diabetic. Fifty patients with T1DM and 100 non-diabetic ones paired by age and gender were analyzed. Two double-blinded observers evaluated 150 digital panoramic images of both groups. The mandibular cortical bone was analyzed using the Mandibular Cortical Index (MCI), Mental Index (MI), Gonial Index (GI), Antegonial Index (AI) and Upper and Lower Panoramic Mandibular Indexes (UPMI and LPMI), with the aid of RADIOIMP® software. Influence of T1DM in the morphology of the mandibular
cortical bone was studied based on obtaining data related to T1DM diagnosis time, blood glucose level, T1DM control and the presence of chronic complications. Collected data were submitted to descriptive (mean and standard deviation) and inferential analyzes (Pearson’s chi-squared test and Fisher’s exact test) (p≤0.05). According to the MCI, individuals with T1DM had higher frequencies of mandibular cortical alterations, in both sexes and all age groups (p<0.01). For quantitative indexes, MI, GI, AI, UPMI and LPMI, female patients showed statistically significant differences for GI and AI, while male patients had statistically significant differences for all indexes (p<0.05), presenting the individuals with TDM1 inferior measures. Individuals with poor T1DM control showed significantly higher frequency of mandibular cortical alteration (92.3%), with lower means for MI, GI, AI and LPMI (p≤0.05). In conclusion, patients with T1DM showed decrease in the mandibular cortical bone when compared to non-diabetic ones, indicating that poor disease control is associated with these alterations.
Decrease in Mandibular Cortical in
Patients With Type 1 Diabetes Mellitus
Combined with Poor Glycemic Control
Francisco Ivison Rodrigues Limeira, Patrícia Ravena Meneses Rebouças, Denise Nóbrega Diniz, Daniela Pita de Melo, Patrícia Meira Bento
Departament of Dentistry, School of Dentistry, UEPB - Universidade Estadual da Paraíba, Campina Grande, PB, Brazil
Correspondence: Francisco Ivison Rodrigues Limeira, Rua Baraúnas, 351, Bairro Universitário, 58429-500 Campina Grande, PB, Brazil. Tel: +55-83-3315-3300. e-mail: [email protected]
Key Words: cortical bone mandibular, panoramic radiograph, type 1 diabetes mellitus, hyperglycemia.
Introduction
Bone mineral density (BMD) is the amount of bone tissue in a certain volume of bone. The most recognized exam that evaluates BMD is dual-energy x-ray absorptiometry (DEXA) (1). The relationship between mandibular and skeletal BMD has received increasing attention, with scientific evidence that the decrease in bone mass affects the mandible, and that this loss of BMD can be proven in dental radiographs, especially panoramic images (2-4). Through radiomorphometric analysis, most studies evaluate the thickness and integrity of the inferior border of the mandible (5).
Diabetes Mellitus (DM) is a group of metabolic diseases characterized by hyperglycemia caused by secretion and/ or insulin action defects (6). When BMD is used as a bone alteration indicator, most studies suggested that type 1 diabetes mellitus (T1DM) has a connection with osteoporosis, as these patients have reduced BMD (7,8). By contrast, BMD in type 2 diabetes mellitus (T2DM) patients tends to be equal or higher than that of non-diabetic individuals (7). Peak bone mass reduction in some patients with T1DM has led to the hypothesis that insulin has anabolic effects on the bone. Thus, current guidelines for people with diabetes need to be updated to recognize
the association between bone alterations and T1DM. In addition, new screening tools need to be studied (9).
DM is considered a public health issue, due to its chronic complications (6). Much has been studied about bone quality of dental structures of individuals with systemic conditions that may result in decreased BMD, such as osteoporosis (4), postmenopause (10), celiac disease (11) and osteogenesis imperfect (12). However, there are no studies with radiomorphometric analysis in individuals with T1DM. Thus, T1DM complications on the mandibular cortical bone are still unknown.
Mandibular cortical in patients with T1DM
cortical bone morphology of patients with T1DM, through digital panoramic images, and compare it with the one of non-diabetic individuals.
Material and Methods
This cross-sectional paired study was approved by the local Ethics Committee, in accordance with 466/12 resolution of the National Health Council, Brazil (protocol number: 23475013.4.0000.5187).
Sample Distribution
The population of this study consisted of patients with a known diagnosis of T1DM who were undergoing treatment at the local University Hospital between 2013 and 2014. T1DM was diagnosed based on the criteria established by the American Diabetes Association (6), based on the presence of fasting plasma glucose ≥ 126 mg/dL, or 2-hour plasma glucose ≥ 200 mg/dL during 75-g oral glucose tolerance test, or in a patient with classic symptoms of hyperglycemia or hyperglycemic crisis – polyuria, polydipsia and weight loss – and with a random plasma glucose ≥ 200 mg/dL. Samples were obtained by convenience through nonprobability sampling. Fifty patients, 46% female, with ages ranging between 12 and 45 years old, mean of 27 ± 3, fulfilled the criteria and were included in the final sample. The following inclusion criteria were selected: regular T1DM monitoring and treatment by the reference service; more than an year of T1DM diagnosis; complete medical records; presence of panoramic radiographs with diagnostic quality; absence of conditions or illnesses related to bone mass alterations (renal, endocrine or rheumatologic diseases history, menopause or malignant tumors in any organ).
In order to compare the results obtained for the patients with T1DM, a group of non-diabetic individuals was established. For each individual with T1DM, there were two non-diabetic individuals (n=100), paired according to gender and age. Panoramic radiographs of non-diabetic individuals were selected from archives of the same radiology clinic, in which the panoramic radiographs of
T1DM patients were performed. Only the radiographs that faithfully reproduced the radiographed structures and that had not shown evidence of technical errors were included. Individuals that did not have medical record information regarding gender, age and history/current health condition and that carried conditions or illnesses related to bone mass alteration were also excluded.
Radiographic Analysis
Digital panoramic radiographs were obtained as a complementary tool to support diagnosis and dental treatment planning of all 150 subjects. The radiographs were acquired by using the same equipment (Orthophos XG5, Sirona Dental Systems, Bensheim, Germany), operated by the same technician and in full compliance with the reference points specified by the manufacturer of the device. Exposure parameters were chosen following the manufacture recommendations, according to the patient’s size and weight (70-90 kVp, 10-15 mA, 14 seconds of exposure). All original images were saved in Tagged Image File Format (TIFF) using Sidexis XG version 2.6 (Sirona Dental Systems, Bensheim, Germany). The images were calibrated with zero magnification and image resolution of 276 dpi. All analyses were performed bilaterally by two double-blinded observers calibrated using RadioImp® software, 2.0 version
(Radio Memory Ltda., Belo Horizonte, Minas Gerais, Brazil). The observers were told to perform cortical bone radiomorphometric analysis using the following indexes:
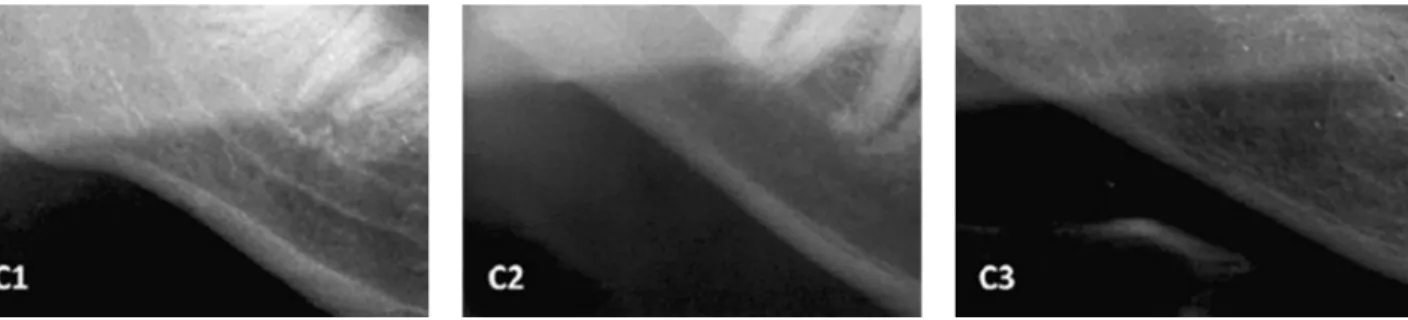
Mandibular Cortical Index (MCI), which refers to the inferior mandibular cortex quality by observing the region between the mental foramen and the antegonial region. It is divided into normal cortex (C1), in which the endosteal margin of the cortex is even and sharp; mild to moderately eroded cortex (C2), in which the endosteal margin shows semilunar defects or endosteal cortical residues; and severely eroded cortex (C3), in which the cortical layer is clearly porous and with reduced thickness (2) (Fig. 1). Individuals with MCI classified as C1 were considered as having no mandibular cortex alteration, and those classified
F
. I. R. Limeira et al.
in the C2 and C3 categories were considered as having cortex alterations.
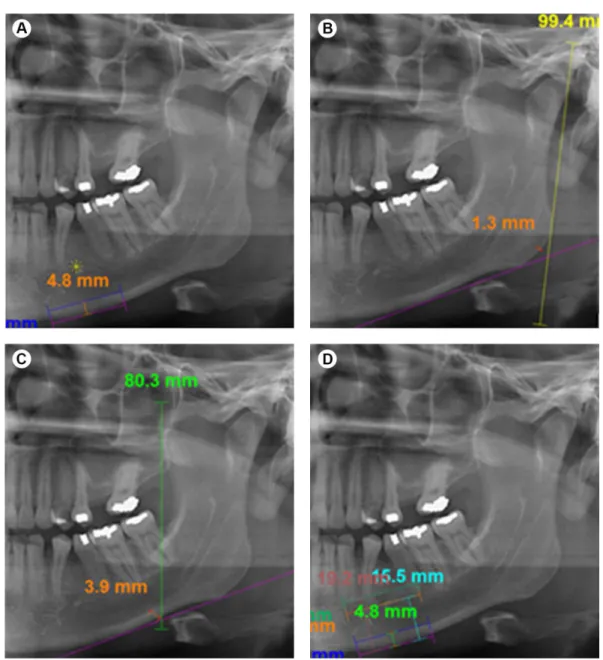
Mental Index (MI), that is the thickness of the mandibular lower cortex measured on the line passing through the middLe of mental foramen and perpendicular to the tangent to the lower border (13) (Fig. 2).
Gonial Index (GI), the cortical thickness at the gonial angle measured on the bisector of the angle between the tangent to the posterior border of the ramus and another line tangent to the lower border of the mandible (14) (Fig. 2).
Antegonial Index (AI), that is the measurement of the mandibular lower cortex thickness, measured on the best fitting line on the anterior border of mandibular ramus passing through the mandibular lower border (13) (Fig. 2).
Upper Panoramic Mandibular Index (UPMI) and Lower Panoramic Mandibular Index (LPMI), derived using the upper border of the mental foramen to measure the distance between the mental foramen and the inferior mandibular cortex (15) (Fig. 2).
T1DM History and Current Status
Information regarding the history and current state of T1DM were collected from the medical records of each patient (date of diagnosis, fasting blood glucose levels, glycated hemoglobin (HbA1c) and presence of chronic complications). According to the American Diabetes Association (6), fasting blood glucose levels recommended for adults are between 80 to 130 mg/dL and 90 to 130 mg/
Mandibular cortical in patients with T1DM
dL for adolescents. The recommended HbA1c for adults is of <7.0% and <7.5% for adolescents, corresponding to a good glycemic control.
Statistical Analysis
Data were tabulated and analyzed using the Statistical Package for the Social Sciences (SPSS for Windows, version 21.0, IBM Inc, Amonk, NY, USA). Descriptive analysis of central tendency (mean) and dispersion (standard deviation), as well as absolute and relative frequencies, were used. As inferences tests, Pearson’s chi-square test or, when it was not possible to use it, Fisher’s exact test, were used. In order to compare the means, t and one-way ANOVA tests were used. As post-hoc test, Bonferroni correction was used, at p≤0.05.
Results
In MCI analysis, it was observed that in both sexes and all age groups, patients with T1DM had higher frequencies of
mandibular cortical alterations, with statistically significant difference compared to the non-diabetic individuals (p<0.01) (Table 1).
For quantitative indexes, the female group showed statistically significant difference for GI and AI, with the female subjects with T1DM showing the lowest means (p<0.05). Meanwhile, males showed statistically significant difference for all indexes (p<0.05), with male subjects with T1DM also having the lowest means. In the age group between 12 and 24 years old, there was significant difference between groups just for MI. For the 25-45 years old group, statistically significant differences were observed for GI and UPMI. However, in the age group between 31-45 years old, there was statistically significant difference for all indexes (p<0.05) (Table 2).
Differences between mandibular cortical bone alterations regarding T1DM time of diagnosis, blood glucose levels (recommended or not), T1DM control and presence of chronic complications were analyzed. Based on MCI,
Table 1. Gross and relative frequencies of patients with and without bone alteration in individuals with T1DM and non-diabetic ones, according to sex and age group.
Patients with T1DM Non-diabetic patients
p value
Without alteration With alteration Without alteration With alteration
n % n % n % n %
Sex
Female 12 21.8 11 78.6 43 78.2 3 21.4 <0.01
Male 15 23.4 12 70.6 49 76.6 5 29.4 <0.01
Age group (years)
12-24 10 24.4 6 85.7 31 75.6 1 14.3 <0.01*
25-30 12 25.5 6 85.7 35 74.5 1 14.3 <0.01*
31-45 5 16.1 11 64.7 26 83.9 6 35.3 <0.01
* Fisher’s exact test.
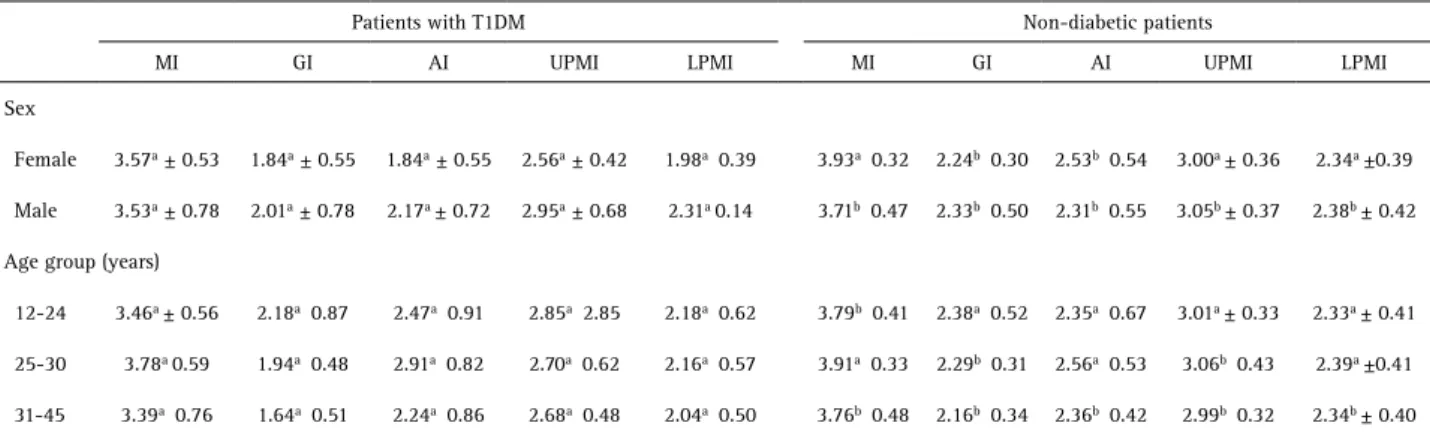
Table 2. Means and standard deviations for MI, GI, AI, UPMI and LPMI of patients with T1DM and non-diabetic, according to sex and age group
Patients with T1DM Non-diabetic patients
MI GI AI UPMI LPMI MI GI AI UPMI LPMI
Sex
Female 3.57a ± 0.53 1.84a ± 0.55 1.84a ± 0.55 2.56a ± 0.42 1.98a 0.39 3.93a 0.32 2.24b 0.30 2.53b 0.54 3.00a ± 0.36 2.34a ±0.39
Male 3.53a ± 0.78 2.01a ± 0.78 2.17a ± 0.72 2.95a ± 0.68 2.31a 0.14 3.71b 0.47 2.33b 0.50 2.31b 0.55 3.05b ± 0.37 2.38b ± 0.42
Age group (years)
12-24 3.46a ± 0.56 2.18a 0.87 2.47a 0.91 2.85a 2.85 2.18a 0.62 3.79b 0.41 2.38a 0.52 2.35a 0.67 3.01a ± 0.33 2.33a ± 0.41
25-30 3.78a 0.59 1.94a 0.48 2.91a 0.82 2.70a 0.62 2.16a 0.57 3.91a 0.33 2.29b 0.31 2.56a 0.53 3.06b 0.43 2.39a ±0.41
31-45 3.39a 0.76 1.64a 0.51 2.24a 0.86 2.68a 0.48 2.04a 0.50 3.76b 0.48 2.16b 0.34 2.36b 0.42 2.99b 0.32 2.34b ± 0.40
F
. I. R. Limeira et al.
statistically significant differences were only observed for T1DM control (p<0.01), in which patients with poor disease control had a significantly higher frequency of mandibular cortical bone alteration (92.3%) (Table 3). Similarly, patients with a poor control of T1DM presented lower values for MI, GI, AI and LPMI when compared to patients with good T1DM control (p<0.05) (Table 4).
Discussion
This study aimed to analyze the mandibular cortical bone morphology of patients with T1DM, through digital panoramic images, and compare them with the ones of non-diabetic individuals. Patients with T1DM had higher frequencies of mandibular cortical alterations. In quantitative analysis, males with T1DM showed lower mean values for all indexes when compared to non-diabetic males. When the morphology of the mandibular cortical bone was analyzed in relation to T1DM history and current status, poor control of diabetes was associated to decrease of the mandibular cortical bone.
Studies have shown that MCI can be used as an indicator of low mandibular BMD, fracture risk and bone remodeling (2,13,16). Researches with different populations assessed their diagnostic capability in relation to DEXA values as reference in the diagnosis of osteoporosis, obtaining satisfactory sensitivity and specificity degrees (17,18). Thus, although based on visual qualitative analysis, the MCI can be used to identify mandibular cortical alterations.
The MI may show signs of BMD alteration, being able to differentiate normal patients from those with osteoporosis (19). Studies claim that individuals with MI lower than 3 mm should be referred to bone densitometry, since they have higher propensity to develop low Table 3. Gross and relative frequencies of patients without and with bone alteration
in individuals with T1DM according to time of diagnosis, blood glucose level, T1DM control and presence of chronic complications
Without alteration With alteration
p value
n % n %
Diagnosis time
Up to 5 years old 4 57.1 3 42.9
0.80
6-10 years old 6 60 4 40
11-15 years old 11 57.9 8 42.1
16-20 years old 6 42.9 8 57.1
Blood fasting glucose level
Within recommended 4 44.4 5 55.6
0.71*
Outside recommended 23 56.1 18 43.9
T1DM control
Good 26a 70.3 11b 29.7
<0.01*
Poor 1a 7.7 12b 92.3
Chronic complications
Yes 14 45.2 13 68.4
0.11
No 13 68.4 6 46.0
* Fisher’s exact test. Different letters indicate statistically significant differences at p ≤0.05.
Table 4. Means and standard deviation for MI, GI, AI, UPMI and LPMI of patients with T1DM, according to time of diagnosis, blood glucose level, T1DM control and chronic complications presence
Patients with T1DM
MI GI AI UPMI LPMI
Diagnosis time
Up to 5 years old 3.22 ± 0.55 2.31 ± 1.01 2.51 ± 0.96 2.65 ± 0.31 1.90 ± 0.32 6-10 years old 3.68 ± 0.49 1.95 ± 0.78 2.60 ± 0.99 2.89 ± 0.73 2.31 ± 0.66 11-15 years old 3.59 ± 0.54 1.90 ± 0.51 2.57 ± 0.80 2.87 ± 0.57 2.27 ± 0.56 16-20 years old 3.58 ± 0.90 1.72 ± 0.52 2.52 ± 1.01 2.51 ± 0.57 1.92 ± 0.53
p value 0.53 0.31 0.99 0.28 0.16
Blood glucose level
Within Recommended 3.45 ± 0.58 1.89 ± 0.80 2.46 ± 0.95 2.60 ± 0.37 2.01 ± 0.41 Outside Recommended 3.57 ± 0.67 1.92 ± 0.64 2.57 ± 0.89 2.77 ± 0.62 2.15 ± 0.59
p value 0.59 0.90 0.74 0.44 0.48
T1DM control
Good 3.70 ± 0.59 2.07 ± 0.68 2.73 ± 0.91 2.82 ± 0.61 2.23 ± 0.57
Poor 3.11 ± 0.63 1.50 ± 0.39 2.05 ± 0.66 2.52 ± 0.43 1.84 ± 0.42
p value <0.01* <0.01* 0.01* 0.11 0.03*
Chronic complications presence
Yes 3.54 ± 0.73 1.79 ± 0.63 2.55 ± 0.93 2.59 ± 0.54 2.03 ± 0.53
No 3.57 ± 0.52 2.12 ± 0.68 2.56 ± 0.87 2.98 ± 0.57 2.30 ± 0.59
p value 0.84 0.09 0.94 0.02* 0.10
Mandibular cortical in patients with T1DM
BMD (18,4). Statistically significant differences were not observed between the analyzed groups. Measures ranged from 3 to 4 mm, values that are within normal limits. Xie et al. (14) suggested that bone thickness lower than 1 mm for GI should be interpreted as radiographic evidence of metabolic bone loss. Although significant differences have been found between groups, their means were above 1 mm. This divergence may be result of methodological differences or difficulties in measuring the exact location. The AI also presented a significantly higher mean value in the healthy individuals group compared to the low BMD group, being able to show mandibular bone mass loss (20). There is no consensus in literature about the use of UPMI and LPMI. Some studies have found no association between their measurements and BMD alterations (20,13). On the other hand, Mahl et al. (21) showed excellent sensitivity of these indexes in BMD loss diagnosis, recommending its use.
Patients with poor control of T1DM had significantly higher frequency of mandibular cortical bone alteration as well as lower values for quantitative measurements. Nemtoi et al. (22) evaluated bone quantity and quality of the posterior region of the mandible of patients com DM, using the cone beam computed tomography. They also observed association between bone quality and values of HbA1c, with inverse correlation between the values of cortical and trabecular bone density and HbA1c.
T1DM leads to increased bone fragility, modulating osteoblasts differentiation and activity, causing disturbances in osteocytes and osteoblasts signaling and causing Advanced Glycation End-products (AGEs) formation in the bone matrix (9). T1DM poor metabolic control and larger time of diagnosis may have detrimental effect on bone growth and mineralization (23).
Studies have shown that bone marker abnormalities may predict osteoporosis and fractures in association with T1DM control. Larger bone alterations observed in individuals with poor control of T1DM in this study may be associated with evidence that there is inverse correlation between HbA1c levels and osteocalcin. Poor T1DM metabolic control leads to osteocalcin levels decrease, with consequent decrease in osteoblast activity, influencing bone metabolism (23,24).
We consider that the fact that the sample had been obtained by convenience with a broad age range and that the analyzed individuals had not been subjected to DEXA were limitations of this study.
Studies investigating mandible bone alterations as a result of T1DM require significant advances. Therefore, longitudinal studies are needed, with methodology including the use of radiomorphometry, DEXA, bone metabolism biomarkers and computed tomography. It is worth emphasize that other factors associated with bone alterations should be studied together, such as genetics,
hormonal function, diet, physical activity and environment. In conclusion, patients with T1DM showed mandibular cortical bone decrease when compared to non-diabetic individuals. Decrease of the mandibular cortical bone was associated with the poor control of T1DM.
Resumo
Neste estudo, nós analisamos a cortical óssea mandibular de pacientes com Diabetes Mellitus tipo 1 (DM1) e não diabéticos. Foram analisados 50 pacientes com DM1 e 100 não diabéticos, pareados por idade e sexo. Dois observadores com duplo-mascaramento avaliaram 150 imagens panorâmicas digitais de ambos os grupos. A cortical óssea mandibular foi analisada por meio do Índice Cortical Mandibular (ICM), Índice Mental (IM), Índice Goníaco (IG), Índice Antegoníaco (IA) e os Índices Panorâmicos Mandibulares Superior (IPMS) e Inferior (IPMI), com o auxílio do software RADIOIMP®. A influência do DM1 na morfologia da
cortical óssea mandibular foi analisada com base na obtenção de dados relacionados ao tempo de diagnóstico do DM1, nível de glicemia, controle do DM1 e presença de complicações crônicas. Os dados coletados foram submetidos a análises descritivas (média e desvio-padrão) e inferenciais (teste de Qui-quadrado de Pearson e teste exato de Fisher) (p ≤0,05). De
acordo com o ICM, indivíduos com DM1 apresentaram maiores frequências de alterações corticais mandibulares, em ambos os sexos e todas faixas etárias (p <0,01). Para os índices quantitativos, IM, IG, IA, IPMS e IPMI, pacientes do sexo feminino apresentaram diferença estatisticamente significativa para os IG e IA, enquanto os pacientes do sexo masculino mostraram diferenças estatisticamente significativas para todos os índices (p <0,05), tendo os indivíduos com DM1 medidas inferiores. Indivíduos com controle ruim do DM1 apresentaram frequência de alteração na cortical mandibular significativamente maior (92,3%), com menores médias para o IM, IG, IA e IPMI (p ≤0,05). Em conclusão, pacientes com DM1 apresentaram diminuição na cortical óssea mandibular quando comparados aos não diabéticos, indicando que o controle ruim da doença está associado a essas alterações.
Acknowledgements
The authors want to thank the Coordenação de Aperfeiçoamento de Pessoal de Nível Superior (CAPES) for the financial support, and the direction of Hospital Universitário Alcides Carneiro, of Universidade Federal de Campina Grande, for allowing an important part of this research.
References
1. Celenk C, Celenk P. Relationship of mandibular and cervical vertebral bone density using computed tomography. Dentomaxillofac Radiol 2008;37:47-51.
2. Klemetti E, Kolmakov S, Kroger H. Pantomography in assessment of the osteoporosis risk group. Scand J Dent Res 1994;102:68-72.
3. Dutra V, Devlin H, Susin C, Yang J, Horner K, Fernandes AR. Mandibular morphological changes in low bone mass edentulous females: evaluation of panoramic radiographs. Oral Surg Oral Med Oral Pathol Oral Radiol Endod 2006;102:663–668.
4. Dagistan S, Bilge OM. Comparison of antegonial index, mental index, panoramic mandibular index and mandibular cortical index values in the panoramic radiographs of normal males and male patients with osteoporosis. Dentomaxillofac Radiol 2010;39:290-294.
5. López-López J, Estrugo-Devesa A, Jane-Salas E, Ayuso-Montero R, Gómez-Vaquero C. Early diagnosis of osteoporosis by means of orthopantomograms and oral x-rays: A systematic review. Med Oral Patol Oral Cir Bucal 2011;16:905-913.
6. American Diabetes Association. Diagnosis and classification of diabetes mellitus. Diabetes Care 2013; 36:S67-74.
F
. I. R. Limeira et al.
Int 2007;18:427-444.
8. Joshi A, Varthakavi P, Chadha P, Bhagwat, N. A study of bone mineral density and its determinants in type 1 Diabetes Mellitus. J Osteoporos 2013;2013:1-8.
9. Khan TS, Fraser LA. Type 1 Diabetes and Osteoporosis: From molecular pathways to bone phenotype. J Osteoporos 2015;2015:1-8.
10. Valerio CS, Trindade AM, Mazzieiro ET, Amaral TP, Manzi FR. Use of digital panoramic radiography as an auxiliary means of low bone mineral density detection in post-menopausal women. Dentomaxillofac Radiol 2013;42:20120059.
11. Othman HI, Ouda SA. Mandibular radiomorphometric measurements as indicators of possible osteoporosis in celiac patients. JKAU: Med Sci 2010;17:21-35.
12. Apolinário AC, Sindeaux R, de Souza Figueiredo PT, Guimarães AT, Acevedo AC, Castro LC, et al. Dental panoramic indices and fractal dimension measurements in osteogenesis imperfecta children under pamidronate treatment. Dentomaxillofac Radiol 2016;45:20150400. 13. Ledgerton D, Horner K, Devlin H, Worthington H. Radiomorphometric
indices of the mandible in a British female population. Dentomaxillofacial Radiology 1999;3:173-181.
14. Xie Q, Wolf J, Tilvis R, Ainamo A. Resorption of mandibular canal wall in the edentulous aged population. J Prosth Dent 1997;77:596-600. 15. Benson BW, Prihoda TJ, Glass BJ. Variations in adult cortical bone mass
as measured by a panoramic mandibular index. Oral Surg Oral Med Oral Pathol 1991;71:349-356.
16. Al-Dam A, Blake F, Atac A, AmLing M, Blessmann M, Assaf A, et al. Mandibular cortical shape index in non-standardised panoramic radiographs for identifying patients with osteoporosis as defined by the German Osteology Organization. J Craniomaxillofac Surg 2013;41:165-169
17. Halling A, Persson GR, Berglund J, Johansson O, Renvert S. Comparison between the Klemetti index and heel DXA BMD measurements in
the diagnosis of reduced skeletal bone mineral density in the elderly. Osteoporos Int 2005;16:999-1003.
18. Taguchi A, Tsuda M, Ohtsuka M, Kodama I, Sanada M, Nakamoto T, et al. Use of dental panoramic radiographs in identifying younger postmenopausal women with osteoporosis. Osteoporos Int 2006;17:387-394.
19. Leite AF, Figueiredo PTS, Barra FR , Melo NS, Paula AP. Relationships between mandibular cortical indexes, bone mineral density, and osteoporotic fractures in Brazilian men over 60 years old. Oral Surg Oral Med Oral Pathol Oral Radiol Endod 2011;112:648-656.
20. Ledgerton D, Horner K, Devlin H, Worthington H. Panoramic mandibular index as a radiomorphometric tool: an assessment of precision. Dentomaxillofac Radiol 1997;26:95-100.
21. Mahl CRW, Licks R, Fontanella VRC. Comparison of morphometric indices obtained from dental panoramic radiography for identifying individuals with osteoporosis/osteopenia. Radiol Bras 2008;41:183-187.
22. Nemtoi A, Ladunca O, Dragan E, Budacu C, Mihai C, Haba D. Quantitative and qualitative bone assessment of the posterior mandible in patients with diabetes mellitus: a cone beam computed tomography study. Rev Med Chir Soc Med Nat Iasi 2013;117:1002-1008.
23. Maddaloni E, D’Onofrio L, Lauria A, Maurizi AR, Strollo R, Palermo A, et al. Osteocalcin levels are inversely associated with Hba1c and BMI in adult subjects with long-standing type 1 diabetes. J Endocrinol Invest 2014;37:661-6.
24. Simmons JH, Raines M, Ness KD, Hall R, Gebretsadik T, Mohan S, Spagnoli A. Metabolic control and bone health in adolescents with type 1 diabetes. Int J Pediatr Endocrinol 2011;2011:13.