Investigating Tissue Optical Properties and
Texture Descriptors of the Retina in Patients
with Multiple Sclerosis
Boglárka EnikőVarga1, Wei Gao2, Kornélia Lenke Laurik1, Erika Tátrai1, Magdolna Simó3, Gábor Márk Somfai1,2, Delia Cabrera DeBuc2
*
1Department of Ophthalmology, Faculty of Medicine, Semmelweis University, Budapest, Hungary,
2Bascom Palmer Eye Institute, University of Miami, Miller School of Medicine, Miami, Florida, United States of America,3Department of Neurology, Faculty of Medicine, Semmelweis University, Budapest, Hungary *[email protected]
Abstract
Purpose
To assess the differences in texture descriptors and optical properties of retinal tissue layers in patients with multiple sclerosis (MS) and to evaluate their usefulness in the detection of neurodegenerative changes using optical coherence tomography (OCT) image
segmentation.
Patients and Methods
38 patients with MS were examined using Stratus OCT. The raw macular OCT data were exported and processed using OCTRIMA software. The enrolled eyes were divided into two groups, based on the presence of optic neuritis (ON) in the history (MSON+ group, n = 36 and MSON- group, n = 31). Data of 29 eyes of 24 healthy subjects (H) were used as con-trols. A total of seven intraretinal layers were segmented and thickness as well as optical parameters such as contrast, fractal dimension, layer index and total reflectance were mea-sured. Mixed-model ANOVA analysis was used for statistical comparisons.
Results
Significant thinning of the retinal nerve fiber layer (RNFL), ganglion cell/inner plexiform layer complex (GCL+IPL) and ganglion cell complex (GCC, RNFL+GCL+IPL) was observed between study groups in all comparisons. Significant difference was found in contrast in the RNFL, GCL+IPL, GCC, inner nuclear layer (INL) and outer plexiform layer when comparing MSON+ to the other groups. Higher fractal dimension values were observed in GCL+IPL and INL layers when comparing H vs. MSON+ groups. A significant difference was found in layer index in the RNFL, GCL+IPL and GCC layers in all comparisons. A significant differ-ence was observed in total reflectance in the RNFL, GCL+IPL and GCC layers between the three examination groups.
OPEN ACCESS
Citation:Varga BE, Gao W, Laurik KL, Tátrai E, Simó M, Somfai GM, et al. (2015) Investigating Tissue Optical Properties and Texture Descriptors of the Retina in Patients with Multiple Sclerosis. PLoS ONE 10(11): e0143711. doi:10.1371/journal. pone.0143711
Editor:Knut Stieger, Justus-Liebig-University Giessen, GERMANY
Received:October 24, 2014
Accepted:November 9, 2015
Published:November 30, 2015
Copyright:© 2015 Varga et al. This is an open access article distributed under the terms of the
Creative Commons Attribution License, which permits unrestricted use, distribution, and reproduction in any medium, provided the original author and source are credited.
Data Availability Statement:All relevant data are within the paper and its Supporting Information files.
Conclusion
Texture and optical properties of the retinal tissue undergo pronounced changes in MS even without optic neuritis. Our results may help to further improve the diagnostic efficacy of OCT in MS and neurodegeneration.
Introduction
Multiple sclerosis (MS) is a neurodegenerative disorder, a chronic inflammatory process that affects the central nervous system (CNS) by the demyelination of axons of the brain and spinal cord. It is the most common disease of the CNS that causes permanent disability in young adults. [1] The non-myelinated parts of the axons of the retinal ganglion cells, the retinal nerve fiber layer (RNFL) provides an optimal opportunity to examine the neuronal loss caused by demyelination.
Optical coherence tomography (OCT) is a non-invasive, non-contact, high-resolution imaging modality that is capable of capturing cross-sectional images of the retina. [2] It is based on the optical reflectance differences of the analyzed tissue and thus it may be applied in the detection of pathological retinal changes. [3] OCT technology has gained very wide use in ophthalmology and it is stipulated that it is one of the most frequently used decision making techniques in the field. [4] The use of custom-built algorithms for the segmentation of retinal OCT images may enable the detection and follow-up of early neural loss in patients with MS. [5–8] It has also been postulated that the inner nuclear layer (INL) is possibly also involved in the pathological processes in MS, with different observations describing microcystic edema of the INL and also the thickness changes of the INL. [9,10]
Although thickness differences may discern regions with signs of retinal disease from nor-mal regions, differences in texture descriptors of nornor-mal and abnornor-mal retinal tissue may also provide additional information of disease development. In fact, the appropriateness of texture to classify tissues in OCT images has been shown in previous studies. [11] By analyzing the spatial arrangement of color or intensities in an image or selected region of interest (ROI), the image irregularities can be measured. Consequently, texture features, such as contrast and frac-tal dimension could be analyzed for the macula and each intraretinal layer. The fracfrac-tal dimen-sion (FD) of a profile or surface is a roughness measure regarded as a local property of the system with higher values indicating rougher surface. [12] There are different methods to determine the FD. The typical conventional approach used to calculate the fractal dimension of an image is the box-counting method but the power spectrum method is demonstrated to be more robust. [13,14]
Finally, as mentioned above, the most common parameter investigated during the OCT examination is retinal thickness. In reality, reflectance is the direct measurement from which thickness is calculated in OCT systems. The human retina is an almost transparent tissue that only reflects about 1% of the incident light. [15] Retinal tissue is characterized by many small random fluctuations in refractive index caused by the ultrastructure of the tissue. [16] As a con-sequence, incident light on tissue is deflected or scattered off this structure. Therefore, differ-ences in optical properties of normal and abnormal retinal tissue may also provide additional information of disease development in pathological eyes allowing OCT technology to be used for quantitative analysis of tissue optical properties. [17–19] Accordingly, Bizheva et al have shown previously that optical properties of the retina may change due to their metabolic activ-ity. They were using optical coherence tomography for this purpose and named the method
(unrestricted grant to the University of Miami, DCD)); Hungarian Academy of Sciences, Zsigmond Diabetes Fund (http://mta.hu/english/(GMS)); Hungarian Scholarship Fund, Eötvös Scholarship (http://www. scholarship.hu/(GMS)). The funders had no role in study design, data collection and analysis, decision to publish, or preparation of the manuscript. This work was also supported by Helen Keller Foundation for Research and Education (http://www.
helenkellerfoundation.org/(GMS)). Also, the authors declare that this funder also had no role in study design, data collection and analysis, decision to publish, or preparation of the manuscript.
optophysiology. [20] Huang et al. have shown the early changes of reflectance of the RNFL in a rat model of glaucoma preceding the pathological changes in the retina. [21] We have shown previously that diabetes not only causes thinning of the inner retinal layers, but also reduces the amplitude of the back-reflected signal from these layers. [22,23] Consequently, diagnostic predictors based on reflectance changes may be of interest in multiple sclerosis as well where pathological processes of the inner retina have been well described previously.
In this study, the differences in texture and optical properties of the retinal tissue in patients with MS compared to healthy subjects are evaluated using OCT image segmentation in order to investigate their usefulness in the detection of retinal neurodegenerative changes. Significant differences in the nerve fiber layer and the ganglion cell/plexiform layer complex are observed in MS patients compared to healthy subjects and in eyes affected by optic neuritis compared to those unaffected. Our findings may help to further improve the diagnostic efficacy of OCT in MS and neurodegeneration.
Patients and Methods
Study Population and examinations
All participants were treated in accordance with the tenets of the Declaration of Helsinki. Insti-tutional Review Board approval was obtained for all study protocols (Semmelweis University Regional and Institutional Committee of Sciences and Research Ethics). Written informed con-sent was obtained from all participants in this study. Thirty-eight patients with relapsing-remitting multiple sclerosis were enrolled from the Department of Neurology of Semmelweis University. The clinical data, including disease duration, medical treatment and the date of MSON episodes was compiled as part of a complete neurological examination performed by a board-certified neurologist. Based on the neurological, functional, elecrophysiological, radio-logical and laboratory examinations, all ON episodes were diagnosed as MS associated ON and all patients were meeting the revised McDonald criteria. [24] The control group (H) was made of twenty-nine randomly selected eyes of twenty-four age-matched healthy controls.
Each subject underwent routine ophthalmic examination including best corrected visual acuity measurement, applanation tonometry, critical flicker frequency assessment (CFF) and slit-lamp examination. All study subjects were assessed by the same, expert and trained opera-tor with a Stratus OCT device (Carl Zeiss Meditec Inc., Dublin, CA, USA) using the“macular map protocol”, which consists of six fovea centered scan lines in radial directions, each having a 6 mm transverse length. One study eye per each patient was selected randomly.
In order to ensure quality control of the OCT scans included and segmented in the study, we used the scan quality factor (SQF) criteria in OCTRIMA for checking the scan variance using the foveal center point thickness as reported previosuly [25] and also adapted the OSCAR-IB system described by Tewarie at al. [26]
The scan quality factor (SQF) is based on the standard deviation calculation (in percent) of the center point thickness (CPT) for the six radial line scans included in the OCTRIMA soft-ware and is used to control the variability of measurements associated to image acquisition pit-falls. A high standard deviation (>10% of center point thickness) means high variability,
usually due to patient movement or boundary line error, thus leading to incorrect center point thickness values. [25,27] We only included scans with a SQF = 1, indicating that the percent-age standard deviation of the foveal center point was10%.
Furthermore, using the OSCAR-IB system the following details were observed and evaluated on each set of scans to be included in the study: Obvious problems not covered by items below; Sufficient OCT Signal (SS>6, [25]); Foveal centered scans (as a second pass of quality control);
and Measurement beam placed centrally (no tilting of the B-scans). The exclusion criteria were similar to those applied by Tewarie et al., including the following: (1) spherical or cylindrical cor-rection higher than 3.0 diopters, (2) the presence of any media opacities (corneal pathologies, cat-aract, floaters, etc.) (3) the presence of any retinal disease or optic neuropathy including
glaucoma, except ON, (4) intraocular pressure higher than 20 mmHg in the medical history, (5) previous eye surgery, (6) amblyopia, (7) last MSON episode less than 6 months prior to enroll-ment, (8) bad fixation cooperation during the OCT examination (e.g. due to nystagmus) and (9) low signal strength of the OCT images (SS6). None of the patients were under fingolimod treat-ment before and during the examination period. [28] As in previous TD-OCT studies [29–31] where highly repeatable measurements have been obtained with signal intensity scores of at least 6 to 7, we excluded images with signal strength SS6 as we have previously shown this is the threshold for repeatable segmentation analysis with OCTRIMA. [25]
The eligibility criteria for control subjects were best-corrected Snellen visual acuity of 20/20 and the lack of any ocular or systemic diseases, with good quality OCT scans as described above.
OCT image processing
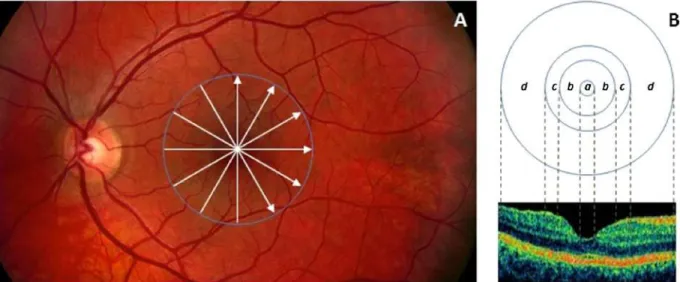
The radial scans were exported and processed by a custom-built software (OCTRIMA) devel-oped by Cabrera et al. [6]. This OCT image segmentation program is capable of segmenting 7 cellular layers of the retina based on their optical densities (seeFig 1): the RNFL, the ganglion cell and inner plexiform layer complex (GCL+IPL), the INL, the outer plexiform layer (OPL), the outer nuclear layer and inner photoreceptor segment (ONL+IS), outer photoreceptor seg-ment (OS) and retinal pigseg-ment epithelium (RPE). [6] Because of the special arrangeseg-ment of the retinal structure below the foveal pit where the inner retinal layers are displaced concentrally,
the segmentation of the foveolar region was limited to the three outer retinal layers (ONL+IS, OS, RPE).
The OCTRIMA software integrates a denoising and edge enhancement technique (also removing the speckle noise) along with a segmentation algorithm. [6] In our previous works the high repeatability and reproducibility of OCTRIMA measurements in healthy subjects was found. The reproducibility was the highest for the thickness measurements of the ONL, gan-glion cell complex (GCC, composed by the RNFL and GCL+IPL), GCL+IPL and RNFL, the inter- and intraexaminer, intervisit variabilities being around the resolution of currently avail-able OCT devices for all layers (<6μm for all layers and all comparisons). [25] It is of note that
total retinal thickness is measured between the inner limiting membrane and the inner bound-ary of the photoreceptor outer segment/RPE junction by this software. It is also important to mention that ONL is a thin membrane, which contains both the external limiting membrane and the inner segment of the photoreceptors. This layer cannot be visualized clearly in Stratus OCT images which makes the segmentation of the inner segment more difficult. Thus, the seg-mentation of this layer does not reflect the actual anatomic structure.
The eyes of the MS patients were divided into two study groups for further analyses. The first group was composed of 36 eyes, which had MS-associated ON at least 6 months prior to enrollment (MSON+). 31 eyes without ON episode (MSON-) in the history formed the second group. The diagnosis of optic neuritis was based on the patient's medical history. An acute epi-sode of MSON was defined by clinical symptoms such as decreased visual acuity developing in few days, pain on eye movement, abnormal response on visual evoked potential examination confirming prechiasmal lesion and decrease in the CFF. The CFF is a basic examination of optic nerve function, and plays an important role in the diagnosis and also in the follow-up of ON. Decreased CFF is a common characteristic of an acute ON episode, and it also can be affected after the recovery both of which can help to establish the diagnosis of ON. In most cases a good recovery was observed within 2–3 months. In the subjects with ON appearing as a first symptom, routine MRI examinations showed characteristic signs of MS and confirmed the diagnosis. Demographic and clinical characteristics including age, gender, duration of dis-ease, elapsed time between the last MSON episode and OCT examination and best corrected visual acuity are shown inTable 1.
Retinal layer thickness, texture and optical measurements on OCT
images
In order to evaluate the diagnostic power of optical properties and texture descriptors com-pared to standard thickness measurements, mean thickness values per intraretinal layer were
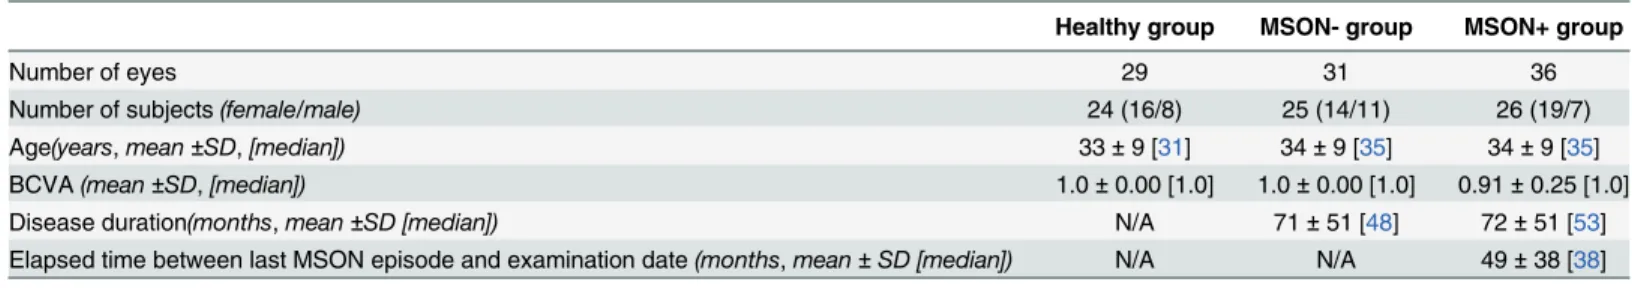
Table 1. Descriptive statistics of the study participants.
Healthy group MSON- group MSON+ group
Number of eyes 29 31 36
Number of subjects(female/male) 24 (16/8) 25 (14/11) 26 (19/7)
Age(years,mean±SD,[median]) 33±9 [31] 34±9 [35] 34±9 [35] BCVA(mean±SD,[median]) 1.0±0.00 [1.0] 1.0±0.00 [1.0] 0.91±0.25 [1.0]
Disease duration(months,mean±SD [median]) N/A 71±51 [48] 72±51 [53]
Elapsed time between last MSON episode and examination date(months,mean±SD [median]) N/A N/A 49±38 [38] Abbreviations: SD (standard deviation); H (Healthy subjects group); MSON- (eyes of patients with multiple sclerosis without optic neuritis in medical history); MSON+ (eyes of patients with multiple sclerosis with optic neuritis in medical history); BCVA (best corrected visual acuity).
extracted by computation of the mean distance between the borders of each layer. We note that we removed the noise first and then performed the processing so that noise effect could be nul-lified. Therefore, all calculations were performed after removing the speckle noise from raw OCT data using a complex diffusion filter. [6] We also note that factors extrinsic to the retina, such as media opacity, poor focusing, and scanning pitfalls, were removed by taking the ratio of the average reflectivity signal within the retina and each intraretinal layers and dividing it by the average reflectivity signal from a reference layer. Accordingly, the analyses performed using parameters based on optical properties and tissue descriptors considered mean reflectivity val-ues that were calculated using reflectivity with normalization to the RPE reflectance (NRPE). [32] The mean values were calculated to each layer across the six radial OCT scans. [33]
A method based on the power spectrum was used to calculate the fractal dimension in OCT images. [14] Since the average power spectrum of an image obeys a power law scaling, the frac-tal dimension was calculated from the power law detected in the graph of the power spectrum as a function of the frequency in the Fourier transform of the OCT image (gray scale). In this particular case, when the graph is plotted in a log-log scale the curve is approximately similar to a straight line and the dimension is provided by the slope of the line.
The fast Fourier transform (FFT) was applied to the OCT reflectance’s profiles to obtain the power spectrum as follows:
PðoÞ o b ð
1Þ
where P(ω) is the power spectrum with the frequencyω.βis the spectral exponent of the refl
ec-tance profile. The Eq (1) can be converted into:
lnðPðoÞÞ blnðoÞ ð2Þ
The fractal dimension is linked to the power-law exponent by the following relationship: [14]
FD¼5 b
2 ð3Þ
Therefore, the fractal dimension was evaluated from the slopeβof a least-square regression line fit to the data points in log-log plot of power spectrum. The fractal dimension was calcu-lated for the reflectance profile within each intraretinal layer for each A-scan. The mean value of the fractal dimension was calculated by averaging the fractal dimension measurements across all A-scans in each macular region of each intraretinal layer. MATLAB software (The Mathworks, Natick, MA) was used to perform the fractal dimension analysis using a custom-built algorithm. Contrast measures were extracted by using second-order statistical texture analysis.
Optical properties such as total reflectance and layer index has been described previously and calculated as follows. [23,33,34] Total reflectanceTRkwas calculated by summarizing reflectivity values of the elements in the columnkof the selected ROI.
TRk¼MRk
Hk
Dy ð4Þ
Layer indexLIkwas defined as:
LIk¼MRk
Hk
Isa ¼ 1
Nk XNk
j¼1
Ij;k
Hk
Isa ð5Þ
whereMRkis the mean reflectance in the columnkof the selected ROI,Hkis the local thickness of ROI in the column ofk.Isais the reflectivity value representing the99%of all recorded reflectivity values in a given retinal OCT image.
It is worth to note that before the calculation of parameters related to reflectance values, the lateral coordinates of the blood vessel shadows were obtained by the help of a blood vessel shadowgram technique and were removed in each OCT image. [35] Following this, these shadows were removed in each OCT image before calculating the values for reflectance. Total reflectance values included average values of reflectance with normalization to the RPE reflectance (NRPE). Average values of total reflectance per intraretinal layer were calculated. Total reflectance values were converted to decibels (dB = 10 ×log10 [TR]). Layer index parameter was based on the mean reflectance corrected to the thickness of the region of interest and the 99% of the total reflectance of the scan (see details above andEq 5). [18] All calculated values were expressed in the foveolar, foveal, parafoveal and perifoveal regions and also as a mean across all macular regions. (Fig 2.) In the foveolar region, the calculations were limited to the outer retinal layers (OPL+IS, OS, RPE). For the analyses an additional composite layer was defined, the GCC consisting of the RNFL and GCL+IPL layers with the purpose to observe the changes of the whole ganglion cell with its proximal and distal denrites.
Statistical analyses
In order to correct for inter-eye bias, mixed model ANOVA analysis was used for the compari-son of thickness and optical parameters among the groups. Statistical analyses were performed using the software package SPSS version 16 (SPSS Inc, Chicago, Illinois). A modified p value (p<0.001) was considered as statistically significant.
Fig 2. Retinal scanning and macular regions used in the study.(A) The fundus image of a healthy eye. The white arrows in the macula show the locations of the OCT scans made. (B) The distribution of macular regions: foveolar region (a) with the diameter of 0.375 mm, foveal region (b) with a diameter of 1.85 mm; parafoveal region (c) with a diameter of 2.85 mm and perifoveal region (d) with a diameter of 5.85 mm.
Results
Thickness
The thinning of the RNFL, GCL+IPL and also GCC was significant in all comparisons in each macular region except the foveal region. In the foveal region significant difference was observed in GCC between H, MSON- and MSON+ groups, in RNFL between H and MSON+, and GCL+IPL in MSON+ compared to the others. (Table 2.)
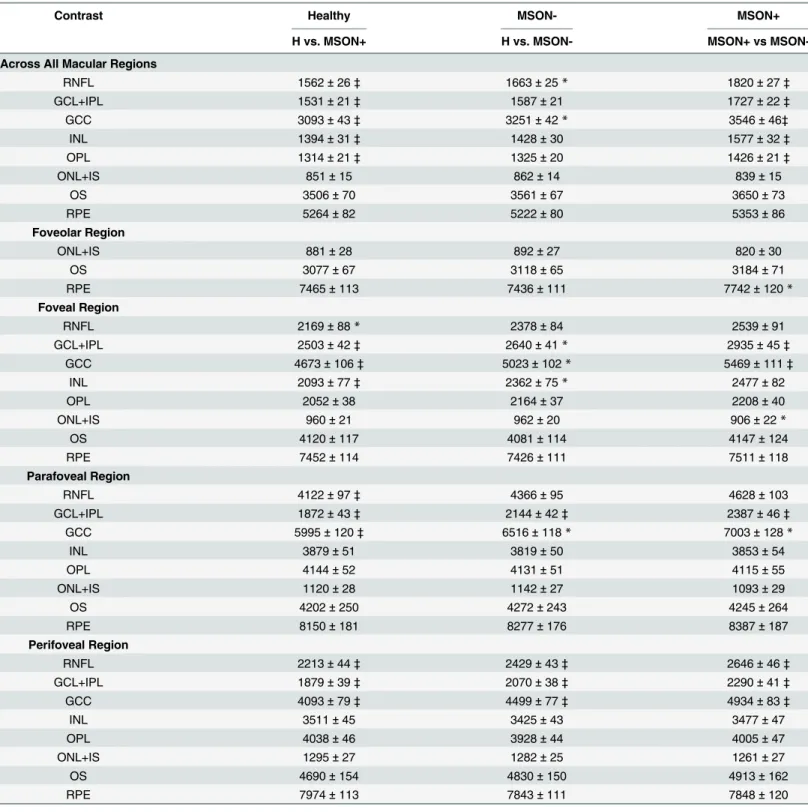
Contrast
Significantly higher contrast values were observed in the MSON+ group compared to the H and MSON- groups in the RNFL, GCL+IPL, INL, OPL and GCC layers, in the whole macular region. A significant difference was found in the foveal region between MSON+ and the two other groups in the GCL+IPL and GCC, similarly to the INL in the MSON+ versus the healthy group. The GCL+IPL was significantly different between the three groups in the parafoveal region, and so was the RNFL and GCC in the MSON+ vs. H comparison. The perifoveal region showed a significant difference between the three groups in the RNFL, GCL+IPL and GCC lay-ers. (Table 3.)
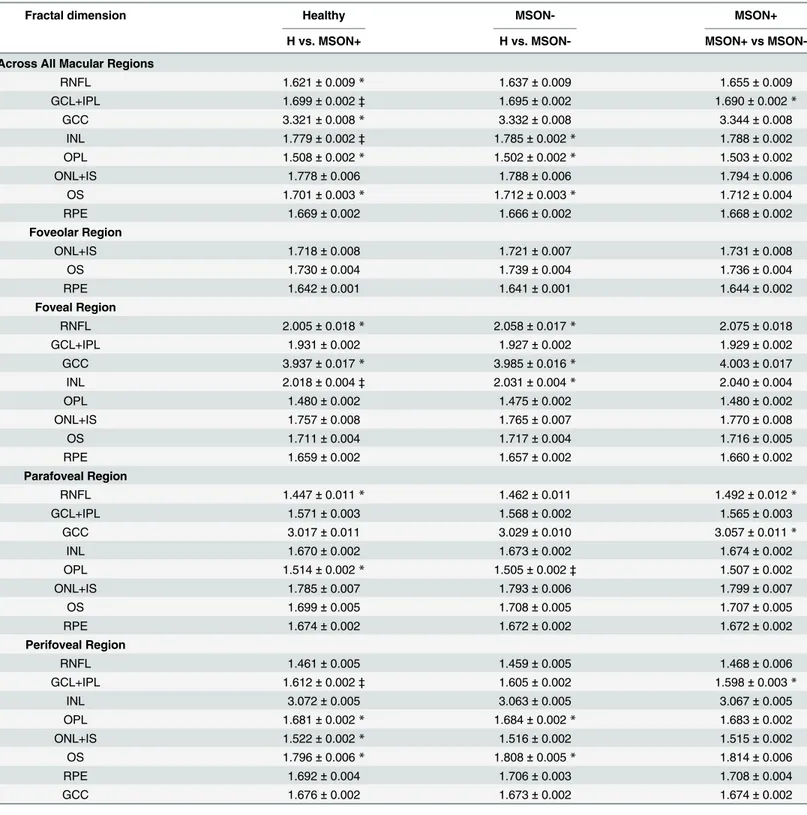
Fractal dimension
Fractal dimension was significantly higher in the MSON+ group compared to the H and MSON- groups in the GCL+IPL and INL in the whole macular region, in the INL in the foveal and in the GCL+IPL in the perifoveal regions. Also, a significant difference was found in the OPL between the H and MSON- groups in the parafoveal region. There were no significant dif-ferences found in any other layers in other comparisons. (Table 4.)
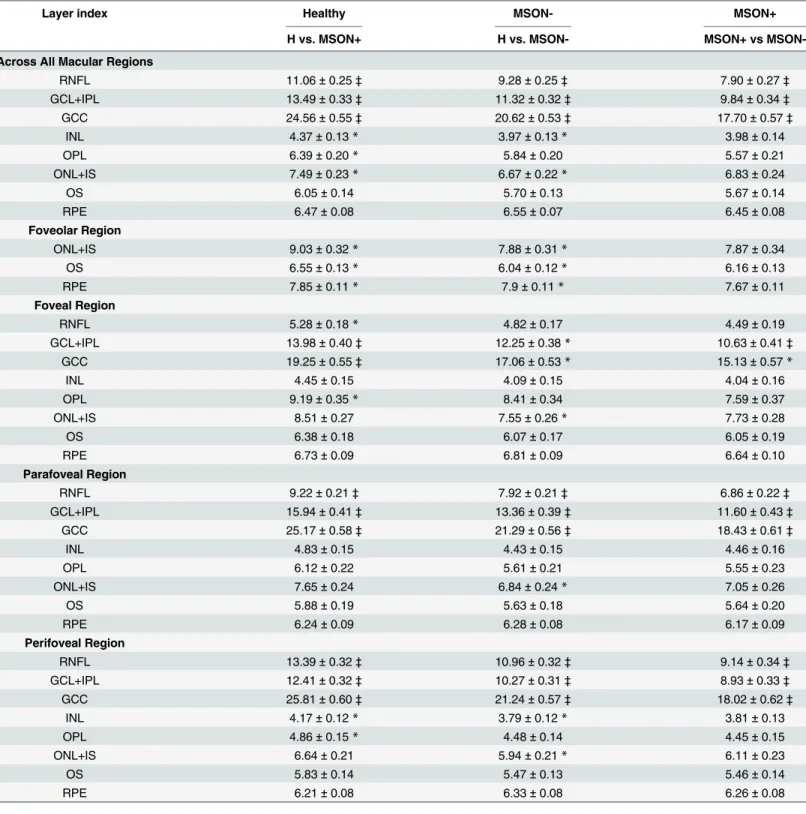
Layer index
The layer index values were significantly lower in the MSON- and MSON+ groups compared to the healthy controls, and also in the MSON+ versus MSON- comparisons in the RNFL, GCL+IPL and GCC in the whole macular, parafoveal and perifoveal regions. In the foveal region the GCL+IPL was significantly thinner in MSON+ compared to the other two groups, and the same was observed for the GCC in the MSON+ and H groups. (Table 5.)
Total reflectance
The total reflectance was found significantly different in the RNFL and GCC in both disease groups in the whole macular, the parafoveal and perifoveal regions, and the same was true for the GCL+IPL between the three groups in the parafoveal and perifoveal regions. In the foveal region a significant difference was observed in GCL+ IPL in MSON+ compared to the other groups, and also in the GCC complex for the comparison between the MSON+ and H groups. (Table 6.)
Discussion
Table 2. Distribution statistics of the thickness (μm) of intraretinal layers by study group, represented as means±SD.
Thickness Healthy MSON- MSON+
H vs. MSON+ H vs. MSON- MSON+ vs
MSON-Across All Macular Regions
RNFL 38.16±0.55‡ 35.44±0.54‡ 32.32±0.54‡
GCL+IPL 76.06±1.44‡ 67.87±1.40‡ 58.1±1.40‡
GCC 114.23±1.85‡ 103.28±1.80‡ 90.45±1.95‡
INL 35.19±0.35 35.38±0.35 35.26±0.36
OPL 41.70±0.58* 41.58±0.55 39.92±0.59*
ONL+IS 86.23±1.21* 88.20±1.11 89.62±1.19
OS 16.48±0.59 16.58±0.57 16.28±0.62
RPE 13.15±0.18 13.58±0.17 13.21±0.19
Foveolar Region
ONL+IS 123.55±1.79 124.46±1.65 123.57±1.76
OS 26.02±0.62 25.93±0.60 25.21±0.65
RPE 16.10±0.30 16.57±0.28 15.83±0.31*
Foveal Region
RNFL 12.42±0.45‡ 10.60±0.42* 9.7±0.45*
GCL+IPL 51.59±1.04‡ 47.51±1.01* 40.1±1.10‡
GCC 63.92±1.28‡ 58.07±1.24* 49.9±1.34‡
INL 21.00±0.36 20.82±0.34 20.19±0.37
OPL 62.35±1.53* 61.47±1.44 56.34±1.55*
ONL+IS 99.45±1.47* 101.70±1.37 104.43±1.48
OS 18.45±0.79 18.87±0.77 18.73±0.83
RPE 13.41±0.25 13.86±0.25 13.41±0.27
Parafoveal Region
RNFL 34.35±0.53‡ 31.92±0.52‡ 28.96±0.56‡
GCL+IPL 93.66±1.86‡ 82.75±1.81‡ 69.88±1.97‡
GCC 128.03±2.22‡ 114.62±2.16‡ 98.92±2.35‡
INL 39.93±0.47 40.59±0.45 40.48±0.49
OPL 37.51±0.53 37.26±0.51 37.23±0.55
ONL+IS 84.54±1.40* 86.87±1.30 88.44±1.39
OS 14.74±0.72 15.17±0.70 15.04±0.76
RPE 12.64±0.22 12.98±0.21 12.64±0.23
Perifoveal Region
RNFL 43.16±0.69‡ 39.39±0.68‡ 35.6±0.73‡
GCL+IPL 66.28±1.38‡ 58.68±1.33‡ 50.68±1.44‡
GCC 16.48±0.59‡ 98.06±1.79‡ 86.29±1.95‡
INL 38.16±0.55 33.19±0.33 33.04±0.36
OPL 76.06±1.44 31.90±0.27 31.56±0.29
ONL+IS 35.19±0.35 76.50±1.02 77.40±1.10
OS 41.70±0.58 14.57±0.52 14.25±0.56
RPE 86.23±1.21 13.26±0.17 12.93±0.18
Abbreviations: SD (standard deviation); H (Healthy subjects group); MSON- (eyes of patients with multiple sclerosis without optic neuritis in medical history); MSON+ (eyes of patients with multiple sclerosis with optic neuritis in medical history); GCC (ganglion cell complex. the RNFL and GCL+IPL layers together)
*0.001<p<0.05 and
‡p<0.001 (Mixed-model analysis ANOVA) between H and MSON+ (see H column). H and MSON- (see MSON- column) and between MSON- and MSON + (see MSON+ column)
Table 3. Distribution statistics of the contrast (a.u) of intraretinal layers by study group, represented as means±SD.
Contrast Healthy MSON- MSON+
H vs. MSON+ H vs. MSON- MSON+ vs
MSON-Across All Macular Regions
RNFL 1562±26‡ 1663±25* 1820±27‡
GCL+IPL 1531±21‡ 1587±21 1727±22‡
GCC 3093±43‡ 3251±42* 3546±46‡
INL 1394±31‡ 1428±30 1577±32‡
OPL 1314±21‡ 1325±20 1426±21‡
ONL+IS 851±15 862±14 839±15
OS 3506±70 3561±67 3650±73
RPE 5264±82 5222±80 5353±86
Foveolar Region
ONL+IS 881±28 892±27 820±30
OS 3077±67 3118±65 3184±71
RPE 7465±113 7436±111 7742±120*
Foveal Region
RNFL 2169±88* 2378±84 2539±91
GCL+IPL 2503±42‡ 2640±41* 2935±45‡
GCC 4673±106‡ 5023±102* 5469±111‡
INL 2093±77‡ 2362±75* 2477±82
OPL 2052±38 2164±37 2208±40
ONL+IS 960±21 962±20 906±22*
OS 4120±117 4081±114 4147±124
RPE 7452±114 7426±111 7511±118
Parafoveal Region
RNFL 4122±97‡ 4366±95 4628±103
GCL+IPL 1872±43‡ 2144±42‡ 2387±46‡
GCC 5995±120‡ 6516±118* 7003±128*
INL 3879±51 3819±50 3853±54
OPL 4144±52 4131±51 4115±55
ONL+IS 1120±28 1142±27 1093±29
OS 4202±250 4272±243 4245±264
RPE 8150±181 8277±176 8387±187
Perifoveal Region
RNFL 2213±44‡ 2429±43‡ 2646±46‡
GCL+IPL 1879±39‡ 2070±38‡ 2290±41‡
GCC 4093±79‡ 4499±77‡ 4934±83‡
INL 3511±45 3425±43 3477±47
OPL 4038±46 3928±44 4005±47
ONL+IS 1295±27 1282±25 1261±27
OS 4690±154 4830±150 4913±162
RPE 7974±113 7843±111 7848±120
Abbreviations: SD (standard deviation); H (Healthy subjects group); MSON- (eyes of patients with multiple sclerosis without optic neuritis in medical history); MSON+ (eyes of patients with multiple sclerosis with optic neuritis in medical history); GCC (ganglion cell complex. the RNFL and GCL+IPL layers together)
*0.001<p<0.05 and
‡p<0.001 (Mixed-model analysis ANOVA) between H and MSON+ (see H column). H and MSON- (see MSON- column) and between MSON- and MSON + (see MSON+ column)
Table 4. Distribution statistics of the fractal dimension (a.u) of intraretinal layers by study group, represented as means±SD.
Fractal dimension Healthy MSON- MSON+
H vs. MSON+ H vs. MSON- MSON+ vs
MSON-Across All Macular Regions
RNFL 1.621±0.009* 1.637±0.009 1.655±0.009
GCL+IPL 1.699±0.002‡ 1.695±0.002 1.690±0.002*
GCC 3.321±0.008* 3.332±0.008 3.344±0.008
INL 1.779±0.002‡ 1.785±0.002* 1.788±0.002
OPL 1.508±0.002* 1.502±0.002* 1.503±0.002
ONL+IS 1.778±0.006 1.788±0.006 1.794±0.006
OS 1.701±0.003* 1.712±0.003* 1.712±0.004
RPE 1.669±0.002 1.666±0.002 1.668±0.002
Foveolar Region
ONL+IS 1.718±0.008 1.721±0.007 1.731±0.008
OS 1.730±0.004 1.739±0.004 1.736±0.004
RPE 1.642±0.001 1.641±0.001 1.644±0.002
Foveal Region
RNFL 2.005±0.018* 2.058±0.017* 2.075±0.018
GCL+IPL 1.931±0.002 1.927±0.002 1.929±0.002
GCC 3.937±0.017* 3.985±0.016* 4.003±0.017
INL 2.018±0.004‡ 2.031±0.004* 2.040±0.004
OPL 1.480±0.002 1.475±0.002 1.480±0.002
ONL+IS 1.757±0.008 1.765±0.007 1.770±0.008
OS 1.711±0.004 1.717±0.004 1.716±0.005
RPE 1.659±0.002 1.657±0.002 1.660±0.002
Parafoveal Region
RNFL 1.447±0.011* 1.462±0.011 1.492±0.012*
GCL+IPL 1.571±0.003 1.568±0.002 1.565±0.003
GCC 3.017±0.011 3.029±0.010 3.057±0.011*
INL 1.670±0.002 1.673±0.002 1.674±0.002
OPL 1.514±0.002* 1.505±0.002‡ 1.507±0.002
ONL+IS 1.785±0.007 1.793±0.006 1.799±0.007
OS 1.699±0.005 1.708±0.005 1.707±0.005
RPE 1.674±0.002 1.672±0.002 1.672±0.002
Perifoveal Region
RNFL 1.461±0.005 1.459±0.005 1.468±0.006
GCL+IPL 1.612±0.002‡ 1.605±0.002 1.598±0.003*
INL 3.072±0.005 3.063±0.005 3.067±0.005
OPL 1.681±0.002* 1.684±0.002* 1.683±0.002
ONL+IS 1.522±0.002* 1.516±0.002 1.515±0.002
OS 1.796±0.006* 1.808±0.005* 1.814±0.006
RPE 1.692±0.004 1.706±0.003 1.708±0.004
GCC 1.676±0.002 1.673±0.002 1.674±0.002
Abbreviations: SD (standard deviation); H (Healthy subjects group); MSON- (eyes of patients with multiple sclerosis without optic neuritis in medical history); MSON+ (eyes of patients with multiple sclerosis with optic neuritis in medical history); GCC (ganglion cell complex. the RNFL and GCL+IPL layers together)
*0.001<p<0.05 and
‡p<0.001 (Mixed-model analysis ANOVA) between H and MSON+ (see H column). H and MSON- (see MSON- column) and between MSON- and MSON + (see MSON+ column)
Table 5. Distribution statistics of the layer index (a.u) of intraretinal layers by study group, represented as means±SD.
Layer index Healthy MSON- MSON+
H vs. MSON+ H vs. MSON- MSON+ vs
MSON-Across All Macular Regions
RNFL 11.06±0.25‡ 9.28±0.25‡ 7.90±0.27‡
GCL+IPL 13.49±0.33‡ 11.32±0.32‡ 9.84±0.34‡
GCC 24.56±0.55‡ 20.62±0.53‡ 17.70±0.57‡
INL 4.37±0.13* 3.97±0.13* 3.98±0.14
OPL 6.39±0.20* 5.84±0.20 5.57±0.21
ONL+IS 7.49±0.23* 6.67±0.22* 6.83±0.24
OS 6.05±0.14 5.70±0.13 5.67±0.14
RPE 6.47±0.08 6.55±0.07 6.45±0.08
Foveolar Region
ONL+IS 9.03±0.32* 7.88±0.31* 7.87±0.34
OS 6.55±0.13* 6.04±0.12* 6.16±0.13
RPE 7.85±0.11* 7.9±0.11* 7.67±0.11
Foveal Region
RNFL 5.28±0.18* 4.82±0.17 4.49±0.19
GCL+IPL 13.98±0.40‡ 12.25±0.38* 10.63±0.41‡
GCC 19.25±0.55‡ 17.06±0.53* 15.13±0.57*
INL 4.45±0.15 4.09±0.15 4.04±0.16
OPL 9.19±0.35* 8.41±0.34 7.59±0.37
ONL+IS 8.51±0.27 7.55±0.26* 7.73±0.28
OS 6.38±0.18 6.07±0.17 6.05±0.19
RPE 6.73±0.09 6.81±0.09 6.64±0.10
Parafoveal Region
RNFL 9.22±0.21‡ 7.92±0.21‡ 6.86±0.22‡
GCL+IPL 15.94±0.41‡ 13.36±0.39‡ 11.60±0.43‡
GCC 25.17±0.58‡ 21.29±0.56‡ 18.43±0.61‡
INL 4.83±0.15 4.43±0.15 4.46±0.16
OPL 6.12±0.22 5.61±0.21 5.55±0.23
ONL+IS 7.65±0.24 6.84±0.24* 7.05±0.26
OS 5.88±0.19 5.63±0.18 5.64±0.20
RPE 6.24±0.09 6.28±0.08 6.17±0.09
Perifoveal Region
RNFL 13.39±0.32‡ 10.96±0.32‡ 9.14±0.34‡
GCL+IPL 12.41±0.32‡ 10.27±0.31‡ 8.93±0.33‡
GCC 25.81±0.60‡ 21.24±0.57‡ 18.02±0.62‡
INL 4.17±0.12* 3.79±0.12* 3.81±0.13
OPL 4.86±0.15* 4.48±0.14 4.45±0.15
ONL+IS 6.64±0.21 5.94±0.21* 6.11±0.23
OS 5.83±0.14 5.47±0.13 5.46±0.14
RPE 6.21±0.08 6.33±0.08 6.26±0.08
Abbreviations: SD (standard deviation); H (Healthy subjects group); MSON- (eyes of patients with multiple sclerosis without optic neuritis in medical history); MSON+ (eyes of patients with multiple sclerosis with optic neuritis in medical history); GCC (ganglion cell complex. the RNFL and GCL+IPL layers together)
*0.001<p<0.05 and
‡p<0.001 (Mixed-model analysis ANOVA) between H and MSON+ (see H column). H and MSON- (see MSON- column) and between MSON- and MSON + (see MSON+ column)
Table 6. Distribution statistics of the total reflectance (dB) with compensation to RPE layer reflectance of intraretinal layers by study group, repre-sented as means±SD.
Total reflectance Healthy MSON- MSON+
H vs. MSON+ H vs. MSON- MSON+ vs
MSON-Across All Macular Regions
RNFL 21.52±0.26‡ 19.90±0.26‡ 18.54±0.28‡
GCL+IPL 22.50±0.29‡ 20.76±0.28‡ 19.62±0.30‡
GCC 45.72±0.53‡ 42.14±0.51‡ 39.4±0.56‡
INL 13.03±0.30 12.10±0.29* 12.17±0.31
OPL 14.30±0.29* 13.52±0.28* 13.48±0.30
ONL+IS 16.98±0.32 15.99±0.31* 16.28±0.34
OS 15.89±0.21* 15.3±0.20* 15.20±0.22
RPE 16.43±0.10 16.58±0.09 16.45±0.10
Foveolar Region
ONL+IS 19.18±0.34* 18.06±0.33* 18.05±0.36
OS 16.55±0.17* 15.86±0.17* 16.00±0.18
RPE 18.11±0.12 18.19±0.12 17.93±0.13
Foveal Region
RNFL 14.87±0.32* 14.01±0.31 13.41±0.33
GCL+IPL 23.30±0.27‡ 22.11±0.27* 20.92±0.29‡
GCC 38.16±0.56‡ 36.12±0.54* 34.33±0.59*
INL 13.29±0.30 12.57±0.29 12.50±0.32
OPL 19.42±0.36* 18.61±0.35 17.82±0.38
ONL+IS 18.84±0.29 17.85±0.28* 18.08±0.31
OS 16.41±0.25 15.99±0.25 15.94±0.27
RPE 16.88±0.11 17.01±0.11 16.82±0.12
Parafoveal Region
RNFL 19.88±0.26‡ 18.55±0.25‡ 17.34±0.27‡
GCL+IPL 24.58±0.26‡ 23.05±0.25‡ 21.80±0.27‡
GCC 44.47±0.49‡ 41.61±0.47‡ 39.11±0.51‡
INL 14.14±0.28 13.44±0.27 13.47±0.29
OPL 16.17±0.30 15.41±0.29 15.35±0.32
ONL+IS 18.12±0.29 17.23±0.29* 17.48±0.31
OS 15.86±0.28 15.52±0.27 15.47±0.30
RPE 16.41±0.11 16.5±0.11 16.37±0.12
Perifoveal Region
RNFL 23.20±0.29‡ 21.34±0.28‡ 19.83±0.30‡
GCL+IPL 22.50±0.29‡ 20.76±0.28‡ 19.62±0.30‡
GCC 45.72±0.53‡ 42.14±0.51‡ 39.40±0.56‡
INL 13.03±0.30 12.10±0.29* 12.17±0.31
OPL 14.30±0.29* 13.52±0.28* 13.48±0.30
ONL+IS 16.98±0.32 15.99±0.31* 16.28±0.34
OS 15.89±0.21* 15.30±0.20* 15.20±0.22
RPE 16.43±0.10 16.58±0.09 16.45±0.10
Abbreviations: SD (standard deviation); H (Healthy subjects group); MSON- (eyes of patients with multiple sclerosis without optic neuritis in medical history); MSON+ (eyes of patients with multiple sclerosis with optic neuritis in medical history); GCC (ganglion cell complex. the RNFL and GCL+IPL layers together)
*0.001<p<0.05 and
‡p<0.001 (Mixed-model analysis ANOVA) between H and MSON+ (see H column). H and MSON- (see MSON- column) and between MSON- and MSON + (see MSON+ column)
cells. The atrophy of these layers was pressumed to be related to trans-synaptic degeneration and not the observed focal vascular inflammatory changes. [36] Interestingly, microcystic mac-ular edema has been recently described in the INL in a small, severely impaired subset of MS patients with an unclear etiology. [10,40,41] Saidha et al. described the thinning of the outer retina additionally to the inner retinal changes using OCT image segmentation that appeared independently of inner retinal and optic nerve pathology, suggesting a primary retinal process in the background. [37–39] This was also supported by a small study employing adaptive optics scanning laser ophthalmoscopy imaging where–although only in one subject with MS—the thinning of the outer retina was suggested to be due to the cone density decrease caused by optic neuropathy. [42]
The inner retinal changes appear to be in connection with central nervous system changes, e.g. intracranial or brain substructure volume reduction (i.e. brain atrophy). [43–45] Therefore, OCT may provide a possibility to better understand the neurobiological changes in neurode-generative diseases such as MS and may help to develop both diagnostic and prognostic bio-markers that can predict clinical progress.
Optical changes of the retina have been described earlier in glaucoma, a neurodegenerative disease characterized by the loss of inner retinal structure that is very similar to that observed in MS. It has been previously shown that the reflectance of the RNFL layer shows changes in eyes with glaucoma in human patients [46,47] and in rat eyes with elevated IOP and glaucoma, as well. [21] According to the work of Huang et al. the thinning of the RNFL observed in a rat model of glaucoma is preceded by reflectance changes that could be explained by the changes in the optical properties of the extracellular and/or cytoplasmic constituents before cytostruc-tural damage occurs. [21]
To our knowledge, this is the first report describing optical differences observed in the reti-nal tissue of patients with MS. Additioreti-nally, we compared various optical parameters to thick-ness in order to reveal which parameter could be the best predictor of existing pathology.
The parameters that revealed significant differences between study groups were the thick-ness, layer index and total reflectance, mostly in eyes with MSON in the previous history, indi-cating optical changes in the inner retina following optic neuritis. The findings of the
significant thinning of the RNFL, GCL+IPL and GCC complex in MS patients compared to healthy and MSON+ subjects compared to MSON- patients, are in agreement with our earlier results and the results of previous studies. [8,37–39,41,48] More interestingly, there were sig-nificant changes in the layer index and total reflectance also in the eyes without ON in the pre-vious history. At the same time, the foveal region showed differences only with missed significance (very small p values close to 0.001) in the RNFL, GCL+IPL and GCC layers in all above parameters (except the fractal dimension), which may be explained by the compensation mechanism of the OCTRIMA software that partly affects this region and uniforms the segmen-tation of this area.
These results draw attention to the structural and optical changes in the macular area in MS even without ON supporting the previous view of ongoing neurodegeneration also present in the retina.[8,43,49,50]
and OPL in the whole macular, foveal and parafoveal regions, which in partly agrees with pre-vious reports. [37,39,53]
The outer retina showed no significant differences between the groups which was in con-trast with our earlier report showing significant fractal dimension changes in diabetic patients where, similarly, neurodegeneration was a proposed mechanism in the background of the observed changes. [54] This could point to the fact of a different disease mechanism at the level of the photoreceptors.
The observed differences in optical properties in our study can be related both to circula-tional or inflammatory alterations of the inner retina. There is only little evidence about the changes in microcirculation of the retina in MS. A recent study by Wang et al. using OCT angi-ography showed significantly reduced flow index around the optic nerve head in eyes after optic neuritis compared to healthy controls but no differences were shown in the parafoveal circulation. [55] Although this may suggest that our observations were most possibly not influ-enced by alterations in macular microcirculation, recent results also using hemodynamic infor-mation have revealed retinal impaired microcirculation in the macular region. [53,56–58] Therefore, further investigation is needed to better characterize the structure-function relation-ship in MS. On the other hand, inflammation may presumably be present also in the retina, possibly supported by the“inside-out”theory of MS, namely the migration of autoreactive T cells across the blood-brain barrier from the systemic circulation leading to inflammation. [55] The blood-retina barrier is very similar to the blood-brain barrier and indeed, the histological study by Green et al. described inflammatory cellular infiltrates surrounding retinal veins in the connective tissue of the retinal nerve fiber layer and GCL in 29% of the relapsing remitting and secondary progressive multiple sclerosis eyes. [36] It should be noted, however, that the observed inflammation was more localized (i.e not in all vessels or the entire retina) than the neurodegeneration observed which makes the direct correlation with our observed trends questionable in terms of revealing inflammatory alterations present or not in our study data. However, taking into account that the inner capillary network lies in the GCL and the outer capillary network runs from the IPL to the OPL through the INL, the significant differences observed between the study groups when analyzing reflectance and texture descriptors of the RNFL and GCL+IPL complex should be further explored in a larger study and correlated to microvasculature measurements (e.g. blood flow velocity and perfusion) using advanced opti-cal imaging technologies. [55,59,60] Investigating these two capillary networks in relation to structural, optical and functional measures may provide a much better insight to determine the role of the retinal microcirculation (i.e capillaries, arterioles and venules) in the increased risk of progression of multiple sclerosis in the presence of vascular comorbidities. [61,62]
Our study has certain limitations, one of them being the small number of subjects included. This study was aimed to see the possible usefulness of texture and optical property measure-ments in MS, but further work is warranted on a larger group of patients in the future. Second, the OCT device used in this study was time-domain OCT, which has a lower image resolution compared to latest SD-OCT technology, but it was a standard when the study was initiated in 2010. In addition, we have previously shown a high level of repeatability for both the RNFL and the GCL+IPL layers in our studies using OCTRIMA on TD-OCT images where the axial range (depth range) is 2 mm, consequently the 1024 axial pixels have a spacing of 2μm (i.e.
healthy subjects. We believe this does not affect our results largely as disease duration and age were comparable in the three groups.
Although optical properties of the retinal tissue are not standardized measures for detecting pathological changes of the retina, in contrast to thickness measurements, reflectance-based measures are direct measures obtained from OCT images. Therefore, we expect these addi-tional properties along with thickness information could facilitate a better diagnosis of retinal diseases. It is also worth to note that only qualified OCT images that had signal levels above the manufacturer recommended cutoff (i.e. SS higher than 6) and also had an SQF of 1 were used in the analysis. In addition, signal normalization was implemented to reduce the difference in measurements and minimize systematic technical variance and bias before assessing biological variability in study eyes. Therefore, normalization allowed us to compare the features of all of the images, ruling out differences in signal strength and mean background values. Also, we have shown previously that our custom-built segmentation algorithm provides comparable results to those obtained by SD-OCT and therefore we expect the trends reported here to be replicated by advanced OCT devices. [41] Further studies are warranted.
Conclusion
In summary, it seems that texture and optical properties of the retina derived from OCT images may provide a useful additional tool in the hands of clinicians for the assessment of neurodegeneration and neuronal loss-related changes occurring in MS. This may help the bet-ter differentiation of eyes with ON and more precise targeting of potential therapeutic inbet-ter- inter-ventions and could also be useful in the follow-up of MS patients. However, in order to prove this, a larger set of patients needs to be involved taking advantage of state-of-the art imaging technology and segmentation procedures.
Supporting Information
S1 Table. Demographical data and results of visual acuity test of the patients with multiple sclerosis (MS, Table A) and control subjects (Table B.).The disease duration and time from the last MS associated optic neuritis (MSON) was measured by month. It was calculated from July if only the year of ON episode was known. In those cases, when the ON episode was at the year of examination, the time was than calculated from January.
(XLSX)
S2 Table. Results of thickness measurements of intraretinal layer of the subjects.Sheet 1. Distribution statistics of the thickness (μm) of intraretinal layers by study group represented as
means ± SD and p values of the comparison between study groups. Sheet 2–6. The results orga-nized by study groups and regions.
(XLSX)
S3 Table. Results of contrast calculations of intraretinal layer of the subjects.Sheet 1. Distri-bution statistics of the contrast (a.u.) of intraretinal layers by study group represented as means ± SD and p values of the comparison between study groups. Sheet 2–6. The results orga-nized by study groups and regions.
(XLSX)
S4 Table. Results of fractal dimension calculations of intraretinal layer of the subjects. Sheet 1. Distribution statistics of the fractal dimension (a.u.) of intraretinal layers by study group represented as means ± SD and p values of the comparison between study groups. Sheet 2–6. The results organized by study groups and regions.
S5 Table. Results of layer index calculations of intraretinal layer of the subjects.Sheet 1. Distribution statistics of the layer index (a.u.) of intraretinal layers by study group represented as means ± SD and p values of the comparison between study groups. Sheet 2–6. The results organized by study groups and regions.
(XLSX)
S6 Table. Results of total reflectance measurements of intraretinal layer of the subjects. Sheet 1. Distribution statistics of the total reflectance (dB) of intraretinal layers by study group represented as means ± SD and p values of the comparison between study groups. Sheet 2–6. The results organized by study groups and regions. Abbreviations used in the tables: std (standard deviation); H (Healthy subjects group); MSON- (eyes of patients with multiple sclerosis without optic neuritis in medical history); MSON+ (eyes of patients with multiple sclerosis with optic neuritis in medical history); RNFL (retinal nerve fiber layer); GCL+IPL, ganglion cell layer and inner plexiform layer complex; GCC (ganglion cell com-plex. the RNFL and GCL+IPL layers together); INL, inner nuclear layer; OPL, outer plexi-form layer; ONL+IS, combined outer nuclear layer and inner segment of photoreceptors; OS, outer segment of photoreceptors; RPE, retinal pigment epithelial layer.
(XLSX)
Acknowledgments
The authors acknowledge Jing Tian, Ph.D., Bascom Palmer Eye Institute, Miller School of Medicine, University of Miami for her technical assistance in preparing the manuscript.
This study was supported in part by the research grants NIH R01EY020607, NIH Center Grant P30 EY014801 and a grant from Research to Prevent Blindness (RPB), by a research fel-lowship of the Helen Keller Foundation for Research and Education, the Eötvös Scholarship of the Hungarian Scholarship Fund and by the Zsigmond Diabetes Fund of the Hungarian Acad-emy of Sciences.
Author Contributions
Conceived and designed the experiments: ET MS GMS DCD. Performed the experiments: BEV ET MS GMS. Analyzed the data: BEV KLL ET GMS. Contributed reagents/materials/analysis tools: BEV WG KLL ET MS GMS DCD. Wrote the paper: BEV WG KLL ET MS GMS DCD.
References
1. Ramagopalan SV, Dobson R, Meier UC, Giovannoni G. Multiple sclerosis: risk factors, prodromes, and potential causal pathways. Lancet neurology. 2010; 9(7):727–39. Epub 2010/07/09. doi:10.1016/ s1474-4422(10)70094-6PMID:20610348.
2. Huang D, Swanson EA, Lin CP, Schuman JS, Stinson WG, Chang W, et al. Optical coherence tomog-raphy. Science. 1991; 254(5035):1178–81. PMID:1957169
3. International Commission on Illumination (1987) International Lighting Vocabulary. Number 17.4. CIE, 4th edition. ISBN 978-3-900734-07-7. Available:http://www.cie.co.at/index.php/index.php?i_ca_id= 306. [(Accessed 11 October 2014)]
4. Puliafito CA. Optical coherence tomography: 20 years after. Ophthalmic surgery, lasers & imaging: the official journal of the International Society for Imaging in the Eye. 2010; 41 Suppl:S5. Epub 2010/12/02. doi:10.3928/15428877-20101031-20PMID:21117600.
5. DeBuc DC. A review of algorithms for segmentation of retinal image data using optical coherence tomography. Image Segmentation. 2011:15–54. In Ho P-G, editor. Image Segmentation. InTech; 2011pp.15–54. doi:10.5772/628
7. Debuc DC, Somfai GM. Early detection of retinal thickness changes in diabetes using optical coher-ence tomography. Medical Scicoher-ence Monitor. 2010; 16(3):Mt15–Mt21. PMID:WOS:000275815800019.
8. Tatrai E, Simo M, Iljicsov A, Nemeth J, Debuc DC, Somfai GM. In vivo evaluation of retinal neurodegen-eration in patients with multiple sclerosis. PloS one. 2012; 7(1):e30922. doi:10.1371/journal.pone. 0030922PMID:22292076; PubMed Central PMCID: PMC3266905.
9. Saidha S, Sotirchos ES, Ibrahim MA, Crainiceanu CM, Gelfand JM, Sepah YJ, et al. Microcystic macu-lar oedema, thickness of the inner nuclear layer of the retina, and disease characteristics in multiple sclerosis: a retrospective study. Lancet neurology. 2012; 11(11):963–72. doi:10.1016/S1474-4422(12) 70213-2PMID:23041237; PubMed Central PMCID: PMC3533139.
10. Gelfand JM, Nolan R, Schwartz DM, Graves J, Green AJ. Microcystic macular oedema in multiple scle-rosis is associated with disease severity. Brain: a journal of neurology. 2012; 135(Pt 6):1786–93. doi:
10.1093/brain/aws098PMID:22539259; PubMed Central PMCID: PMC3359753.
11. Gossage KW, Tkaczyk TS, Rodriguez JJ, Barton JK. Texture analysis of optical coherence tomography images: feasibility for tissue classification. J Biomed Opt. 2003; 8(3):570–5. doi:10.1117/1.1577575
PMID:12880366.
12. Gneiting T, Schlather M. Stochastic Models That Separate Fractal Dimension and the Hurst Effect. SIAM Review. 2004; 46(2):269–82. doi:10.1137/S0036144501394387
13. Sarkar N, Chaudhuri BB. An efficient approach to estimate fractal dimension of textural images. Pattern Recognition. 1992; 25(9):1035–41.http://dx.doi.org/10.1016/0031-3203(92)90066-R.
14. Hasegawa M, Liu J, Okuda K, Nunobiki M. Calculation of the fractal dimensions of machined surface profiles. Wear. 1996; 192(1):40–5.
15. Huang Y. Optical coherence tomography (OCT) in hereditary retinal degeneration: layer-by-layer analy-sis in normal and diseased retinas. PhD dissertation, University of Pennsylvania. 1999.
16. Svet VD. About Holographic (Interferometric) Approach to the Primary Visual Perception. 2013.
17. Hammer M, Schweitzer D, Thamm E, Kolb A. Optical properties of ocular fundus tissues determined by optical coherence tomography. Optics Communications. 2000; 186(1–3):149–53.http://dx.doi.org/10. 1016/S0030-4018(00)01054-3.
18. Stein DM, Ishikawa H, Hariprasad R, Wollstein G, Noecker RJ, Fujimoto JG, et al. A new quality assessment parameter for optical coherence tomography. The British journal of ophthalmology. 2006; 90(2):186–90. doi:10.1136/bjo.2004.059824PMID:16424531; PubMed Central PMCID:
PMC1860175.
19. Wang J, Thomas J, Cox I, Rollins A. Noncontact measurements of central corneal epithelial and flap thickness after laser in situ keratomileusis. Investigative ophthalmology & visual science. 2004; 45 (6):1812–6. Epub 2004/05/27. PMID:15161844.
20. Bizheva K, Pflug R, Hermann B, Povazay B, Sattmann H, Qiu P, et al. Optophysiology: depth-resolved probing of retinal physiology with functional ultrahigh-resolution optical coherence tomography. Pro-ceedings of the National Academy of Sciences of the United States of America. 2006; 103(13):5066– 71. doi:10.1073/pnas.0506997103PMID:16551749; PubMed Central PMCID: PMC1405907.
21. Huang XR, Zhou Y, Knighton RW, Kong W, Feuer WJ. Wavelength-dependent change of retinal nerve fiber layer reflectance in glaucomatous retinas. Investigative ophthalmology & visual science. 2012; 53 (9):5869–76. Epub 2012/07/28. doi:10.1167/iovs.12-10001PMID:22836775; PubMed Central PMCID: PMCPMC3428115.
22. Gao W, Tatrai E, Somfai GM, DeBuc D. Assessing the Performance of Optical Properties Determina-tion of Intraretinal Layers in Healthy Normal and Type 1 Diabetic Eyes using Optical Coherence Tomog-raphy. Invest Ophthalmol Vis Sci. 2011; 52(6):3689–.
23. Gao W, Tátrai E, Varga B, Laurik L, Somogyi A, Somfai GM, et al. Investigation of changes in thickness and reflectivity from layered retinal structures of healthy and diabetic eyes with optical coherence tomography. Journal of Biomedical Science and Engineering. 2011; 4(10):657.
24. Polman CH, Reingold SC, Edan G, Filippi M, Hartung HP, Kappos L, et al. Diagnostic criteria for multi-ple sclerosis: 2005 revisions to the "McDonald Criteria". Annals of neurology. 2005; 58(6):840–6. Epub 2005/11/12. doi:10.1002/ana.20703PMID:16283615.
25. DeBuc DC, Somfai GM, Ranganathan S, Tatrai E, Ferencz M, Puliafito CA. Reliability and reproducibil-ity of macular segmentation using a custom-built optical coherence tomography retinal image analysis software. J Biomed Opt. 2009; 14(6):064023. doi:10.1117/1.3268773PMID:20059261; PubMed Cen-tral PMCID: PMC2799495.
26. Tewarie P, Balk L, Costello F, Green A, Martin R, Schippling S, et al. The OSCAR-IB consensus criteria for retinal OCT quality assessment. PloS one. 2012; 7(4):e34823. doi:10.1371/journal.pone.0034823
27. Sadda SR, Joeres S, Wu Z, Updike P, Romano P, Collins AT, et al. Error correction and quantitative subanalysis of optical coherence tomography data using computer-assisted grading. Investigative oph-thalmology & visual science. 2007; 48(2):839–48. doi:10.1167/iovs.06-0554PMID:17251486.
28. Afshar AR, Fernandes JK, Patel RD, Ksiazek SM, Sheth VS, Reder AT, et al. Cystoid macular edema associated with fingolimod use for multiple sclerosis. JAMA ophthalmology. 2013; 131(1):103–7. Epub 2013/01/12. doi:10.1001/jamaophthalmol.2013.570PMID:23307220.
29. Cheung CY, Leung CK, Lin D, Pang CP, Lam DS. Relationship between retinal nerve fiber layer mea-surement and signal strength in optical coherence tomography. Ophthalmology. 2008; 115(8):1347– 51, 51 e1-2. doi:10.1016/j.ophtha.2007.11.027PMID:18294689.
30. Samarawickrama C, Pai A, Huynh SC, Burlutsky G, Wong TY, Mitchell P. Influence of OCT Signal Strength on Macular, Optic Nerve Head, and Retinal Nerve Fiber Layer Parameters. Investigative oph-thalmology & visual science. 2010; 51(9):4471–5. doi:10.1167/iovs.09-3892PMID:20445116 31. Wu Z, Huang J, Dustin L, Sadda SR. Signal strength is an important determinant of accuracy of nerve
fiber layer thickness measurement by optical coherence tomography. Journal of glaucoma. 2009; 18 (3):213–6. Epub 2009/03/20. doi:10.1097/IJG.0b013e31817eee20PMID:19295375.
32. DeBuc D, Tatrai E, Laurik L, Varga BE, Olvedy V, Somogyi A, et al. Identifying Local Structural and Optical Derangement in the Neural Retina of Individuals with Type 1 Diabetes. Journal of Clinical & Experimental Ophthalmology. 2013.
33. Debuc DC, Salinas HM, Ranganathan S, Tatrai E, Gao W, Shen M, et al. Improving image segmenta-tion performance and quantitative analysis via a computer-aided grading methodology for optical coher-ence tomography retinal image analysis. J Biomed Opt. 2010; 15(4):046015. doi:10.1117/1.3470116
PMID:20799817; PubMed Central PMCID: PMC3188636.
34. Somfai GM, Tatrai E, Varga B, Laurik KL, Simo M, DeBuc D. The assessment of retinal optical proper-ties in multiple sclerosis. Invest Ophthalmol Vis Sci. 2013; 54(6):1433–.
35. Cabrera Fernandez D, Somfai GM, Tatrai E, Ranganathan S, Yee DC, Ferencz M, et al. Potentiality of intraretinal layer segmentation to locally detect early retinal changes in patients with diabetes mellitus using optical coherence tomography. Invest Ophthalmol Vis Sci. 2008; 49(5):2751–.
36. Green AJ, McQuaid S, Hauser SL, Allen IV, Lyness R. Ocular pathology in multiple sclerosis: retinal atrophy and inflammation irrespective of disease duration. Brain: a journal of neurology. 2010; 133(Pt 6):1591–601. doi:10.1093/brain/awq080PMID:20410146; PubMed Central PMCID: PMC2877904.
37. Sotirchos ES, Seigo MA, Calabresi PA, Saidha S. Comparison of point estimates and average thick-nesses of retinal layers measured using manual optical coherence tomography segmentation for quan-tification of retinal neurodegeneration in multiple sclerosis. Current eye research. 2013; 38(1):224–8. doi:10.3109/02713683.2012.722243PMID:22954302.
38. Saidha S, Syc SB, Durbin MK, Eckstein C, Oakley JD, Meyer SA, et al. Visual dysfunction in multiple sclerosis correlates better with optical coherence tomography derived estimates of macular ganglion cell layer thickness than peripapillary retinal nerve fiber layer thickness. Multiple sclerosis (Houndmills, Basingstoke, England). 2011; 17(12):1449–63. doi:10.1177/1352458511418630PMID:21865411.
39. Seigo MA, Sotirchos ES, Newsome S, Babiarz A, Eckstein C, Ford E, et al. In vivo assessment of retinal neuronal layers in multiple sclerosis with manual and automated optical coherence tomography seg-mentation techniques. Journal of neurology. 2012; 259(10):2119–30. doi:10.1007/s00415-012-6466-x
PMID:22418995.
40. Abegg M, Dysli M, Wolf S, Kowal J, Dufour P, Zinkernagel M. Microcystic macular edema: retrograde maculopathy caused by optic neuropathy. Ophthalmology. 2014; 121(1):142–9. doi:10.1016/j.ophtha. 2013.08.045PMID:24139122.
41. Kaufhold F, Zimmermann H, Schneider E, Ruprecht K, Paul F, Oberwahrenbrock T, et al. Optic neuritis is associated with inner nuclear layer thickening and microcystic macular edema independently of mul-tiple sclerosis. PloS one. 2013; 8(8):e71145. Epub 2013/08/14. doi:10.1371/journal.pone.0071145
PMID:23940706; PubMed Central PMCID: PMCPMC3735514.
42. Werner JS, Keltner JL, Zawadzki RJ, Choi SS. Outer retinal abnormalities associated with inner retinal pathology in nonglaucomatous and glaucomatous optic neuropathies. Eye. 2011; 25(3):279–89. doi:
10.1038/eye.2010.218PMID:21293495; PubMed Central PMCID: PMC3071640.
43. Saidha S, Sotirchos ES, Oh J, Syc SB, Seigo MA, Shiee N, et al. Relationships between retinal axonal and neuronal measures and global central nervous system pathology in multiple sclerosis. JAMA neu-rology. 2013; 70(1):34–43. doi:10.1001/jamaneurol.2013.573PMID:23318513.
45. Grazioli E, Zivadinov R, Weinstock-Guttman B, Lincoff N, Baier M, Wong JR, et al. Retinal nerve fiber layer thickness is associated with brain MRI outcomes in multiple sclerosis. Journal of the neurological sciences. 2008; 268(1–2):12–7. doi:10.1016/j.jns.2007.10.020PMID:WOS:000255261800003.
46. van der Schoot J, Vermeer KA, de Boer JF, Lemij HG. The effect of glaucoma on the optical attenuation coefficient of the retinal nerve fiber layer in spectral domain optical coherence tomography images. Investigative ophthalmology & visual science. 2012; 53(4):2424–30. Epub 2012/03/20. doi:10.1167/ iovs.11-8436PMID:22427540.
47. Vermeer KA, van der Schoot J, Lemij HG, de Boer JF. RPE-normalized RNFL attenuation coefficient maps derived from volumetric OCT imaging for glaucoma assessment. Investigative ophthalmology & visual science. 2012; 53(10):6102–8. Epub 2012/08/16. doi:10.1167/iovs.12-9933PMID:22893674.
48. Syc SB, Saidha S, Newsome SD, Ratchford JN, Levy M, Ford E, et al. Optical coherence tomography segmentation reveals ganglion cell layer pathology after optic neuritis. Brain: a journal of neurology. 2012; 135(Pt 2):521–33. Epub 2011/10/19. doi:10.1093/brain/awr264PMID:22006982; PubMed Cen-tral PMCID: PMCPMC3281477.
49. Burkholder BM, Osborne B, Loguidice MJ, Bisker E, Frohman TC, Conger A, et al. Macular volume determined by optical coherence tomography as a measure of neuronal loss in multiple sclerosis. Archives of neurology. 2009; 66(11):1366–72. Epub 2009/11/11. doi:10.1001/archneurol.2009.230
PMID:19901168.
50. Balcer LJ, Miller DH, Reingold SC, Cohen JA. Vision and vision-related outcome measures in multiple sclerosis. Brain: a journal of neurology. 2015; 138:11–27. doi:10.1093/brain/awu335PMID:
WOS:000348189800012.
51. Gills JP Jr, Wadsworth JA. Degeneration of the inner nuclear layer of the retina following lesions of the optic nerve. Transactions of the American Ophthalmological Society. 1966; 64:66–88. Epub 1966/01/ 01. PMID:4290397; PubMed Central PMCID: PMCPMC1310221.
52. Kerrison JB, Flynn T, Green WR. Retinal pathologic changes in multiple sclerosis. Retina. 1994; 14 (5):445–51. Epub 1994/01/01. PMID:7899721.
53. Zipp F, Aktas O. The brain as a target of inflammation: common pathways link inflammatory and neuro-degenerative diseases. Trends in neurosciences. 2006; 29(9):518–27. doi:10.1016/j.tins.2006.07.006
PMID:16879881.
54. Somfai GM, Tatrai E, Laurik L, Varga BE, Olvedy V, Smiddy WE, et al. Fractal-based analysis of optical coherence tomography data to quantify retinal tissue damage. BMC bioinformatics. 2014; 15:295. Epub 2014/09/03. doi:10.1186/1471-2105-15-295PMID:25178846; PubMed Central PMCID: PMCPMC4261615.
55. Wang X, Jia Y, Spain R, Potsaid B, Liu JJ, Baumann B, et al. Optical coherence tomography angiogra-phy of optic nerve head and parafovea in multiple sclerosis. The British journal of ophthalmology. 2014; 98(10):1368–73. doi:10.1136/bjophthalmol-2013-304547PMID:24831719.
56. Jiang H, Cabrera DeBuc D, Delgado S, Tao A, Lam B, Wang J. Quantification of Macular Blood Flow Volume and Microvascular Network in Multiple Sclerosis (MS) (P2.264). Neurology. 2014; 82(10 Sup-plement):P2.264.
57. Jiang H, Delgado S, Yuan J, Yan W, Cabrera DeBuc D, Lam B, et al. Impairment of the Retinal Nerve Fiber Integrity and Blood Flow Velocity in Multiple Sclerosis (P5.224). Neurology. 2015; 84(14 Supplement).
58. Jiang H, Ye Y, Cabrera DeBuc D, Shen M, Lam BL, Ge L, et al. Spectral oximetry measured with ultra-high resolution optical coherence tomography in multiple sclerosis. 38th Annual North American Neuro-Ophthalmology Society (NANOS) Meeting. February 11–16, 2012. San Antonio, TX. (poster
presentation).
59. White BR, Pierce MC, Nassif N, Cense B, Park BH, Tearney GJ, et al. In vivo dynamic human retinal blood flow imaging using ultra-high-speed spectral domain optical Doppler tomography. Opt Express. 2003; 11(25):3490–7. doi:10.1364/oe.11.003490PMID:WOS:000187324900021.
60. Stys PK, Zamponi GW, van Minnen J, Geurts JJ. Will the real multiple sclerosis please stand up? Nature reviews Neuroscience. 2012; 13(7):507–14. doi:10.1038/nrn3275PMID:22714021.
61. Braaf B, Vermeer KA, Vienola KV, de Boer JF. Angiography of the retina and the choroid with phase-resolved OCT using interval-optimized backstitched B-scans. Opt Express. 2012; 20(18):20516–34. doi:10.1364/oe.20.020516PMID:WOS:000308414800087.