Modelling of mass transfer kinetic in osmotic dehydration of kiwifruit**
Sharokh Jabrayili1,7, Vahid Farzaneh2,7*, Zahra Zare3, Hamid Bakhshabadi4, Zahra Babazadeh5,Mohsen Mokhtarian6, and Isabel S. Carvalho2
1Department of Food Science and Technology, Gorgan University of Agricultural Sciences and Natural Resources,
49138-15739 Gorgan, Iran
2Food Science Laboratory, Faculty of Sciences and Technology-University of Algarve, Campus Gambelas,
Building 8, 8005-139 Faro, Portugal
3Young Researchers and Elites Club, Shahre Qods Branch, Islamic Azad University, 37541-374 Shahre Qods, Iran 4Young Researchers and Elites Club, Gorgan Branch, Islamic Azad University, Gorgan, Iran
5 Department of Analytical Chemistry, Urmia Payam Noor University, 57168-38831 Urmia, Iran 6Young Researchers and Elite Club, Sabzevar Branch, Islamic Azad University, Sabzevar, Iran
7These authors contributed equally to this work as first authors Received October 18, 2015; accepted April 29, 2016
*Corresponding author e-mail: [email protected] **This work was supported by the Erasmus Mundus program 2013 program SALAM.
A b s t r a c t. Osmotic dehydration characteristics of kiwifruit were predicted by different activation functions of an artificial neural network. Osmotic solution concentration (y1), osmotic
solu-tion temperature (y2), and immersion time (y3) were considered
as the input parameters and solid gain value (x1) and water loss
value (x2) were selected as the outlet parameters of the network.
The result showed that logarithm sigmoid activation function has greater performance than tangent hyperbolic activation function for the prediction of osmotic dehydration parameters of kiwifruit. The minimum mean relative error for the solid gain and water loss parameters with one hidden layer and 19 nods were 0.00574 and 0.0062% for logarithm sigmoid activation function, respec-tively, which introduced logarithm sigmoid function as a more appropriate tool in the prediction of the osmotic dehydration of kiwifruit slices. As a result, it is concluded that this network is capable in the prediction of solid gain and water loss parameters (responses) with the correlation coefficient values of 0.986 and 0.989, respectively.
K e y w o r d s: artificial neural network, osmotic dehydration, mass transfer profile, modelling, kiwifruit
INTRODUCTION
The major source of kiwi plants is the forests of tem-perate regions in the coasts of Yangtze River in southern China. Historically, in 1968, the plant was imported to Iran and cultivated regularly (Mohammadian, 1994). Natural plants, including wild and or cultivated, have been proved to exhibit several health benefit potentials with different mechanisms (Farzaneh and Carvalho, 2015); these findings encourage scientists to conduct more research on different
plants. In 2008, the world harvested kiwifruit production
has reached 1,313,827 tons, and almost 30,000 million tons of this amount is attributed to Iran (FAO, 2005). Osmotic dehydration is defined as a process in which the water content is removed from cells when food is placed into a hypertonic solution. One of the first methods for dehy-dration of food products is sun drying; however, several disadvantages have been reported for this method, includ-ing lowerinclud-ing the quality of the dried products; difficulties in controlling the dehydration process; requirement of a huge space for the process; and the longer time required for the drying process (Seiiedlou et al., 2010). Since dehy-dration has been considered as the most substantial process in food product industries, discovering novel and high-per-formance methods for dehydration requires more attempts. Maintenance of available nutrients in the foods and the water absorbency property of the products or the tender quality of the dried food obtained are the most widely dis-cussed subjects by scientists in this field. Given its least impact on the maintenance of the resistance and quality of the products as well as the decreased consumption of time and cost of the process, the osmotic dehydration method has attracted the greatest attention, compared to other types of the dehydration processes (Rezagah et al., 2001). The most frequently applied components in the osmotic dehydration assay are sugars, salts, and/or a mix of both (Lazarides, 1999). Generally, it can be claimed that osmotic dehydration performed under atmospheric conditions cau- ses the least alteration in the final colour and texture and © 2016 Institute of Agrophysics, Polish Academy of Sciences
as a result has the least negative effect on the final qua- lity of food products (Dehghannya et al., 2006). Osmotic dehydration could also be used as a pretreatment in most processes for improving the nutritional and physico-chemi-cal characteristics of food products with minimum negative adverse effects (Torreggiani, 1993). Osmotic dehydration has been applied as a preliminary stage in a wide range of processes including freezing, freeze drying, and vacu- um drying along with drying with hot air flow. One of the main applications of this process is reduction of water
activity (aw) of food to protect it against microbial
degrada-tion; since most foods contain large quantities of water, the application of osmotic dehydration plays an effectual role in transportation, packaging, and storing (Biswal and Le Maguer, 1989). A group of researchers investigated the effi-cacies of three different drying methods on kiwifruit. The results showed that the freeze drying method needs more time than other methods; however, the sensory evaluation of freeze dried foods was better after osmotic dehydration. In freeze and vacuum died foods, vitamin C is protected more than in those treated with hot drying methods, and the alterations in colour and decomposition of sugar con-tents to organic acids are the lowest (Youn and Chio, 1998).
Another group of researchers examined kiwifruit osmotic
dehydration as a pre-treatment process of air flow drying, and their results showed that the application of osmotic dehydration as a pre-treatment improves the physical char-acteristics of the samples dehydrated by air flow (Alaeddini and Emam-jomeh, 2004). Several studies have been per-formed on the application of response surface methodology (RSM) and artificial neural network (ANN) in a wide range of food products (Dolatabadi et al., 2016; Rostami et al., 2014; Farzaneh et al., 2016). In this investigation, an arti-ficial neural network (ANN) model was used for modelling
kiwifruit osmotic dehydration. An artificial neural network is a set of computing elements (neurons) that are functional-ly similar to biological neurons. This set could discover and show the intrinsic connections among different parameters without having any prior knowledge of the process (Vinod and Vikrant, 2002). Today, the artificial neural network plays an effectual role and is regarded as a powerful tool in prediction of process parameters. Several studies have been performed in relation to osmotic dehydration process modelling. A group of researchers have investigated the application of ANN in modelling of the process of mass transfer of pumpkin. The results show that the best configu-ration of a neural network with one hidden layer (HL) in prediction of responses including solid material absorption and water loss is a network with the arrangement of 2-10-1 and 2-18-1, respectively. Also, between the neural networks with two hidden layers (HLs) in estimating the response parameters, the best layouts have been determined 2-6-6-1 and 2-22-22-1, respectively (Mokhtarian and Shafafi Zenuzian, 2012). Another group of researchers investigated tomatoes by modelling using artificial neural networks. The
experimental data were modelled by ANN and the results obtained showed that the neural network model predict-ed the experimental data more accurately (Dolatabadi et al., 2016; Movagharnejad and Nikzad, 2007). In another research, the moisture content of bananas was studied in the process of osmotic dehydration through two methods of networks and a genetic algorithm. The results indicated that the application of neural networks with 7 and 10 nods in the first and second hidden layers, respectively, predicts the moisture content with a higher correlation coefficient
value (R2=0.94) (Mohebbi et al., 2011).
The main aim of this investigation is to predict the quantity of water loss and solid gain by application of dif-ferent functions of the artificial neural network, and deter-mination of the most appropriate arrangement of neurons
through kiwifruit osmotic dehydration process.
MATERIALS AND METHODS
The kiwifruit Actinidia deliciosa species was purchased from a local market in Gorgan-Iran, sugar has been pro-vided from Karaj company, and filter paper number 1 was ordered from Whatman. An oven (Binder-Germany), bal-ance with the precision of 0.001 g (sartorius-Germany), and fridge (Arj-Iran) were also used in this investigation.
The samples were stored in a fridge at a temperature
of 6°C until the experimental day. The analysed kiwifruit
samples showed initial moisture contents of 86.67% (W/
Wm) based on the moisture weight, the moisture content of
the samples was detected with the AOAC method (1990) released under No. 931-04. The dehydration process was performed by placing the samples in an oven at a tempe-rature of 105 ± 0.5°C until reaching to a constant weight (AOAC, 1990).
To apply the osmotic dehydration process, the kiwifruit fruits were first sliced in a lateral way (the fruits were placed and fixed in a straightforward shape) then sliced from left- to right-hand sides with an appropriate cutter to reach a thickness of slices equal to 5 mm. In other words, we tried to cut slices with the same thickness to obtain uniform and reliable results. In the experiment, the priority is applica-tion of kiwifruits with a medium size and firm texture. The osmotic solution was prepared using sugar (Sucrose) with four different concentrations. Osmotic solutions at four dif-ferent temperatures (30, 40, 50, and 60°C), four difdif-ferent
sugar concentrations (35, 45, 55, and 65 (ºBrix)) within
various immersion times (starting from 15 min to maxi-mum 300 min (in total, 9 different times were determined) until reaching constant weight regarding the concentration of the solution) were designed. Afterwards, each piece of kiwifruit was weighed and immediately immersed into the solution; after dehydration, the samples were taken out of the solution, and washed with distilled water, and placed on a filter paper for absorption of the surface water. Then the samples were weighed for the second time. To determine the moisture content and dry matter, one sample was placed
in the oven at a temperature of 105 ± 0.5°C until reaching constant weight. In the experiments, the proportion of the mass of the slices to the osmotic solution was adjusted 1 on 10 (proportion 1/10). The release of water content and the solid gain were detected based on the weighing at different phases including prior and after osmotic dehydration and after drying in the oven with Eqs (1) and (2), respectively:
, 0 ) 1 ( ) 1 ( 0 0 0 m m S m S WL= t t − − − (1) , 0 0 0 0 m S m S m S SG= t t − (2)
where: water loss (WL) and solid gain (SG) express solid
uptake (gain) (%) and water withdrawal (loss) rate (%)
values, respectively, S0 indicates the quantity of the solid
prototype (g), St presents the quantity of the dehydrated so-
lid material (g), m0 is the initial mass of the sample (g), and
mt expresses the mass of the dehydrated sample (g) (Chenlo
et al., 2006).
For modelling with the artificial neural network, SPSS program version 19 (released in 2011) was used. The
designed network was a multilayer perceptron network
(MLP) in which the input layer consists of three parameters
(concentration of osmotic solution (y1), osmotic solution
temperature (y2), and immersion time (y3)) and the output
layer consists of two parameters (solid absorption (x1) and
dehydration (x2)). Therefore, the artificial neural network
model was developed based on three inputs and two
out-puts. Figure 1 presents a schematic structure of the neural
network of perceptron optimization of an artificial neural network obtained by studying the layout of the network and assessing of the correlation between the experimental data obtained and the output of the neural network (predicted values). To optimize the artificial neural network, diffe- rent parameters, such as the number of the hidden layers, number of neurons in each hidden layer, and output activa-tion funcactiva-tion, as well as the learning rate and momentum coefficient values should be evaluated. In order to find the best configuration, 1-2 hidden layers with 1-37 neurons in each, a learning rate of 0.4, a momentum coefficient of
0.9, and sigmoid logarithm activation (Log-sig) functions,
e indicates Neper coefficient value (e = 2.718) (Eq. (3)) and
hyperbolic tangent (tanh) activation (Eq. (4)) in the hidden
layer and output were used:
(0,+1), 1 1 + − −z e sig= Log (3)
(-1,+1),
tanh
e
e
e
e
=
zz zz
+
−
− − (4)In order to model the neural network, the first data was divided into two parts, 70% of the data was considered for the training and the remaining (30%) was considered to evaluate the network. In total, 161 runs (three replications in each run) were selected to evaluate the applied neural network. The numbers of the were been obtained based on the preliminary tests performed by the authors and analysis of the results of the investigations performed previously by
Fig. 1. Scheme of a neural network (concentration of osmotic solution (y1), osmotic solution temperature (y2), immersion time (y3), solid
gain (x1), and dehydration (x2)) with the arrangement of 3:12:12:2.
12 nodes of activation function of tanh for each hidden layer ,
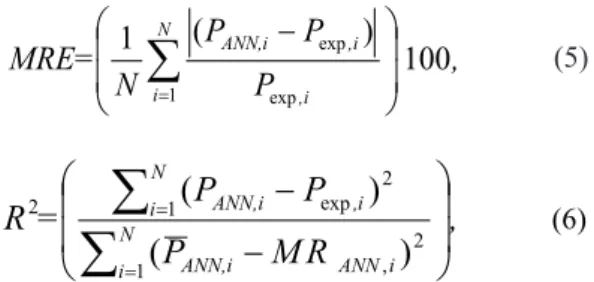
(Tavakolipour and Mokhtarian, 2012, 2013). In the afore-mentioned investigations, 70% of the data for training and 30% for testing were selected; therefore, regarding the pre-liminary tests performed to select reliable models in this investigation and the data obtained in the previous investi-gations, this pattern was selected in this study. To compare the efficiency of the neural network in prediction of the flooding parameters under investigation, the mean relative error (MRE) and correlation coefficient between the expe- rimental and predicted values were detected based on Eqs (5) and (6), respectively: 100 ) ( 1 1 exp exp , P P P N MRE= N i i, i, ANN,i −
∑
= (5))
(
)
(
1 2 , 1 2 exp 2,
R
M
P
P
P
=
R
N i ANN,i ANNi N i ANN,i i,
−
−
∑
∑
= = (6)where: PANN indicates the predicted value for the output parameters of the network, Pexp presents the values of the
experimental data obtained and N expresses the number of observations (Mokhtarian and Shafafi Zenuzian, 2012).
RESULTS AND DISCUSSION
In this study, a combination of different layers of neurons with different activation functions was used for modelling the perceptron neural network. A neural network with one hidden layer with 1 to 25 neurons was random-ly selected and the ability of the network in prediction of kiwifruit osmotic parameters was estimated. For train-ing the perceptron network, a learntrain-ing algorithm of error post propagation was used. In this method, the calculation
is performed from the network input to the network
out-put. Then, the error values were detected and considered
to the previous layers and the weight vectors are gradually modified from the last layer to the first layer in order to get the minimum value of the prediction error (Mohebbi et al., 2011). The results of the optimization of perceptron neural networks with logarithm sigmoid activation function (Log-sig – Log-sig) and hyperbolic tangent (tanh) together with the obtained layout in different modes are shown in
Figs 2-5. Figure 2 shows the values of relative error in the number of neurons in the prediction of the solid absorp-tion response value. The investigaabsorp-tion of the results of the multi-layer perceptron neural network together with loga-rithm sigmoid activation function with one hidden layer indicated that the arrangement of 3-19-2, ie a network with 3 inputs, 19 neurons in the hidden layer, and 2 outputs, shows the best result in prediction of the solid gain and water loss parameters. Also, the results of the neural net-work with two hidden layers along with a driver function of sigmoid log indicated that this network could predict the quantities of the solid gain and water loss with 19 and 22 neurons respectively in the first and second hidden layers with the coefficient of determination of 0.955 and 0.962, respectively. On the other hand, the results of neu-ral networks with activation function of hyperbolic tangent showed that the neural network with the configuration of 2-16-16-3 had the best result in the prediction of the solid gain (SG) so that the network was able to estimate the solid gain through the process of osmotic dehydration of kiwi-fruit with a regression coefficient of 0.984. The results of water loss predicted by the activation function of hyperbo- lic tangent also showed that the application of this function in the neural network with 22 neurons in the first hidden
layer provides the best results (Table 1).
Fig. 2. Changes in the relative error value in prediction of solid gain with changes in neuron number.
Number of nodes
Quantity of relative error for
SG
Log-sig function with one HL
Fig. 3. Changes in the coefficient of determination value in prediction of solid absorption with changes in neuron number. Legend as
in Fig. 2.
Fig. 4. Changes in the relative error value in the prediction of water decreases with changes in neuron number. Legend as in Fig. 2.
Fig. 5. Changes in the coefficient of determination values in prediction of water loss with changes in neuron number. Legend as in Fig. 2.
Coefficient of determination value for
SG
Quantity of relative error for
WL
Coefficient of determination value for
WL
Number of nodes
Number of nodes
The results of the comparison of different applied mo- dels of neural networks for prediction of kiwifruit osmo- tic dehydration characteristics are shown in Table 1. As clarified, both functions used in modelling by the artificial neural network (ANN) have shown higher abilities in the prediction of the effectiveness of the osmotic dehydration characteristics of kiwifruit. The coefficient of the deter-mination for neural network models is higher than 0.978. However, the perceptron neural network model with acti-vation function of sigmoid logarithm with 19 neurons in the first hidden layer was selected as the most appropriate model to predict the characteristics of the osmotic dehy-dration of kiwifruit due to its higher correlation coefficient
(R2) and the minimum relative error (MRE) values. Based
on the tests performed in this investigation, the authors found out that the application of activation functions with the arrangement of 3-19-2 for both of the responses in the Logarithm-sigmoid design and 3-16-16-2 and 3-22-2, respectively, in SG and WL in the Hyperbolic-tangent design exhibited the highest reliability. The results of this investigation are in agreement with the results obtained in some similar research including synthetic prediction of mass transfer in the process of osmotic dehydration of pumpkin and modelling of water absorption of wheat
with perceptron neural network and radial basis function performed by (Kashaninejad et al., 2009; Mokhtarian and Shafafi Zenuzian, 2012). In other words, the interpretation of the figures (Figs 2-5) indicates that, in the response of SG (Figs 2-3), the relative errors obtained in the activation functions of the logarithm-sigmoid and hyperbolic-tangent with the arrangement of 3-19-2 and 3-16-16-2 exhibited the lowest values; in contrast, the correlation coefficients obtained between the experimental and predicted values are the highest in the aforementioned arrangements for the each of the activation functions. In turn, as presented in Figs 4-5, in the response of WL, the arrangement of 3-19-2 and 3-22-2 in the activation functions of logarithm-sigmoid and hyperbolic-tangent, respectively, demonstrated the lowest relative error (MRE) and the highest regression
coefficient (R2) (Figs 4-5 and Table 1).
As shown by the data obtained (Figs 2-5), mostly for both of the responses with an increase in the neurons in the hidden layers in the range of 4-22, the values obtained for the relative errors and correlation coefficients are decreased and increased, respectively. In other words, the predicted values with the activation functions with 1 or 2 hidden lay-ers within the range of 19-22 neurons are the most reliable for both of the responses using hyperbolic tangent function and Log-sig functions.
T a b l e 1. The results of comparison of suggested artificial neural networks in prediction of osmosis characteristics of kiwifruit
Activation function Statistical parameter SG WL
Logarithm-sigmoid (Log-sig) Coefficient of determination 0.986 0.989
Relative error 0.00574 0.00624
Arrangement 3-19-2 3-19-2
Hyperbolic-tangent (tanh) Coefficient of determination 0.984 0.978
Relative error 0.0110 0.0155
Arrangement 3-16-16-2 3-22-2
Fig. 6. Correlation coefficient between the experimental value and predicted values obtained by the perceptron neural network (testing
values) of:a – water loss (WL) and b – solid gain (SG) parameters with activation function of sigmoid logarithm. Experimental value for WL (%) Experimental value for SG (%)
Predicted value for
WL
(%)
Predicted value for
SG
(%)
a b
The diagram of model sensitivity predicted by the per-ceptron neural network design along with the activation function of sigmoid logarithm versus the experimental va- lues for the best configuration (3-19-2) of both of the outputs
(responses) are represented in Fig. 6. The perceptron neural
network model showed that the data are randomly distribu- ted around the regression line with the correlation coeffi-cient higher than 0.985, which represents higher accuracy of the investigation of neural network in prediction of the characteristics of kiwifruit osmotic dehydration. Figure 6 shows the correlation coefficient between the experimen-tal values obtained in the experiments and predicted values achieved by the artificial neural network (ANN) as well.
CONCLUSIONS
1. The applied network for the optimization of the selec-
ted parameters water loss and solid gain of kiwifruit was
the multi-layer perceptron. The results showed the best
per-formance of optimization with the activation function of hyperbolic tangent in the configuration of 3-16-16-2 and 3-22-2 for the solid gain and water loss responses, respec-tively, and for the activation function of sigmoid logarithm 3-19-2 and 3-19-2 for the solid gain and water loss respon- ses, respectively.
2. The comparison of the different functions showed that the activation function of the sigmoid logarithm is more precise in prediction of the mass transfer parameters of kiwifruit than hyperbolic tangent function in offering the minimum relative error and the maximum coefficient of the determination values.
3. The selected network was able to predict the quantity of solid absorption and water loss of kiwifruit with the cor-relation coefficients of 0.986 and 0.989, respectively.
REFERENCES
Alaeddini B. and Emam-jomeh Z., 2004. Formulation and qua-
lity improvement of dried kiwifruit slices using an osmotic pretreatment. Proc. 14th Int. Drying Symposium, August 22-25, Sao Paulo, Brazil.
AOAC, 1990. Official methods of analysis. Washington: Asso- ciation of Official Analytical Chemists.
Biswal R.N. and Le Maguer M., 1989. Mass transfer in plant
materials in contact with aqueous solutions of ethanol and sodium chloride: Equilibrium data. J. Food Process Eng., 11(3), 159-176.
Chenlo F., Moreira R., Fernández-Herrero C., and Vázquez G., 2006. Mass transfer during osmotic dehydration of
chestnut using sodium chloride solutions. J. Food Process Eng., 73(2), 164-173.
Dehghannya J., Emam-jomeh Z., Sotudeh-Gharebagh R., and Ngadi M., 2006. Osmotic dehydration of apple slices with
carboxy-methyl cellulose coating. Dry Technol., 24(1), 45-50.
Dolatabadi Z., Elhami Rad A.H., Farzaneh V., Akhlaghi Feizabad S.H., Estiri S.H., and Bakhshabadi H., 2016.
Modeling of the lycopene extraction from tomato pulps. Food Chem., 190, 968-973.
FAO, 2005. Production Year Book, 2004. Rome, Italy. Food and Agriculture Organization of the United Nations.
Farzaneh V. and Carvalho I.S., 2015. A review of the health
benefit potentials of herbal plant infusions and their mecha-nism of actions. Ind. Crop Prod., 65(0), 247-258.
Farzaneh V., Ghodsvali A., Bakhshabadi H., Ganje M., Dolata- badi Z., and Carvalho I.S., 2016. Modelling of the selected
physical properties of the fava bean with various moisture contents using fuzzy logic design. J. Food Process Eng., http://onlinelibrary.wiley.com/doi/10.1111/jfpe.12366/pdf
Kashaninejad M., Dehghani A.A., and Kashiri M., 2009.
Modeling of wheat soaking using two artificial neural net-works (MLP and RBF). J. Food Eng., 91(4), 602-607.
Lazarides H.N., 1999. Advance in osmotic dehydration by
pro-cessing foods. (Ed. F.A.R. Oliveria). CRC Press, New York.
Mohammadian M.A., 1994. Cultivatin, growing, and nutritional
value of kiwifruit. Meli Bank Press,Tehran, Iran.
Mohebbi M., Shahidi F., Fathi M., Ehtiati A., and Noshad M., 2011. Prediction of moisture content in pre-osmosed and
ultrasounded dried banana using genetic algorithm and neu-ral network. Food Bioprod Process., 89(4), 362-366.
Mokhtarian M. and Shafafi Zenuzian M., 2012. Synthetic
Prediction of pumpkin osmotic dehydration with the help of smart tools of artificial neural network in the static mode (in Persian). Iranian J. Food Sci. Technol., 7(1), 61-73.
Movagharnejad K. and Nikzad M., 2007. Modeling of tomato
drying using artificial neural network. Comput Electron Agr., 59(1-2), 78-85.
Rezagah E.M., Kashaninejad M., Mirzaei H., and Khomeiri M., 2001. Osmotic dehydration of button mushroom:
Fickian diffusion in slab configuration. Lat. Am. Appl. Res., 40(1), 23-26.
Rostami M., Farzaneh V., Boujmehrani A., Mohammadi M., and Bakhshabadi H., 2014. Optimizing the extraction
pro-cess of sesame seed’s oil using response surface method on the industrial scale. Ind. Crop Prod., 58(0), 160-165.
Seiiedlou S., Ghasemzadeh H.R., Hamdami N., Talati F., and Moghaddam M., 2010. Convective drying of apple:
Mathematical modeling and determination of some quality parameters. Int. J. Agric. Sci. Biol., 12, 171-178.
Tavakolipour H. and Mokhtarian M., 2012. Neural network
approaches for prediction of pistachio drying kinetics. Int. J. Food Eng., 3, article 42.
Tavakolipour H. and Mokhtarian M., 2013. Application of
Neural Network for Estimation of Pistachio Powder Sorption Isotherms. American-Eurasian J. Agric. Environ. Sci., 13(7), 967-974.
Torreggiani D., 1993. Osmotic dehydration in fruit and vegetable
processing. Food Res. Int., 26(1), 59-68.
Vinod K.J. and Vikrant C., 2002. Neural networks approach to
modeling food processing operations. P1-3. J. Food Process Ope Mod: Design and Analysis, 1, 305-335.
Youn K.S. and Chio Y.H., 1998. The Quality characteristics of
drying kiwifruit using different drying methods. Food Eng. Progress, 2, 49-54.