Farah Christina Alimagham
Licenciada em Engenharia de Micro e Nanotecnologias
Assessment of a Microfluidic Intravenous Oxygen
Generating Platform to Aid Acute Respiratory Failure
Dissertação para obtenção do Grau de Mestre em Engenharia de Micro e Nanotecnologias
Orientador: Professor Doutor Babak Ziaie, Professor Catedrático, Purdue
University, USA
Co-orientador: Professora Doutora Elvira Fortunato, Professora Catedrática,
Faculdade de Ciências e Tecnologia da Universidade Nova de Lisboa, Portugal
Júri:
Presidente: Prof. Doutor Rodrigo Martins Arguente: Prof. Doutor Hugo Águas Vogal: Prof. Doutora Elvira Fortunato
iii "Logic will get you from A to B.
Imagination will take you everywhere."
−Albert Einstein
v
Assessment of a Microfluidic Intravenous Oxygen Generating Platform to Aid Acute Respiratory Failure
Copyright © Farah Christina Alimagham, Faculdade de Ciências e Tecnologia, Universidade Nova de
Lisboa, 2015.
A Faculdade de Ciências e Tecnologia e a Universidade Nova de Lisboa têm o direito, perpétuo e sem
limites geográficos, de arquivar e publicar esta dissertação através de exemplares impressos
reproduzidos em papel ou de forma digital, ou por qualquer outro meio conhecido ou que venha a ser
inventado, e de a divulgar através de repositórios científicos e de admitir a sua cópia e distribuição
com objectivos educacionais ou de investigação, não comerciais, desde que seja dado crédito ao autor
vii
A
CKNOWLEDGEMENTS
First and foremost, I gratefully acknowledge the support and guidance of my supervisor, Dr. Babak
Ziaie. He has given me relentless backing through the progress of my project and also groomed my
graduate career by providing me with enriching opportunities.
I wish to thank my co-supervisor, Dr. Elvira Fortunato, for all her help support and for magnifying my
interest in the world of micro and nanotechnologies from the very beginning.
A special thanks goes to Dr. Rodrigo Martins for all his time, encouragement and opportunities he has
provided me throughout my studies.
I thank Manuel Ochoa for sharing his knowledge and expertise with me, for all the help in the lab, and
for the brainstorming sessions that always lead to new and creative ideas. I also thank Albert Kim for
all his advice and help in the lab whenever it was needed. In addition, I gratefully acknowledge the
support of all the ZBML research group members for invaluable suggestions and assistance
throughout my project and time at Purdue.
The National Science Foundation (NSF) is thanked for providing financial assistance for this research
under grant EFRI-BioFlex #1240443.
All the staff and engineers at the Birck Nanotechnology Center of Purdue University are
acknowledged for all their help and guidance.
I thank Daniel for the past five years of complete randomness, for understanding me at times that no
one else could, for putting up with me on the good and bad days and most importantly for a true and
forever-lasting friendship. I also thank Emanuel, for all the uplifting moments, wholehearted
happiness and great friendship throughout the years. A massive thanks to Catarina for the wonderful
person that she is, for understanding me and for being the best tissue engineering lab colleague I could
have asked for. I also thank all my amazing friends and colleagues from Nova University of Lisbon
that have been an important part of my academic life and made it an unforgettable one.
Words simply are not enough to express my gratefulness to my dear Amir, for being an unbelievable
person, standing by my side all the way, giving me all the motivation and support in the world and
having such a positive impact on my life. I would never have made it this far if it hadn’t been for your
endless patience, understanding and care.
Last but not the least, I would like to thank my family: my brothers Christopher and Kamran and my
magnificent parents, Linda and Farshad, for their unconditional support, encouragement and belief
throughout my education and entire life. For always being there for me and making me the person I
ix
A
BSTRACT
Acute respiratory failure is associated with a high mortality rate, despite the advances in
conventional treatments.
This work presents the development of a proof-of-concept device for assessing the viability of an
oxygen-generating catheter, deployed intravenously, to temporarily sustain a patient who is suffering
from acute respiratory failure. The assessment device mimics the interface between the catheter and
bloodstream (deoxygenated water substitutes the blood), and consists of two parallel channels
separated from each other by an oxygen-permeable membrane that simulates the catheter material.
Several polydimethylsiloxane membranes with enhanced permeability were developed and tested on
the device according to their permeation rates.
The highest permeation rate achieved was 3.6×10⁻⁷ cm3/s (equivalent in-blood value) considering the device’s surface area and applied pressure. However, the extrapolation of this value to a catheter
with increased surface area demonstrated a predicted oxygen permeation rate of 1.6×10⁻³ cm3/s. Although the oxygen permeation rates achieved here do not yet reach the minimum required rate to
sustain a patient with only 30 % of their lungs functional (1.6 cm3/s O2), it may be enhanced further
by improving certain parameters such as material permeability, surface area and applied pressure.
The ability to administer oxygen or other gases directly into the bloodstream may portray a
technique for short-term rescue of severely hypoxemic patients to increase whole body or at-risk
organ oxygenation.
xi
R
ESUMO
Apesar dos avanços nos tratamentos convencionais, a insuficiência respiratória aguda é uma
condição associada a uma elevada taxa de mortalidade.
O presente trabalho apresenta o desenvolvimento de um dispositivo “prova-de-conceito” para
avaliar a viabilidade de um cateter intravenoso, gerador de oxigénio, para sustentar temporariamente
um paciente sofredor de insuficiência respiratória aguda.
O dispositivo simula a interface entre o cateter e a corrente sanguínea (onde água desoxigenada
substitui o sangue) e consiste em dois canais separados um do outro por uma membrana permeável ao
oxigénio que simula o material do cateter. Foram desenvolvidas várias membranas de
polydimethylsiloxane, com permeabilidades ao oxigénio refinadas, e de seguida testadas no
dispositivo, de acordo com a taxa de permeação de oxigénio que possibilitam. A maior taxa de
permeação obtida foi de 3.6×10⁻⁷ cm3/s (valor equivalente em sangue), tendo em conta a área superficial da membrana exposta no dispositivo e a pressão aplicada. A extrapolação deste valor,
considerando um cateter com elevada área superficial, demonstra uma taxa de permeação de oxigénio
de 1.6×10⁻³ cm3/s.
Apesar das taxas de permeação de oxigénio obtidas neste trabalho serem ainda insuficientes para
atingir o valor mínimo requerido (1.6 cm3/s O2) para sustentar um paciente com 30 % dos pulmões
funcionais, poderão ser aumentadas melhorando certos parâmetros tais como a permeabilidade do
material, a área superficial e a pressão aplicada.
A capacidade de administrar oxigénio ou outros gases diretamente para a corrente sanguínea
poderá representar uma técnica de salvação de curto prazo para pacientes altamente hipoxémicas, para
aumentar a oxigenação de corpo inteiro ou de órgãos em risco.
Termos Chave: Insuficiência respiratória aguda, oxigenação, administração intravenosa de
xiii
T
ABLE OF
C
ONTENTS
ACKNOWLEDGMENTS vii
ABSTRACT ix
RESUMO xi
LIST OF FIGURES xv
LIST OF TABLES xvii
LIST OF SYMBOLS xix
LIST OF ABBREVIATIONS xxi
CHAPTER 1. INTRODUCTION
1.1. Motivation 1
1.2. Relevant Research 3
1.2.1. Physiological oxygenation 3
1.2.2. Oxygen-permeable membranes: Why PDMS? 4
CHAPTER 2. MATERIALS AND METHODS
2.1. Oxygen-permeable membrane development and characterization 7
2.1.1. Macroporous PDMS membrane development 7
2.1.2. Microporous PDMS membrane development 8
2.1.3. Permeability characterization 9
2.2. Proof-of-concept device 10
2.2.1. Fabrication 10
2.2.2. Lab implementation 11
2.3. Development of the MnO2-embedded Polyimide tube 13
CHAPTER 3. RESULTS AND DISCUSSION
3.1. Oxygen-permeable membranes 15
3.1.1. Membrane permeability measurements 20
3.1.2. Membrane Expansion test 21
3.2. Proof of concept device data 21
3.3. Polyimide tube with embedded MnO2 nanoparticles 26
CHAPTER 4. CONCLUSIONS AND FUTURE PERSPECTIVES
4.1. Conclusions 29
xiv
REFERENCES 33
APPENDICES
A.Laser-cutter settings for different materials 35
B. Image of the lab implementation of the testing device 36
C. Calculation of total surface area of an engineered custom catheter with
xv
L
IST OF
F
IGURES
Figure 1.1. Conceptual schematic of the proposed catheter approach for rapid delivery of oxygen to
the blood ... 2!
Figure 1.2. Function principle of the proof-of-concept device to evaluate the approach. ... 2!
Figure 1.3. Illustration on how O2 and CO2 go between alveolar air and blood across the respiratory membrane ... 3!
Figure 1.4. Molecular structure of Polydimethylsiloxane. ... 5!
Figure 1.5. 3D scheme depicting the gas diffusion mechanism in a PDMS membrane. ... 6
Figure 2.1. Permeability measuring device and its components……….………9
Figure 2.2. Permeability measuring setup ... 10!
Figure 2.3. Schematic of the several componentes that constitute the testing device ... 11!
Figure 2.4. Laboratory setup for implementing the fabricated testing device ... 12!
Figure 2.5. Scheme depicting the procedure for embedding MnO2 nanoparticles in a PI tube. (a) Carbonization of tube by laser-machining; (b) embedment of MnO2 nanoparticles in; (c) PI tube with embedded MnO2 nanoparticles. ... 13
Figure 3.1. Light microscope images showing the pores of the PDMS membranes. (a) Membrane 1.2 (10 % NaHCO3); (b) Membrane 1.3 (20 % NaHCO3); (c) Membrane 1.4 (30 % NaHCO3) and (d) Membrane 2.1(20 % water, spin-coated at 500 rpm). Red and blue denote the large pore and small pores respectively within the membrane. Scale bars represent 200 µm. ... 17
Figure 3.2. SEM images of the prepared microporous PDMS. (a) Membrane 2.1 (20 % water, spin-coated at 500 rpm); (b) Membrane 2.3 (30 % water, spin-spin-coated at 1000 rpm) and (c) Membrane 2.2 (20 % water, spin-coated at 1000 rpm). Green and orange represent holes and cavities respectively on the membrane surface. Scale bars represent 50 µm. ... 18
Figure 3.3. Expansion of PDMS membrane with increasing pressures. P = Pressure applied inside platform. (a) P = 20 mm Hg; (b) P = 120 mm Hg; (c) P = 220 mm Hg; (d) P = 420 mm Hg; (e) P = 630 mm Hg and (f) P = 820 mm Hg...21
Figure 3.4. Pictures of the fabricated test device. (a) Side view, indicating the water and hydrogen peroxide inlets and outlets; (b) top-view ... 24
Figure 3.5. Oxygen permeation/transport rate in the H2O channel with increasing H2O2 channel pressure for the macroporous PDMS membranes.. ... 24!
Figure 3.6. Oxygen permeation/transport rate in the H2O channel with increasing H2O2 channel pressure for the microporous PDMS membranes. ... 25!
xvi
Figure 3.8. a) Polyimide tube with select laser ablated regions with embedded MnO2 particles; (b) Oxygen generation after a droplet of H2O2 (30 %) is placed on the surface. with embedded MnO2
nanoparticles; Scale bar represents 1 mm ... 27
xvii
L
IST OF
T
ABLES
Table 1.1. O2 permeabilities in various polymers. ... 6
!
Table 2.1. Macroporous PDMS membrane specifications. ... 8!
Table 2.2. Micrporous PDMS membrane specifications. ... 8!
Table 3.1. Parameters of the macroporous membranes developed using NaHCO3 and varying crosslink ratios. ... 15
!
Table 3.2. Parameters of the microporous membranes developed using water-in-PDMS emulsion ... 15
!
Table 3.3. Porosity of the macroporous and microporous PDMS membranes ... 19
!
xix
L
IST OF
S
YMBOLS
Symbol Definition Unit
!! Membrane area! cm2!
P! Permeability! cm3!(STP)!cm!cm–2!cm!Hg–1!s–1!
d! Diameter mm!
ΔP! Pressure difference! mm!Hg!
PaO2 Arterial partial pressure of oxygen mm Hg
SaO2 Arterial hemoglobin oxygen saturation %
CaO
! Oxygen concentration %
!!
! Partial pressure of oxygen mm Hg
w/v Weight/volume %
! Partial pressure of gas mm Hg
!! Membrane thickness! 4m!
!! Volume of gas penetrating membrane cm3/s!
xxi
L
IST OF
A
BBREVIATIONS
Abbreviation Definition
3D Three dimensional
Ar Argon
ARDS Acute Respiratory Distress Syndrome
ARF Acute Respiratory Failure
CH4 Methane
CO Carbon Monoxide
CO2 Carbon Dioxide
CPI Carbonized Polyimide
DI Deionized
DO Dissolved Oxygen
H2 Hydrogen
He Helium
HCl Hydrochloric Acid
Hgb Hemoglobin
H2O2 Hydrogen Peroxide
H2S Hydrogen Sulfide
ID Inner diameter
IPA Isopropanol
KI Potassium Iodide
KMnO4 Potassium Permanganate
Mc Molecular weight between crosslinks
MnO2 Manganese Dioxide
MR Mass ratio
N2 Nitrogen
NaHCO3 Sodium Bicarbonate
NP Nanoparticle
O2 Oxygen
OD Outer diameter
PDMS Polydimethylsiloxane
PI Polyimide
ppm Parts per million
xxii rpm Rotations per minute
SDS Sodium Dodecyl Sulfate
SEM Scanning electronic microscopy
Farah Christina Alimagham – September 2015 1
CHAPTER 1.
I
NTRODUCTION
1.1 Motivation
Acute respiratory failure (ARF) is one of the most common types of organ failure and is associated
with a mortality rate of around 40%, despite the current advanced ventilator support and
extracorporeal oxygenation [1]. From 2001 to 2009, the number of ARF-related hospitalizations in the
US increased from one million to two million [2]. There are a number of causes that may lead to acute
respiratory failure such as airway obstruction, injuries that impair or compromise the respiratory
system (e.g.: injury to the spinal cord or brain), Acute Respiratory Distress Syndrome (ARDS) and
stroke [3]. As a consequence, the lungs cannot release oxygen (O2) (from the inhaled air) into the
blood and in turn, the organs can’t get enough O2-rich blood to function. This prolonged O2
deprivation can quickly lead to serious conditions such as brain damage, cardiac arrest and even
death. In order to prevent this from happening, immediate medical attention is essential so that O2 is
provided as soon as possible [4].
Conventionally, O2 deprivation is treated with inspired O2, mechanical ventilation and intubation;
however, these methods are often too complicated to implement rapidly under emergency situations
and outside of a hospital setting and may not provide O2 at a sufficiently high rate to sustain normal
function of specific vital organs [5], [6]. In addition, in certain ARF situations the airway is blocked
(due to inflammation or other obstructive reasons) preventing intubation and necessitating direct
delivery of oxygen to the blood via intravenous O2 delivery, which may temporarily rise venous and
arterial O2 tensions, thus enabling a safe window of time for definitive intervention, such as institution
of extracorporeal life support or placement of a tracheal tube [6]. For example, a patient with
difficulty breathing and maintaining sufficient oxygenation could avoid a hypoxemic crisis during a
prolonged mechanical ventilation or intubation attempt. The shortcomings of the current technologies
to aid acute respiratory failure motivates investigation into the potential of developing a safe, quick,
and effective system for rapid oxygenation. This poses significant challenges, and to our knowledge,
no such system exists to this day. Researchers have studied the possibility of directly injecting O2 gas
into the blood at different infusion rates; however, in vivo experiments revealed its ineffectiveness
due to fatal pulmonary embolisms, cardiac irregularities, hypotension and death caused by the
formation of O2 bubbles at infusion rates higher than 0.2 to 1 mL/kg per minute (equivalent to 10 to
25% of measured O2 consumption in dogs) and also due to the necessity of frequent pauses in infusion
[7]. A more recent study has demonstrated impressive results in which animals are maintained alive
for 10–15 minutes of complete asphyxia by the injection of lipidic O2-filled microparticles (LOMs)
into the vein that deliver O2 to hypoxic blood [3]. The fabrication of the LOMs, however, is not easily
scalable for mass production, and the overall amount of O2 storage in the particles is suboptimal due
Farah Christina Alimagham – September 2015 2 We have concentrated our efforts in assessing the viability of a straightforward, low cost, and
scalable approach for delivering O2 into the bloodstream without the risk of forming O2 bubbles or
hemolysis. The method, which we wish to assess, is schematized in Figure 1.1.
Figure 1.1. Conceptual schematic of the proposed catheter approach for rapid delivery of oxygen to the blood.
It consists of decomposing hydrogen peroxide (H2O2) into O2 inside an end-sealed, custom catheter
which is deployed intravenously; the H2O2 does not come in contact with live tissue, but enters the
catheter through a concentric tube (on which it is possible to embed catalytic regions) and is
decomposed into O2 once in contact with the catalyst. The generated O2 diffuses out into the
bloodstream through the engineered O2-permeable catheter material. In the present work, our aim is to
evaluate the described approach in terms of its viability and O2-supplying capacity regarding the
possibility of providing a life-sustaining arterial O2 saturation higher than 90% (pO2 of 60 mm Hg).
The amount of O2 that a respiratory assist catheter positioned intravenously would need to add to an
adult patient is 1.6 cm3/s, considering that only 30% of the lung still functional. This amount
corresponds to 50% of the basal O2 requirements, as determined by calculated gas exchange
requirements for an adult patient with various levels of pulmonary damage and residual functional
lung [1]. In order to evaluate the described approach, a proof-of-concept device was developed
according to the function principle depicted in Figure 1.2, where two parallel channels separated by an
O2-permeable membrane that will mimic the interface between the catheter and bloodstream. The O2
generated in the bottom channel (“catheter”) will diffuse through the membrane into the channel
above (“bloodstream”), where its concentration will be measured.
Figure 1.2. Function principle of the proof-of-concept device to evaluate the approach.
Several O2-permeable membranes (catheter material) were developed using different
permeability-enhancing techniques and assessed according to their O2 diffusion capacity and O2 permeability.
Farah Christina Alimagham – September 2015 3 embedding catalytic regions on a tube that is used simultaneously as the H2O2 inlet and decomposing
(into O2) element.
Advancements in this field will contribute to the possibility of supplying O2 directly into the
bloodstream may represent a novel technique to increase O2 delivery to the entire body or to specific
vital organs for short-term rescue of profoundly hypoxemic patients.
The following section in this chapter describes the relevant theory behind this research. Chapter 2
discusses my chosen methodologies including the fabrication and characterization of the O2
permeable membranes, the development and lab implementation of the bench-top test platform and
also development of the inner tube of this approach. Chapter 3 sets out my results and discusses them,
and Chapter 4 draws conclusions and describes relevant future work to be done in this approach.
1.2 Relevant Research
1.2.1 Physiological oxygenation
Oxygen plays a vital role in the breathing processes and
in the metabolism of the living organisms and appropriate
levels are vital to support cell respiration and survival. In
the human body, O2 diffuses through membranes and into
red blood cells after inhalation into the lungs. Figure 1.3
illustrates how O2 and carbon dioxide (CO2) transit
between alveolar air and blood across the respiratory
membrane. The cells of the body consume an average of
250 mL O2 per minute (4.17cm 3
/s). A liter of blood can
dissolve 200 cm3 (mL) of O2 gas, which is much more than
water can dissolve (5.3 mL in a liter of air-saturated water
at 30°C). The amount of O2 that can be held by the water
increases with decreasing temperature and salinity and
decreases with pressure. Since O2 is poorly soluble in
water, without an adjunctive means of transport, it cannot be transported in blood in quantities
sufficient to sustain life (the contribution of DO to the total is only 0.3 mL/dl or less than 1.5% of the
total). The adjunct comes in the form of hemoglobin. O2 can bind to hemoglobin at any of four active
sites on each molecule of hemoglobin. Since there are four binding sites on the hemoglobin molecule
the number of O2 molecules on a hemoglobin molecule ranges from none to four. When four O2
molecules are bound to the molecule, it is said to be 100% saturated. At 100% saturation 1 gram of
hemoglobin carries 1.34 mL of O2.The equation for the content of O2 in arterial blood is as follows:
!!!
!= !"!!!×!!"#!×!1.34 +(0.003!×!!"!!) (1.1)
Figure 1.3. Illustration on how O2 and
CO2 go between alveolar air and blood
Farah Christina Alimagham – September 2015 4 The term for SaO2 (O2 saturation) is expressed as a fraction of 1.0 rather than a percentage (i.e.
0.98 instead of 98%). Hemoglobin is entered in grams and PaO2 (arterial partial pressure of oxygen)
is in mmHg. The term 0.003, derived from O2 solubility coefficients at different temperatures,
assumes a normal body temperature of 37ºC and is expressed as mL O2/dl/mmHg. The partial
pressure (p) of a gas is the proportion of pressure contributed by an individual gas to the total pressure
of a mixture of gases and is found by multiplying the fractional concentration of a gas in a mixture by
the total pressure exerted by a gas mixture [8]. Although partial pressures of O2 is 160 mm Hg, in the
alveoli the pressure is 100 mm Hg, due to exchanges of gas between alveoli and capillaries, mixing of
atmospheric air with air of anatomic dead spaces and saturation of alveoli air with water vapor.
Deoxygenated blood entering the pulmonary capillaries has a pO2 of 40 mm Hg. The O2 diffuses
down its concentration gradient and leaves at the same partial pressures as the O2 in the alveoli (pO2 =
100 mm Hg). The human body requires and regulates a very precise and specific balance of O2 in the
blood and normal levels in humans are considered 95-100%. If the level is below 90%, it is
considered low resulting in hypoxemia. Blood O2 levels below 80% may compromise organ function,
such as the brain and heart, and should be promptly addressed. Continued low O2 levels may lead to
respiratory or cardiac arrest, where O2 therapy may be used to assist in raising blood O2 levels.
Oxygenation occurs when O2 molecules enter the tissues of the body. For example, blood is
oxygenated in the lungs, where O2 molecules travel from the air and into the blood. Oxygenation is
commonly used to refer to medical O2 saturation [9], [10].
When it comes to oxygen-related applications such as this one, finding an adequate way of storing
and generating O2 is vital. Methods of O2 storage for subsequent use, span many approaches including
high pressures in O2 tanks, cryogenics, O2-rich compounds and reaction mixtures, and chemical
compounds that reversibly release O2 upon heating or pressure change [11]. Hydrogen peroxide, a
colorless liquid in its pure form,is a convenient O2 storage medium due to its high O2 composition
and practical temporal stability at room temperature (up to a year for over-the-counter H2O2) and
relatively easy production. The decomposition of H2O2 into O2 can be induced by many means. The
surface of manganese dioxide (MnO2) is known to provide a particularly favorable environment to
catalyze the decomposition through the following reaction [12]:
2!!!!!!(!")!
!"# !(!)
!!
!!(!)+!2!!!(!) (1.2)
1.2.2 Oxygen-permeable membranes: Why PDMS?
One of the main goals of this project is to choose a material with the ideal properties (i.e.
biocompatibility, high oxygen permeability and simple processability) to be used in the final
oxygenating system as the catheter material.
Polydimethylsiloxane (PDMS), has become the preferred material for lab on a chip (LOC) and
Farah Christina Alimagham – September 2015 5 processability, chemical stability, ability to be manipulated and biocompatibility [13]. It is a
mineral-organic polymer, with a structure containing carbon and silicon, of the siloxane family (Figure 1.4).
Figure 1.4. Molecular structure of polydimethylsiloxane. [14]
PDMS permeability has been extensively used to add new features and characteristics to
microfluidic devices and it has been used to move fluids inside micro channels to obtain accurate
control of the liquid and complete filling of the device. By employing this mechanism, it is possible to
create a number of devices that avoid any sort of contamination of external material, since a thin
membrane of PDMS acts as a barrier towards reagents and/or biological species during handling.
Additionally, microfluidic bioreactor systems use PDMS permeability to ensure gas diffusion inside
the reaction chamber for cell culturing applications. In this work, taking advantage of PDMS
permeability is essential since our goal is to test an intravenous O2-generating and supplying catheter,
in which the generated O2 permeates through the catheter material into the bloodstream. For these
tests, it is necessary to obtain a thin PDMS membrane with tuned permeability so that it diffuses O2 in
a controlled way. Several successful investigations on enhancing gas perfusion, and thus PDMS
permeability, have been performed. It has been shown by [15] that it is possible to greatly increase the
permeation of gas molecules through PDMS membranes by varying PDMS composition (i.e. mixing
ratio between oligomers and curing agent), which strongly influences the chemical and mechanical
properties of the elastomer. Manipulating the pore size of PDMS is another permeability-enhancing
technique that can be done by several methods. Kexin Jiao et al. [16] developed porous PDMS
membranes that can selectively diffuse elements of different sizes by embedding micron sized
NaHCO3 particles in PDMS thin films. The membranes are then immersed in concentrated
hydrochloric acid (HCl) to generate pores by evolution of CO2 gas from the reaction between
NaHCO3 and HCl. A more simple way of fabricating microporous PDMS has been described by
Juyue Chen et al. [17] and involves evaporating water from an emulsion of PDMS pre-polymer and
water microbubbles. The high flexibility of the silicon-oxygen (Si-O) chains in silicones provides
“openings”, which are essentially free volumes that allow gas diffusion inside the network. Free
volumes are frequently named “holes” and they are thermally generated and disappear with the
movement of polymer chains. Gas molecule diffusion in rubber membranes is a process in which the
gas molecules migrate from “hole” to “hole”. The rate at which a gas or vapor passes through a
polymer consists of three different permeation mechanisms, depicted in Figure 1.5: (a) absorption of
the permeating species at the polymer/gas interface into the polymer; (b) diffusion through the
Farah Christina Alimagham – September 2015 6 species from the polymer surface and removal. The rate of permeation is a specific function of a given
gas and rubber and it depends on both solubility and the diffusion rate. In most of applications,
permeability of a membrane is used to characterize the rate of permeation and is usually calculated by
the following equation:
!
=
!
!"(!!" !!!!)(1.3)
where, P is the permeability for a given gas in a given membrane,
!
is the volume of gas whichpenetrates through the membrane,
!
is the thickness of membrane,!
is the area of membrane, t istime, !! is the partial pressure of the gas on the higher pressure side of the membrane, and !! is the
partial pressure of the gas on the lower pressure side of the membrane.
Figure 1.5. 3D scheme depicting the gas diffusion mechanism in a PDMS membrane. [15]
In general, permeability of a polymer for a gas mixture increases with decreasing size and
increasing solubility (or condensability) of the gas. The relative permeability of a gas is given below
in order of decreasing gas permeability as:
H2 > He > H2S > CO2 > O2 > Ar > CO > CH4 > N2
The O2 permeability in PDMS is significantly higher than in other polymers. Table 1.1 indicates
O2 permeabilities in various common polymer membranes.
Table 1.1. O2 permeabilities in various polymers [18].
Polymer O2 Permeability × 10!
!"!
! !"# !∙!!!"!∙!!!!!∙!!"!!!!∙!!"!!"!!
PDMS 60
BPA polycarbonate 0.16
Polystyrene (PS) 0.12
Cellulose acetate 0.08
In our work, we attempt to enhance the permeability of PDMS membranes by using the previously
mentioned techniques, namely varying the crosslink ratio of the PDMS, embedding NaHCO3 particles
to form pores (as well as a combination of these two) and a modified version (in film form) of the
water-in-PDMS emulsion technique to form micropores. Also, we will use a combination of the first
two techniques. These films will then be tested on the developed test platform and characterized in
Farah Christina Alimagham – September 2015 7
CHAPTER 2.
M
ATERIALS AND
M
ETHODS
2.1 Oxygen-permeable membrane development and characterization
Several PDMS membranes were developed using three different permeability-enhancing
techniques similar to what has been described in the literature. These techniques included: (A)
increasing PDMS base-crosslinker ratio [15], (B) embedding NaHCO3 particles in PDMS to generate
porous membranes [16] and (C) creating a water-in-PDMS emulsion concentrations to generate
microporous in-bulk PDMS [17]. The modifications we made to these techniques were combining the
first two techniques (A and B) to develop macroporous PDMS membranes and using the
water-in-PDMS emulsion technique (C) to develop microporous water-in-PDMS membranes (as opposed to in-bulk
form described in literature).
2.1.1 Macroporous PDMS membrane development
Macroporous PDMS membranes were prepared using a combination of the base-crosslinker ratio
variation and NaHCO3 particle embedment techniques. The membranes were prepared mixing
polymer base and the curing agent (Sylgard 184, Dow Corning, Midland, MI) with different weight
ratios (10:1, 15:1, and 20:1)a. Powdered NaHCO3 (AR. ACS Grade, 99.7-100.3 %, Mallinckrodt, St.
Louis, MO, USA) at different concentrations (0, 10, 15, 20 and 30%) was manually grinded using a
mortar and pestle and mixed in the pre-polymerized PDMS at different ratios. A spin-coater (6800
Spin Coater, Specialty Coating Systems, Indianapolis, IN, USA) was used to control the thickness of
the PDMS membrane using defined spinning rates with thicknesses in the range of 70-220 µm. Table
2.1 shows the parameters used to develop the membranes. The membranes were spin-coated for 30
seconds onto silicon wafers which were first silanized using a drop of
trichloro(3,3,3-trifluoropropyl)-silane (97%, Sigma-Aldrich, Inc., St. Louis, MO, USA) in vacuum to prevent the PDMS from
adhering to it after curing. The resulting membranes were cured in an oven (Single-Wall Transite
Oven, BlueM Electric Company, Blue Island, IL, USA) at 75 oC, the optimal cross-linking
temperature, resulting in membranes with the highest gas permeation compared to those cross-linked
at RT or above 100 oC, according to K. Berean et al. [23]. Once cured, the membranes with higher
base-crosslinker ratio than the standard (10:1) were first placed in a solvent, Hexane (anhydrous, 95%,
Sigma-Aldrich, Inc., St. Louis, MO, USA), overnight in order to induce membrane swelling and
dilation so that the uncrosslinked regions are removed, leading to a higher volume of open spaces
within the membrane. The membranes were then placed first in Acetone (J.T.Baker, Avantor
Performance Materials, Inc., Center Valley, PA, USA) and then Isopropanol (IPA) (J.T.Baker,
Avantor Performance Materials, Inc., Center Valley, PA, USA) and immersed in ultrasonic for one
a
cross-Farah Christina Alimagham – September 2015 8 hour in each in order to shrink back to their original size. The membranes containing any percentage
of NaHCO3 particles were then immersed in 10 % HCl (36.5-38.0 %, J.T.Baker, Avantor Performance
Materials Inc., Center Valley, PA, USA) for 1-3 days in order to dissolve away all the NaHCO3,
leaving behind voids within the membranes. Bubbles were observed during this process, indicating
that CO2 was released from the reaction between the HCl and the embedded NaHCO3. After removal
from HCl, the membranes were washed thoroughly with water and ethanol and air-dried.
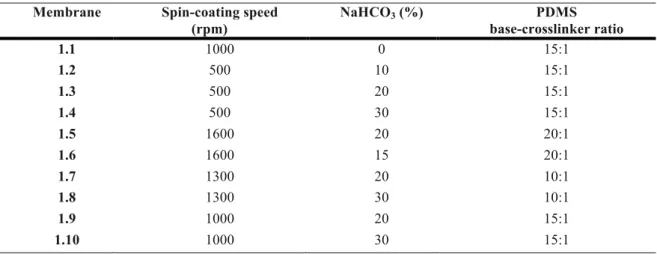
Table 2.1. Macroporous PDMS membrane specifications.
Membrane Spin-coating speed
(rpm)
NaHCO3 (%) PDMS
base-crosslinker ratio
1.1 1000 0 15:1
1.2 500 10 15:1
1.3 500 20 15:1
1.4 500 30 15:1
1.5 1600 20 20:1
1.6 1600 15 20:1
1.7 1300 20 10:1
1.8 1300 30 10:1
1.9 1000 20 15:1
1.10 1000 30 15:1
2.1.2 Microporous PDMS membrane development
The technique used to develop microporous PDMS membranes was the water-in-PDMS emulsion
technique. PDMS was mixed with the standard mass ratio of base-crossliker (10:1). A sodium dodecyl
sulfate (SDS) (Molecular Biology Grade, > 99 %, Research Products International Corp., Mt.
Prospect, IL, USA) was prepared with a mass ratio of SDS to DI water of 1:100. The PDMS
pre-polymer and water (with 1% SDS) were manually blended together at different volume percentages
(20 and 30 %) until a uniform emulsion (opaque) was formed. The water-in-PDMS emulsion was then
spin-coated for 30 seconds at different speeds to control thickness. Table 2.2 represents the
spin-coating and water percentages used in the membrane development. The mixture was first place in the
oven for 15 minutes at 75 oC until the pre-polymer is partially cured with the water microdroplets
inside. Then they were immediately transferred to a hotplateat a higher temperature of 120 oC so that
the water trapped in the PDMS membrane evaporates, leaving behind numerous pores within the
matrix.
Table 2.2. Microporous PDMS membrane specifications.
Membrane Spin-coating speed (rpm) Water (%)
2.1 500 20
2.2 500 20
Farah Christina Alimagham – September 2015 9 Light microscopy images were obtained for the functional porous membranes developed using the
NaHCO3 technique and one of the films developed by developed by water-in-PDMS emulsion using a
High performance Microscope (MicroZoomII S-450, Bausch & Lomb Inc., Bridgewater, New Jersey,
USA). For all the microporous membranes developed by water-in-PDMS emulsion, SEM images
were obtained on a Field-emission Scanning Electron Microscope (FE-SEM) (S-4800, Hitachi,
Japan). The membranes were mounted on a carbon tape affixed to an aluminum stub and loaded in the
SEM. The use of image analysis software, ImageJ (version 1.48, NIH, USA), was used to quantify the
percent porosity and pore size of the functional membranes.
2.1.3 Permeability characterization
A custom made permeation measuring platform was developed in order to characterize membrane
permeability of both microporous membranes (20 % and 30 % water) and compare them to the known
value of non-porous PDMS. The several components that constitute the platform are schematized in
Figure 2.1.
Figure 2.1. Permeability measuring device and its components.
This system is based on the permeability equation (eq. 1.3). Accordingly, if the values of the
membrane thickness and exposed area are known, then, by applying a constant flow-rate and
measuring the pressure difference across the membrane once it has stabilized, we are able to
determine the permeability coefficient of the developed membranes [13]. The base of the permeation
cell consisted of a conical test tube (50 mL, Falcon, Fisher Scientific, Inc., Waltham, MA USA) with
the end cut off and bonded with Epoxy Adhesive (Devcon Adhesives & Sealants, Danvers, MA,
USA). A circular acrylic ring (4) was sealed inside the tube with glue. In order to keep the films from
expanding (i.e. a constant permeation area), aluminum screening (New york wire, Grand Island, NY,
USA) was embedded in a PDMS ring (3). An additional acrylic ring (2) is used to press the PDMS
ring firmly against the acrylic ring bellow using the tube’s screw-on lid (1) so that the platform is
air-sealed. For the measurements, the PDMS membranes were mounted between rings 3 and 4 with an
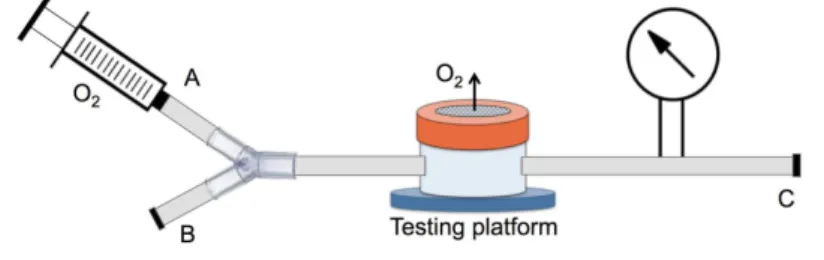
exposed area of 12.5 mm2. The apparatus used for measuring permeation rates for O2 in the PDMS
membranes is depicted schematically in Figure 2.2. The entire setup is filled with 100% O2 gas.
Initially, O2 was flushed through A and out first through B and C simultaneously. Then, a 60 mL
Farah Christina Alimagham – September 2015 10 the system is filled with 100 % O2, the syringe is placed on the single syringe pump and a constant
flow-rate is applied (between 10 and 30 µL/min).
Figure 2.2. Permeability measuring setup.
The pressure was continuously monitored on the High Accuracy Digital Pressure Gauge
(DPG4000 Series, OMEGA Engineering Inc., Stamford, CT, USA) until stabilized. At steady state
condition, gas permeability was calculated using eq. 1.3. Leakage of the device was tested before each
use. In order to do this, a sacrificial membrane was mounted on the platform and the entire setup
(including all luer connections and endings) was submerged in water and pressures up to 600 mm Hg
were applied to the syringe. If no bubbles were noticed, the device was ready to use. A normal PDMS
membrane was first tested on this setup in order to determine its accuracy. All measurements were
carried out at room temperature, 21 ºC.
In order to analyze the deflection capacity of a standard PDMS membrane to increasing pressures
and evaluate the amount of pressure it is able to withstand, the same platform and setup as the
permeability test was used, except for this time, the aluminum screening embedded in a PDMS ring
was replaced with a PDMS ring without the screening to enable deflection of the membrane.
Increasing pressures were applied manually to the setup (starting from 10 mmHg to 820 mmHg) using
a 60 mL syringe. Images of the membranes were captured at the varying pressures.
2.2 Proof-of-concept device
2.2.1 Fabrication
A proof-of-concept device that mimics the catheter-bloodstream interface was developed to test
the viability of our approach, and therefore, the O2 diffusing capacity of several PDMS membranes
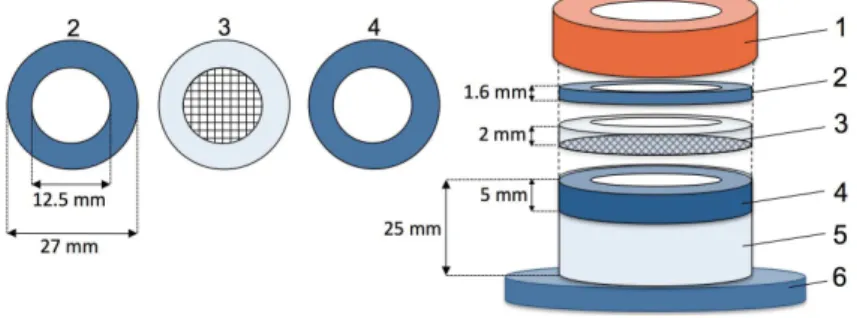
with enhanced O2-permeability. Figure 2.3 represents the several components that constitute the
device. The device was fabricated by stacking and sealing together (using screws) intercalated layers
of PDMS and acrylic. The PDMS layers (2 and 5) act as a sealant between layers while 2 also
provides a firm fitting for the liquid inlet/outlet elbow fluid-connectors (Value Plastics Inc., Nordson
Company Fort Collins, CO) that are inserted through the top acrylic layer (1). The acrylic layers (1, 3,
4 and 6) provide the device with rigidity so that all layers can be clamped together using screws and
knots in order to prevent any leakages out of the channels. First, PDMS was mixed according to
manufacturer specifications and poured into a Petri dish. After curing for 4 hours at 75 ºC in the oven,
Farah Christina Alimagham – September 2015 11
commercial 10.6 µm pre-aligned CO2 laser engraver (PLS6MW, Universal Laser Systems Inc.,
Scottsdale, AZ, USA); the CO2 laser was used with a maximum power of 75 W and maximum linear
speed of 4 m/s.
The shape designs were made using Coral draw software (CorelDRAW Graphics Suite X6, Corel
Corporation) and transferred to the PLS6MW Laser Viewer software for setting adjustments and
operating the laser. The laser settings used for each of the materials and respective thicknesses are
shown in Table A.1, Appendix A. Layers1, 4 and 6 have a thickness of 1.6 mm; layers 2 and 3 are 5
mm thick and layer 5 is 3 mm thick. The two innermost acrylic layers (3 and 4) contain the two
laser-machined parallel channels that mimic (in dimension and applied pressure) the interface between the
catheter (lower channel) and bloodstream (upper channel) once separated by an O2-permeable
membrane. The upper channel was made to hold the same volume as the human basilic vein (typically
5 mm diameter, holding 2 mL in a 1 cm section), with dimensions 3×28×1.6 mm3, while the lower channel has an exposed surface area of 60 mm2. A 1 mm-thick strip of PDMS loaded with the MnO2
microparticles (≥ 99 %, Sigma Aldrich, St. Louis, MO, USA), with the particles exposed at the surface, made by mixing the MnO2 particles in uncured PMDS, pouring it into a petri dish and curing
it at 75 ºC. Once cured, it is demolded and cut into channel-size strips with a razor blade so that it fits
into the bottom of the lower channel.
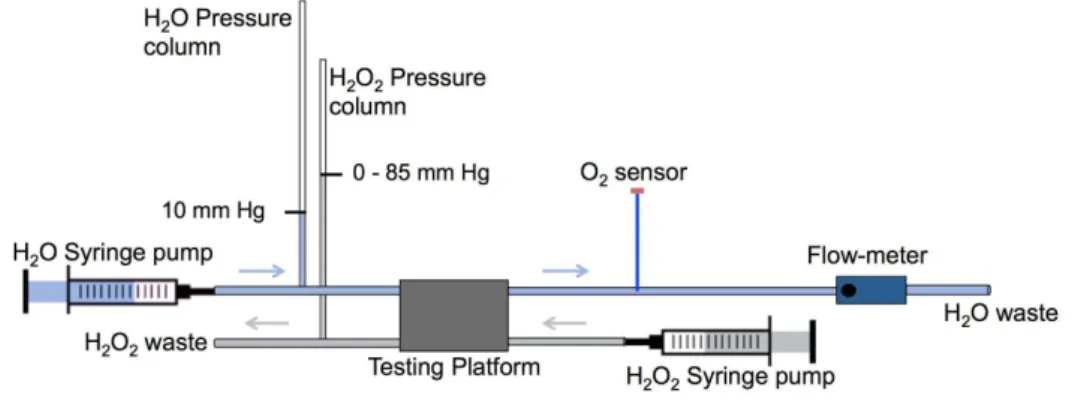
2.2.2 Lab implementation
In this section, the lab setup to implement the device for membrane assessment is described in
detail. Here, a controlled flow of de-oxygenated (bubbled with nitrogen gas), de-ionized water is
pumped through the upper channel in the opposite direction of H2O2 flow that is pumped through the
Farah Christina Alimagham – September 2015 12 channel bellow (channels are separated by a membrane). Water was used in the tests since it is easier
to handle on a daily basis than is blood. Water data, however, can be accurately converted to data
obtained with blood by multiplying water results by a factor of 5, based on blood solubility and
viscosity compared to water [1], [24]. The H2O2 (30 %, J.T.Baker, Avantor Performance Materials,
Inc., Center Valley, PA, USA) at 15 % concentration is pumped through the lower channel at a
constant flow, where it is decomposed into O2 by the chemical catalyst, MnO2 microparticles, within
the channel. The amount of O2 that diffuses through the membrane and is released into the
deoxygenated water (upper channel) was quantified using an optical O2 sensor (Neofox Oxygen
Sensor, Ocean Optics Inc., Dunedin, FL, USA). Figure 2.4 reveals the setup used to implement the
device. Appendix B shows a real image of the lab implementation of the testing device.
Figure 2.4. Laboratory setup for implementing the fabricated testing device.
Initially, a given membrane was carefully mounted on the unassembled device so that it separates
the two channels. The device was then assembled and clamped. Before running any tests, the device
and membrane were checked for leakages by flowing a dyed solution (5% food coloring in DI water)
through the lowerchannel. For any dyed water that passed through into the upper channel indicates a
leakage in the device or a torn/faulty membrane to be discarded. In order to have a controlled
flow-rate in both channels, two 140 mL syringes (Covidien Ltd., Suwanee, GA, USA), mounted on a
double syringe pump (NE-4000, New Era Pump Systems Inc., Farmingdale, NY, USA), were
connected to the upper channel inlet and a 60 mL syringe (BD, Franklin Lakes, NJ, USA), mounted
on a single syringe pump (NE-1000, New Era Pump Systems Inc., Farmingdale, NY, USA) was
connected to the lower channel inlet. The flow-rates in the upper (H2O) and lower (H2O2) channels
were 1 mL/min and 0.5 mL/min respectively. Both fluidswere set to flow through Medical Grade
Teflon tubes from the syringe pump, past the pressure column, and through the O2-generating device.
The Teflon tube carrying the deoxygenated water had an inner diameter of 5 mm (approximate
diameter of the basilic vein). Pressure columns were used to induce pressure in both channels. In the
water channel, the pressure was kept constant at 10 mm Hg (hydrostatic pressure of the basilic vein)
while the pressure in the H2O2 channel was gradually increased from 0 to 85 mm Hg, meaning that the
Farah Christina Alimagham – September 2015 13 microscope was used to verify the appearance of bubbles in the device during the tests. The O2 sensor
was calibrated using the standard two-point calibration described in the Installation and Operation
Manual. A flow meter (RMA Series, Dwyer Instruments, Inc, Mich. City, IN, USA) was used at the
end of the water channel in order to precisely control the flow rate in the H2Ochannel. The sensor
probe was then inserted into the watertube immediately after the O2-generating platform and the
concentration of O2 inside the channel was measured with increasing ΔP across the channels during a given period of time. The data is acquired on its specified operating software (NeoFox Viewer,
version 2.4). The acquired water data was accurately converted to blood data and an extrapolation was
to determine the values that would be obtained for increased surface areas and pressure gradients.
2.3 Development of the MnO2-embedded Polyimide tube
Figure 2.5 depicts the several steps taken to embed MnO2 NPs in the polyimide (PI) tube wall.
Figure 2.5. Scheme depicting the procedure for embedding MnO2 nanoparticles in a PI tube.(a)
Carbonization of tube by laser-machining; (b) embedment of MnO2 nanoparticles in; (c) PI tube with embedded
MnO2 nanoparticles.
Select regions of the external wall of a PI tube (triple wall, Translucent Amber, Small Parts,
Logansport, IN, USA) with 2 mm ID and 2.2 mm OD, were carbonized by controlled laser ablation
using the CO2 laser cutter. The PLS6MW Laser’s rotary fixture accessory was used, providing the
ability to engrave cylindrical objects. In order to place the polyimide tube on the rotator fixture, an
aluminum wire with a similar ID as the tube was threaded through and fixed inside a conical test tube
with a rectangular opening cut into the wall so the tube is exposed. The test tube was then fixed into
the rotator fixture. The laser parameters used on the tube are included in Table A.1 – Appendix A.
The carbonized residues provide a high surface area, allowing the embedment of MnO2 nanoparticles.
The MnO2 particles were synthesized according to the following chemical reaction:
!"#!
!(!")+!"(!")→!"!!(!)+!"!!(!") (2.1)
A 20 mL solution of 5 % w/v Potassium permanganate (KMnO4) (powder, 97 %, Sigma-Aldrich,
Farah Christina Alimagham – September 2015 14 first dipped into the KMnO4 solution and then into the KI solution. The MnO2 nanoparticles were
synthesized in situ, embedded into the carbonized polyimide (CPI) tube. A 1 mL droplet of 15 %
H2O2 was then placed on the tube using a disposable pipette in order to prompt the generation of O2
Farah Christina Alimagham – September 2015 15
CHAPTER 3.
R
ESULTS AND
D
ISCUSSION
We engineered a bench-top testing device to mimic the interface between the idealized custom
catheter and the bloodstream. Several PDMS membranes with enhanced oxygen permeability were
developed to mimic the catheter material of the final system and tested on the device regarding the
oxygen permeation rate they enable. The oxygen generated within the channel of the device that
mimics the catheter permeates into the channel that mimics the bloodstream and is measured by
means of an oxygen sensor.
3.1 Oxygen-permeable membranes
The oxygen-permeable membranes that were developed based on the combination of the increased
base-crosslinker ratio and NaHCO3 embedment techniques as well as the water-in-PDMS emulsion
technique and their corresponding parameters and functionality are shown in tables 3.1 and 3.2
respectively. As previously mentioned, before testing each membrane, they were first checked for
leakages and other defects. The functional membranes (marked with !) were tested on the platform,
while the membranes containing defects (marked with") were discarded.
Table 3.1. Parameters of the macroporous membranes developed using NaHCO3 and varying crosslink
ratios.
Membrane Spin-coating
speed (rpm)
Thickness
(µm)
NaHCO3 (%) PDMS
base-crosslinker ratio
Functionality
1.1 1000 100 0 15:1 !
1.2 500 220 10 15:1 !
1.3 500 220 20 15:1 !
1.4 500 220 30 15:1 !
1.5 1600 --- 20 20:1 "
1.6 1600 --- 15 20:1 "
1.7 1300 70 20 10:1 "
1.8 1300 --- 30 10:1 "
1.9 1000 120 20 15:1 "
1.10 1000 --- 30 15:1 "
Table 3.2. Parameters of the microporous membranes developed using water-in-PDMS emulsion.
Membrane Spin-coating
speed (rpm) Thickness (µm) Water-in-PDMS (%) Functionality
2.1 500 200 20 !
2.2 1000 70 20 !
Farah Christina Alimagham – September 2015 16 Regarding the macroporous membranes (Table 3.1), membranes 1.1 to 1.4 (corresponding to 0, 10,
20 and 30 % NaHCO3 and 15:1 PDMS base-crossliker ratio), didn’t show any defects or leakages
during the leakage test and were therefore eligible for testing on the testing platform. On the other
hand, membranes 1.5 to 1.8 and membrane 1.10 revealed to be too brittle and sticky for handling and
were torn immediately upon removal from the HCl bath. The brittleness and stickiness of these films
may be associated with simultaneous embedment of relatively high NaHCO3 particle concentrations
and high base-crosslinker ratios as well as their decreased thicknesses (for higher rotation speeds).
According to literature [15], the elastic modulus of free-standing PDMS membranes increases with
the amount of crosslinker since a tighter network is formed. Accordingly, lower than suggested
quantities of crosslinker could lead to a lower crosslinking density. Therefore when using PDMS
base-crosslinker ratios much higher than suggested (10:1), the high disparity between pre-polymer
and curing agent leads to a highly sticky and not manageable PDMS membrane. Even though
literature suggests that a base-crosslinker ratio of 20:1 is perfectly manageable and results in a higher
O2 permeability, the addition of porogens, such as NaHCO3 particles (in this case), did not allow for
manageable membranes below a certain thickness. Membrane 1.9 (20 % NaHCO3 and 15:1 PDMS
base-crossliker ratio) showed favorable testing properties at first sight, as it was easy to handle and
showed no signs of leakage. However, once it was setup on the device and a pressure gradient of 12
mm Hg across the membrane was achieved, signs of leakage were detected. A possible reason for the
occurrence of leakages in this membrane is discussed and referred to in the next few paragraphs while
discussing the porous membrane morphology.
For the reasons mentioned above, membranes 1.5 to 1.10 were discarded and focus was given to
membranes 1.1 to 1.4 for the device tests.
Concerning the microporous membranes (Table 3.2), membranes 2.1 to 2.3 (corresponding to 20
% water in PDMS, spin-coated at 500 and 100 rpm, and 30 % water in PDMS, spin-coated 1000 rpm),
there were no signs of leakage or brittleness, making them all good candidates for testing on the
device.
Figure 3.1 shows light microscope images of the functional macroporous PDMS membranes (1.1
to 1.4), developed by NaHCO3 particle embedment and one microporous PDMS membrane (2.1),
developed by water-in-PDMS emulsion, for pore-size comparison. Images (a), (b) and (c) of figure
3.1 reveal a significant number of pores/voids within the membrane, that are possible to observe given
the PDMS membrane transparency. The red circles outline the pores that are larger in dimension
while the blue circles outline the pores that are smaller. The measured pore-sizes of these membranes
range between 20 and 250 µm, representing a high non-uniformity, which may be explained primarily
by the non-uniformity of the NaHCO3 particles used in their development. Another contributing factor
to the non-uniform pore shapes and sizes may be caused by the acid (HCl) treatment used to dissolve
and wash away the NaHCO3 particles during their development. The reaction between the NaHCO3
Farah Christina Alimagham – September 2015 17
Figure 3.1. Light microscope images showing the pores of the PDMS membranes prepared. (a) Membrane 1.2 (10 % NaHCO3); (b) Membrane 1.3 (20 % NaHCO3); (c) Membrane 1.4 (30 % NaHCO3) and (d) Membrane
2.1 (20 % water, spin-coated at 500 rpm). Red and blue denote the large pore and small pores respectively within the membrane. Scale bars represent 200 µm.
In addition, the release of CO2 may also be responsible for the formation of through-channels in
the PDMS membranes, which could explain the occurrence of leakages observed in membrane 1.9.
The formation of through-channels in the membranes is a non-desirable phenomenon for our
application since the goal is to achieve a leakage-free hydrophobic membrane with increased
permeability to oxygen gas. However, if the diameter of the channels that form are sufficiently small,
they do not pose a great risk of leakage due to a capillary action effect in which the combination of
surface tension (caused by the cohesion within the liquid) and adhesive forces between the liquid and
channel walls act to keep the liquid from passing through the membrane. Comparing the membranes
developed using embedded NaHCO3 particles at different concentrations with the membrane
developed by water-in-PDMS emulsion (Figure 3.1 – (d)), it is evident that the latter reveal much
smaller pore-sizes. Since pore sizes of the microporous membranes (2.1 to 2.3) were significantly
a b
Farah Christina Alimagham – September 2015 18 smaller and not clearly visibly by light microscopy, they were imaged under SEM, depicted in Figure
3.2. The green circles outline holes while the orange circles outline cavities formed on the surface of
the membranes as a result of the evaporation of the trapped water bubbles within the membranes. The
difference between these two formations on the surface is simply due to the different position of the
trapped water bubbles in the partially cured PDMS. Water bubbles that were trapped near the surface
of the membrane resulted in cavities while the water bubbles that were trapped further in the
membrane network resulted in holes. Here, unlike in the NaHCO3-based membranes, there is little to
no chance of through-channel formation, but rather dead-ended tunnels. These membranes revealed
pore sizes ranging between 0.4 and 2 µm. However, differences regarding pore sizes as well as
cavity/hole formation are observed between the membranes spin-coated at different speeds (500 and
1000 rpm). The SEM results show that membranes spin-coated at a 1000 rpm (Figure 3.2 – (b) and
Figure 3.2. SEM images of the prepared microporous PDMS membranes. (a) Membrane 2.1 (20 % water, spin-coated at 500 rpm); (b) Membrane 2.3 (30 % water, spin-coated at 1000 rpm) and (c) Membrane 2.2 (20
% water, spin-coated at 1000 rpm). Green and orange represent holes and cavities respectively on the membrane surface. Scale bars represent 50 µm.
a b
Farah Christina Alimagham – September 2015 19 (c)) revealed significantly smaller pore sizes and a larger number of cavities (rather than holes) on the
membrane surface in comparison to the membrane spin-coated at 500 rpm (Figure 3.2 – (a)). This
suggests that at higher rotational speeds, the droplets were found closer to the surface of the
membrane, which may be explained by the thinning of the membrane (as the film thins, its surface
passes through several cross-sections of more particles than a thicker film would). The smaller pore
sizes for the membranes developed at 1000 rpm occur as a result of the larger water droplets (with a
higher mass) being spun off the edge of the substrate due to the higher centrifugal force. In other
words, the higher rotational speeds promote a selective removal of water droplets with higher mass,
leaving behind the smaller water droplets. In addition, it is evident that higher concentrations of pores
are visible in the membrane developed using a higher concentration of water droplets.
In our application, the main goal is to achieve a membrane with the highest O2 permeability
possible, while still maintaining integrity and uniformity of the membrane in order to avoid the
formation of O2 bubbles and leakages. The water-in-PDMS technique enabled simple development of
microporous PDMS membranes with much higher uniformity while still providing a significant
number of pores, compared to the membranes developed using NaHCO3 particles. This method
showed to be much more practical since there is no need to soak the membranes for several
hours/days in order to wash away the porogen particles.
The porosities of the developed PDMS membranes were quantified by image analysis and are
represented in Table 3.3.
Table 3.3. Porosity of the macroporous and microporous PDMS membranes.
NaHCO3 (%) Water (%)
10 20 30 20 30
Spin-coating speed 500 500 500 500 1000 1000
Porosity, n (%) 34 54 85 18 25 33
For the macroporous membranes, developed using NaHCO3, results show that the porosity of the
membranes depends on the percentage of NaHCO3 particles embedded in PDMS. Higher amounts of
NaHCO3 particles result in membranes with higher porosities. The highest percent porosity (85 %)
was achieved for the membrane developed using 30 % NaHCO3.
Regarding the membranes developed by water-in-PDMS emulsion, the same trend was verified in
which an increased percentage in water resulted in membranes with increased porosity. The highest
porosity (33 %) was achieved for the membrane developed by 30 % water-in-PDMS. In addition, this
data reveals a slight increase in porosity for the 20 % water-in-PDMS membrane, spin-coated at 1000
rpm compared to the 20 % water-in-PDMS membrane, spin-coated at 500 rpm, which means that
spin-coating at higher rotational speeds does not compromise the porosity values of the membranes.
With the latter in consideration, it is possible to develop thinner microporous PDMS membranes with
Farah Christina Alimagham – September 2015 20
oxygen. Even though in eq. 1.3, the permeability is normalized by thickness, the amount of gas that
diffuses through the membrane does depend on the thickness, meaning that thinner membranes result
in more total gas diffusion.
The possibility of achieving a higher porosity using this technique whilst maintaining the current
thicknesses (70 – 200 µm) revealed itself challenging given the difficulty encountered when mixing
higher quantities (> 30 %) of water in PDMS by manual blending. In order to do so, mechanical
blending may be required.
3.1.1 Membrane Permeability Measurements
The permeation properties were determined utilizing a constant flow-rate/variable pressure
apparatus with known membrane thicknesses and a known exposed membrane surface area (12.5
mm2). Permeability measurements were solely carried out for the microporous PDMS membranes,
namely the membranes developed by 20 and 30 % water-in-PDMS emulsion. A standard non-porous
PDMS membrane was initially tested on the membrane for comparison. According to eq. 1.3, we were
able to calculate the permeabilities of the membranes, with known thickness and exposed surface
area, by applying a constant known flow-rate and measuring the pressure in the chamber once the
system is stabilized. Table 3.4 shows the oxygen permeability values for the membranes, determined
using the permeation-measuring apparatus.
Table 3.4. Measured O2 permeability of the developed membranes. Permeability to O2 × 10!
!"!
! !"# !∙!!!"!∙!!!!!∙!!"!!!!∙!!"!!"!! Membranes
Non-porous PDMS 78
Microporous PDMS, 20 % water 129 Microporous PDMS, 30 % water 175
For the standard non-porous PDMS membrane, a permeability value of 78!×!10!
![!"!! !"# ∙!!"∙
!!!∙!"!!∙!"!!"!!] was obtained. The proximity of this value with the value of standard PDMS
permeability, measured under similar conditions,found in literature (60 ×!10!![!"!! !"# ∙!!"∙!!!∙
!"!!∙!"!!!!!]) [18], indicates that the setup we developed represents a viable and practical
methodology of determining polymeric membrane permeabilities in a laboratory setting.
In comparison to the non-porous PDMS, both microporous PDMS membranes revealed higher
permeability values: 129 ×!10! ![!"!
! !"# ∙!!"∙!!!∙!"!!∙!"!!"!!] and 175 ×!10! ![!"!
! !"# ∙
!!"∙!!!∙!"!!∙!"!!"!!] for the membranes made with 20 % and 30 % water-in-PDMS respectively.
This confirms that the presence of pores in the PDMS membrane structure significantly increases the


![Figure 1.4. Molecular structure of polydimethylsiloxane. [14]](https://thumb-eu.123doks.com/thumbv2/123dok_br/16698905.743928/27.892.332.582.183.287/figure-molecular-structure-of-polydimethylsiloxane.webp)
![Figure 1.5. 3D scheme depicting the gas diffusion mechanism in a PDMS membrane. [15]](https://thumb-eu.123doks.com/thumbv2/123dok_br/16698905.743928/28.892.318.602.416.562/figure-scheme-depicting-gas-diffusion-mechanism-pdms-membrane.webp)