ACPD
11, 32583–32600, 2011CO2(ν
2)-O quenching rate coefficient
A. G. Feofilov et al.
Title Page
Abstract Introduction
Conclusions References
Tables Figures
◭ ◮
◭ ◮
Back Close
Full Screen / Esc
Printer-friendly Version Interactive Discussion
Discussion
P
a
per
|
Dis
cussion
P
a
per
|
Discussion
P
a
per
|
Discussio
n
P
a
per
|
Atmos. Chem. Phys. Discuss., 11, 32583–32600, 2011 www.atmos-chem-phys-discuss.net/11/32583/2011/ doi:10.5194/acpd-11-32583-2011
© Author(s) 2011. CC Attribution 3.0 License.
Atmospheric Chemistry and Physics Discussions
This discussion paper is/has been under review for the journal Atmospheric Chemistry and Physics (ACP). Please refer to the corresponding final paper in ACP if available.
CO
2
(
ν
2
)
-O quenching rate coe
ffi
cient
derived from coincidental SABER/TIMED
and Fort Collins lidar observations of the
mesosphere and lower thermosphere
A. G. Feofilov1, A. A. Kutepov2,3, C.-Y. She4, A. K. Smith5, W. D. Pesnell3, and R. A. Goldberg3
1
Centre National de la Recherche Scientifique/ ´Ecole Polytechnique, UMR8539, Palaiseau-Cedex, 91128, France
2
The Catholic University of America, Washington DC, 20064, USA 3
NASA Goddard Space Flight Center, Greenbelt, MD, 20771, USA 4
Colorado State University, Fort Collins, CO, 80523, USA 5
National Center for Atmospheric Research, Boulder, 80307, CO, USA
Received: 24 October 2011 – Accepted: 1 December 2011 – Published: 9 December 2011
Correspondence to: A. G. Feofilov ([email protected])
ACPD
11, 32583–32600, 2011CO2(ν
2)-O quenching rate coefficient
A. G. Feofilov et al.
Title Page
Abstract Introduction
Conclusions References
Tables Figures
◭ ◮
◭ ◮
Back Close
Full Screen / Esc
Printer-friendly Version Interactive Discussion
Discussion
P
a
per
|
Dis
cussion
P
a
per
|
Discussion
P
a
per
|
Discussio
n
P
a
per
|
Abstract
Among the processes governing the energy balance in the mesosphere and lower ther-mosphere (MLT), the quenching of CO2(ν2) vibrational levels by collisions with O atoms
plays an important role. However, there is a factor of 3–4 discrepancy between various measurements of the CO2-O quenching rate coefficient,kVT. We retrievekVT in the al-5
titude region 80–110 km from coincident SABER/TIMED and Fort Collins sodium lidar observations by minimizing the difference between measured and simulated broad-band limb 15 µm radiances. The retrievedkVT varies from about 5×10
−12
cm3s−1 at 87 km to about 7×10⁻¹²cm3s−1at 104 km. A detailed consideration of retrieval errors and uncertainties indicates deficiency in current understanding the non-LTE formation
10
mechanism of atmospheric 15 µm radiances. An updated mechanism of CO2-O
colli-sional interactions is suggested.
1 Introduction
Infrared emission in 15 µm CO2band (I15 µm) is the dominant cooling mechanism in the
Earth’s mesosphere and lower thermosphere (MLT) (Gordiets et al., 1976; Dickinson,
15
1984; Goody and Yung, 1989; Sharma and Wintersteiner, 1990). On Earth, the magni-tude of MLT cooling affects both the mesopause temperature and height; the stronger the cooling, the colder and higher is the mesopause (Bougher et al., 1994). TheI15 µm
radiance is also used to retrieve vertical temperature distributions (T[z]) in Earth’s atmo-sphere by a number of satellite instruments: CRISTA (Offermann et al., 1999), SABER
20
(Russell et al., 1999), MIPAS (Fischer et al., 2008). The main mechanisms linking the 15 µm CO2 atmospheric radiation to the heat reservoir (translational degrees of
free-dom atmospheric constituents) are the inelastic collisions of CO2molecules with O(3P) atoms: first, atomic O excites the CO2bending vibrational mode during the collision:
CO2(ν2)+O(3P)↔CO2(ν2+1)+O(3P) (1)
ACPD
11, 32583–32600, 2011CO2(ν
2)-O quenching rate coefficient
A. G. Feofilov et al.
Title Page
Abstract Introduction
Conclusions References
Tables Figures
◭ ◮
◭ ◮
Back Close
Full Screen / Esc
Printer-friendly Version Interactive Discussion
Discussion
P
a
per
|
Dis
cussion
P
a
per
|
Discussion
P
a
per
|
Discussio
n
P
a
per
|
after which the excitation may be quenched either by other collision with some molecule or atom or by emission of the radiation quantum: CO2(ν2+1)→CO2(ν2)+hν
(667 cm−1), whereν2is the bending mode quantum number. Both the cooling efficiency
andI15 µm strongly depend on the rate coefficient of process (1) and on the atomic O
volume mixing ratio (VMR). To be consistent with a generally accepted way of
describ-5
ing this process we will refer to the rate coefficient of the reaction inverse to (1) and will call it the “CO2-O quenching rate coefficient” or kVT, where VT index stands for
vibrational-translational type of interaction. Generally, it is assumed that the velocity distribution of atomic oxygen is Maxwellian, and that the fine structure of atomic oxy-gen does not affect the process (1) and its inverse. First we will use these assumptions
10
that are typical for atmospheric modeling and then will address their applicability in the discussion part of the work (Sect. 4).
It is self-evident that both the calculation of radiative cooling/heating rates in CO2and
the interpretation of measuredI15 µmradiances require the best possible knowledge of kVT. However, despite the importance of kVT for the atmospheric applications, the 15
values, obtained in laboratory or retrieved by fitting the space observations, vary by a factor of3–4(see Table 1 and Sect. 3 below for more details). In this work we describe the retrieving ofkVT from coincidental space and lidar observations. For this purpose
we used the extensive dataset provided by the SABER instrument (Russell et al., 1999) aboard TIMED satellite that contains, besides other information, vertical profiles of
20
I15 µm(z), O(z), and, more recently, CO2(z) (Rezac, 2011) VMRs. This dataset was
supplemented with T(z) in 80–110 km altitude range measured by Fort Collins lidar (40.6◦N,105.2◦W). We show that the synergy of these two instruments enables one to retrievekVT and study its behavior in the MLT. All calculations presented in this work
were carried out using the non-LTE ALI-ARMS code package (Kutepov et al., 1998;
25
ACPD
11, 32583–32600, 2011CO2(ν
2)-O quenching rate coefficient
A. G. Feofilov et al.
Title Page
Abstract Introduction
Conclusions References
Tables Figures
◭ ◮
◭ ◮
Back Close
Full Screen / Esc
Printer-friendly Version Interactive Discussion
Discussion
P
a
per
|
Dis
cussion
P
a
per
|
Discussion
P
a
per
|
Discussio
n
P
a
per
|
2 Non-LTE problem for the molecular gas in atmosphere andkVTrate coefficient
Inelastic molecular collisions determine the population of molecular levels in the lower atmosphere. As a result local thermodynamic equilibrium (LTE) exists where the pop-ulations obey the Boltzmann law with the local kinetic temperature. In the MLT the frequency of collisions is lower and the vibrational levels populations must be found
5
taking into account all processes which populate and depopulate vibrational levels: op-tical transitions, chemical sources, vibrational-vibrational and vibrational-translational energy exchange processes, and the absorption of atmospheric and solar radiation in the ro-vibrational bands. The altitude above which the LTE approximation is not appli-cable depends on the relationship between these processes and for CO2(ν2) vibrational 10
levels involved in forming ofI15 µm the non-LTE effects become important above∼75–
80 km altitude (L ´opez-Puertas and Taylor, 2001; Kutepov et al., 2006).
The importance ofkVTrate coefficient for the calculation of CO2emission in MLT was
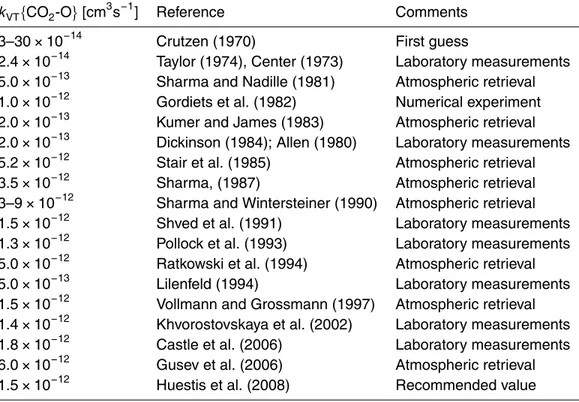
first discussed by Crutzen (1970). He suggested an estimate for this value with the up-per limit of 3.0×10⁻¹³cm3s−1. First laboratory measurement ofkVT were performed 15
at high temperatures (T >2000 K) (Center, 1973) using shock tube technique. The ex-trapolations of these measurements to room temperatures by fitting the Landau-Teller expression (Taylor, 1974) provided values of 2.4×10⁻¹⁴cm3s−1. The average value of this rate coefficient obtained in later studies has changed by two orders of magni-tude and since the middle of 1980-s the kVT is accepted to be on the order of (1.0– 20
10.0)×10−12cm3s−1 (see the overview of kVT measurements and estimates in
Ta-ble 1). However, as we show below these variations are still large both for the adequate estimation of the radiative budget of MLT region and for temperature retrievals from 15 µm CO2radiance. There is a well known discrepancy between the laboratory
mea-surements ofkVTand its retrieval from the atmospheric measurements. Generally, lab-25
oratory measurements provide low values ofkVTcentered around 1.3×10 −12
cm3s−1. Huestis et al. (2008) based on the analysis of experimental data and quantum mechan-ical calculations recommends using kVT=1.5×10⁻¹²cm
3
ACPD
11, 32583–32600, 2011CO2(ν
2)-O quenching rate coefficient
A. G. Feofilov et al.
Title Page
Abstract Introduction
Conclusions References
Tables Figures
◭ ◮
◭ ◮
Back Close
Full Screen / Esc
Printer-friendly Version Interactive Discussion
Discussion
P
a
per
|
Dis
cussion
P
a
per
|
Discussion
P
a
per
|
Discussio
n
P
a
per
|
value leads to overestimating MLT temperatures from 15 µm radiance measurements and the values required for an adequate interpreting of atmospheric measurements are usually about 5.5×10⁻¹²cm3s−1 with the exception of kVT=1.5×10⁻¹²cm
3
s−1 retrieved by Vollmann and Grossmann (1997) from the sounding rocket observations.
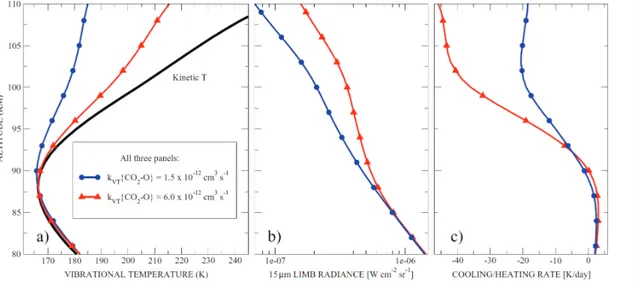
To demonstrate the influence ofkVTon the MLT area we performed a sensitivity study 5
for an average midlatitude atmospheric profile using a standard set of V-V and V-T rate coefficients (Kutepov et al., 2006) andkVT that was first set to 1.5×10⁻¹²cm
3
s−1and then to 6.0×10⁻¹²cm3s−1. The results are presented in Fig. 1a–c. Figure 1a demon-strates the population of the first ν2-excited level shown as vibrational temperature
(see the figure caption for the vibrational temperature definition). After obtaining the
10
non-LTE populations of all vibrational levels involved in the task the broadbandI15 µm
(Fig. 1b) was simulated in line by line mode and the resulting spectrum was convolved with the “narrow” 15 µm SABER bandpass function. The total cooling/heating rate is shown in Fig. 1c. As one can see the MLT area is sensitive to thekVT changes above
∼85 km altitude. Below this level the sensitivity rapidly decreases and 80 km altitude
15
can be considered as a “threshold” between LTE and non-LTE for CO2(ν2) levels and
the lower limit for thekVTretrieval. The upper limit is defined by the fading of the signal strength with increasing altitude.
3 RetrievingkVT from the overlapping SABER and lidar measurements
3.1 ThekVT retrieval approach
20
The general idea for thekVT rate coefficient retrieval from overlapping satellite and
li-dar measurements is in minimizing the difference between the measured and simulated 15 µm radiance by varying thekVT. The simulations are performed with the “reference”
temperature profiles measured by the lidar instrument and, therefore, not affected by uncertainties thekVT. A similar approach was utilized by Feofilov et al. (2009) who 25
ACPD
11, 32583–32600, 2011CO2(ν
2)-O quenching rate coefficient
A. G. Feofilov et al.
Title Page
Abstract Introduction
Conclusions References
Tables Figures
◭ ◮
◭ ◮
Back Close
Full Screen / Esc
Printer-friendly Version Interactive Discussion
Discussion
P
a
per
|
Dis
cussion
P
a
per
|
Discussion
P
a
per
|
Discussio
n
P
a
per
|
estimated three rate coefficients important for the calculation of H2O(ν2) populations in
MLT. Retrieving thekVTfrom comparing the measured and simulated 15 µm radiances
is somewhat more complicated because the CO2(ν2) populations depend not only on kVTbut also on atomic oxygen concentration (or VMR) that contributes to uncertainties
in retrievedkVT. The way of overcoming this limitation will be described below. First, let 5
us consider the simplified case of a single overlap for which everything excludingkVTis
known. Since calculations demonstrate monotonic dependence of CO2(ν2) populations and limb radiances onkVTat all altitudes (see Fig. 1a,b in this work and Sect. 3.6.5.1 in
L ´opez-Puertas and Taylor, 2001), the deviationζ(kVT,z)=|Imeas(z)−Isimul(kVT,z)| will
have a single minimum at each altitude z and in the ideal case of noiseless signal the
10
retrieved rate coefficient will be unique. Adding the noise to the experimental radiance
Imeas(z) and uncertainties to calculated radiance Isimul(kVT,z) that are linked with
un-certainties in lidar temperatures and spatiotemporal variability of the area will blur the minimum of ζ (kVT,z) that will, finally, define the uncertainty for the kVT retrieval. Let
us now consider the case when both atomic oxygen concentration [O] andkVTare not 15
known. This exercise is important since even though SABER retrieves individual [O](z) profiles (Mlynczak et al., 2007), any offsets or errors in [O](z) (Smith et al., 2010) will propagate tokVT. However, this problem might be overcome if the average [O]aver(z)
profile is known with a sufficient accuracy (from climatology, modeling or other mea-surements). In this case one can search for a minimum ofζ(γ,z) with respect to a new
20
variableγ=kVT×[O] over a large number of SABER/lidar overlaps. At this stage
in-dividual uncertainties of [O](z) do not play any role. Important is to choose a grid on
γ in such a way that the following criteria are satisfied: a) γ variation range includes the γmin value that corresponds to absolute minimum of ζ (z,γ); b) the grid step is
fine enough to hit the minimum of ζ (z,γ). When the minimum of ζ (z,γ) is found
25
over a large number of overlaps, one can retrieve the optimal value of rate coefficient:
kVT=γmin/[O]aver for each altitude point where [O]aver is the average value of atomic
ACPD
11, 32583–32600, 2011CO2(ν
2)-O quenching rate coefficient
A. G. Feofilov et al.
Title Page
Abstract Introduction
Conclusions References
Tables Figures
◭ ◮
◭ ◮
Back Close
Full Screen / Esc
Printer-friendly Version Interactive Discussion
Discussion
P
a
per
|
Dis
cussion
P
a
per
|
Discussion
P
a
per
|
Discussio
n
P
a
per
|
3.2 Using the Colorado State Sodium lidar temperature measurements forkVT
retrievals
In this study we used I15 µm(z), T(z), P(z), CO2(z), and O(z) from SABER V1.07
database and coincidental T(z) measured by the Colorado State Sodium lidar de-scribed in details in (She et al., 2003). Briefly, the lidar is a two-beam system
ca-5
pable of simultaneous measurement of mesopause region temperature and winds, day and night, weather permitting. This lidar has been modified in 1999 in response to TIMED satellite objectives. The lidar setup can perform simultaneous measuring of mesopause region Na density, temperature, zonal and meridional wind profiles with both daytime and nighttime capability. The measurement precision of the lidar system
10
for temperature and wind with 2 km spatial resolution and 1 h integration time were es-timated for each beam under nighttime fair sky conditions to be, respectively, 0.5 K and 1.5 m s−1at the Na peak (92 km), and 5 K and 15 m s−1 at the edges (81 and 107 km) of the Na layer. Depending on the purpose of the analysis, the temporal resolution may be made between 10 min and several hours. We have searched for SABER/lidar
15
simultaneous common volume measurements in 2002–2005 using stringent criteria for time and space overlapping: ∆lat<2◦, ∆long<2◦, ∆t <10 min. Most of the profiles selected in this way (85%) fall in 18–6 h local time interval. We substituted SABERT(z) in 80–110 km altitude range with the corresponding lidar T(z) and hydrostatically ad-justedP(z) to newT(z). Atomic O is changing in this period and using individual O(z)
20
is not reasonable, therefore we used theγ=kVT×O variable discussed in Sect. 3.1.
To reduce the number of runs with obviously incorrectγ values, we used the following approach: at each altitude the grid onγwas built using the available O(z) and 21 points forkVT in the (1.0–10)×10−12cm
3
s−1range with 5×10⁻¹³cm3s−1 step. The correct-ness of theγgrid selection was verified at each altitude and for each overlapping event
25
by checking for the existence of theζ(γ,z) minimum. For each overlapping event the non-LTE populations of CO2 vibrational levels were found at all altitudes and I15 µm
ACPD
11, 32583–32600, 2011CO2(ν
2)-O quenching rate coefficient
A. G. Feofilov et al.
Title Page
Abstract Introduction
Conclusions References
Tables Figures
◭ ◮
◭ ◮
Back Close
Full Screen / Esc
Printer-friendly Version Interactive Discussion
Discussion
P
a
per
|
Dis
cussion
P
a
per
|
Discussion
P
a
per
|
Discussio
n
P
a
per
|
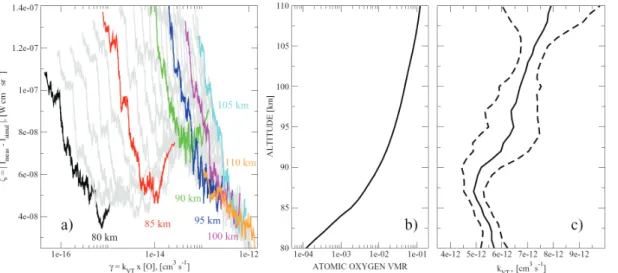
bandpass function. This procedure was repeated for all grid points of the γ variable. Then at each altitude point z we calculated the radiance difference ζ(γ,z) (Fig. 2a). As one can see all ζ(γ,z) curves up to 105 km (cyan curve) have a clear minimum
ζmin(γ,z) that washes out for ζ(γ,z) dependencies above that altitude. This behavior
is explained both by larger lidarT(z) and by largerI15µm(z) uncertainties at higher al-5
titudes. The values ofγ corresponding toζmin(γ,z) form a separate scientific product γmin(z) that may be used in midlatitude atmospheric applications for cooling/heating
rate andI15 µm calculations. The retrieved γmin(z) values are 7.4×10 −16
; 1.0×10⁻¹⁴; 5.3×10⁻¹⁴; 1.9×10⁻¹³; 5.2×10⁻¹³; 6.4×10⁻¹³; 9.8×10⁻¹³ [cm3s−1] forz=80; 85; 90; 95; 100; 105; 110 km, respectively. To obtain thekVT(z) profile (Fig. 2c) we divided 10
theγmin(z) profile by average atomic O VMR profile, Oaver(z), (Fig. 2b). The error bars
in Fig. 2c represent standard deviations estimated from input data uncertainties.
4 Discussion
Overall, thekVT(z) values shown in Fig. 2b fit well to the atmospheric retrievals: the
averaged value of kVT is equal to 6.1±1.7×10⁻¹²cm 3
s−1. However, Fig. 2c also
15
demonstrates the altitudinal variability of kVT(z) that goes beyond its uncertainties in 85–105 km altitude range. Obviously, this variability does not imply that kVT rate
co-efficient depends on altitude. Let us consider possible reasons for the observed kVT
behavior. The retrievedkVT(z) depends on: a) lidarT(z) in 80–110 km, b) SABERP(z)
andT(z) below 80 km, c)I15 µm(z) d) CO2(z), e) O(z), f) CO2 non-LTE model. Offsets 20
in any of these parameters will lead to offsets in the retrievedkVT(z). One can exclude
a)-d) since their uncertainties have been included in the analysis. The most important component for kVT(z) retrieval is Oaver(z). A detailed analysis of SABER V1.07 data
shows that the O density is at least twice that from other data sources (Smith et al., 2010 and references therein). However, reducing Oaver(z) by factor of two will mean 25
ACPD
11, 32583–32600, 2011CO2(ν
2)-O quenching rate coefficient
A. G. Feofilov et al.
Title Page
Abstract Introduction
Conclusions References
Tables Figures
◭ ◮
◭ ◮
Back Close
Full Screen / Esc
Printer-friendly Version Interactive Discussion
Discussion
P
a
per
|
Dis
cussion
P
a
per
|
Discussion
P
a
per
|
Discussio
n
P
a
per
|
laboratory measured values. On the other hand, further increasing Oaver(z) to com-pensate for thekVT(z) increase with altitude cannot be justified using the current model
of O(z) production in MLT (Smith et al., 2010). The T(z) uncertainties used in O(z) retrieval in SABER V1.07 can not lead to significant changes in Oaver(z), either. The remaining possibility is the simplicity of the CO2non-LTE model with respect to CO2-O 5
collisions. The standard pumping term in the non-LTE model, which describes total production of CO2(ν2) in the state with the number of bending mode quantaν2due to collisions with the O(3P) atoms has the form of
Yν2=nO(3P){nν
2−1kν2−1,ν2−nν2kν2,ν2−1} (2)
where nO(3P) is the O(3P) density, nν
2−1 and nν2 are the vibrational states
popula-10
tions, and kν
2−1,ν2 and kν2,ν2−1 are rate coefficients for one-quantum excitation and
de-excitation, respectively. In current non-LTE models, including the one applied in this study, it is usually assumed thatkν2−1,ν2=k0,1 and kν2,ν2−1=k1,0. It follows from Huestis et al. (2008) that if the velocity distribution of O(3P) atoms is Maxwellian and their fine stricture is thermalized then the laboratory measuredk0,1andk1,0are linked 15
by the detailed balance relation:
k0,1=k1,0·g1
g0
·e−E1/(kT) (3)
whereg0 and g1 are the statistical weights of the lower and upper vibrational states,
respectively,E1is the vibrational energy of the first ν2 vibrational level,k is the
Boltz-mann constant, andT is the local kinetic temperature. Sharma et al. (1994) showed
20
that both above mentioned conditions are valid for O(3P) atoms in the Earth’s atmo-sphere up to at least 400 km, which seems justifying usage of Eqs. (2) and (3) in the non-LTE models. However, as Balakrishnan et al. (1998) and Kharchenko et al. (2005) show, the non-thermal O(3P) and O(1D) atoms are produced by O2and O3 photolysis
and O+2 dissociative recombination reactions in the MLT. These “hot” atoms may serve
25
ACPD
11, 32583–32600, 2011CO2(ν
2)-O quenching rate coefficient
A. G. Feofilov et al.
Title Page
Abstract Introduction
Conclusions References
Tables Figures
◭ ◮
◭ ◮
Back Close
Full Screen / Esc
Printer-friendly Version Interactive Discussion
Discussion
P
a
per
|
Dis
cussion
P
a
per
|
Discussion
P
a
per
|
Discussio
n
P
a
per
|
may need to be replaced by the expression like
Yν2=nO(3P)· "
(α−1)·nnν2−1kν2−1,ν2−nν2kν2,ν2−1
o
+α· (
X
ν
nν2−νkνhot2−ν,ν2−nν2
X
ν kνhot
2,ν2−ν )#
(4)
whereα is the fraction of total O(3P) density which corresponds to hot atoms, kνhot2−ν,ν2
andkνhot
2,ν2−νare the rate coefficients for excitation and de-excitation of CO2molecules,
5
respectively, due to collisions with hot atoms, assuming also multi-quantum processes. These rate coefficients are not related by the detailed balance since hot O(3P) are not thermalized. Comparing Eq. (2) which is applied in the model used in our study with Eq. (4), one can see that the rate coefficient values retrieved in this work and in other atmospheric studies are some sort of effective rate coefficient which may be expressed
10
as
k1,0retr(z)=kνretr
2,ν2−1(z)=(α(z)−1)·kν2−1,ν2+α(z)· X
ν
nν2kνhot2−ν,ν2 (5)
that includes the contribution of hot O(3P) atoms. The simplistic analysis given above is not intended to explain our result. It, however, may indicate the direction toward its interpretation. We obviously seek1,0retr(z) increasing with altitude. This may reflect
15
the increasing contribution of hot O(3P) atoms whose concentration is increasing with altitude.
5 Summary
We have presented a methodology for retrieving values ofkVT andγ=kVT×O (where
O is the VMR of atomic oxygen) from atmospheric observations and applied it to
over-20
ACPD
11, 32583–32600, 2011CO2(ν
2)-O quenching rate coefficient
A. G. Feofilov et al.
Title Page
Abstract Introduction
Conclusions References
Tables Figures
◭ ◮
◭ ◮
Back Close
Full Screen / Esc
Printer-friendly Version Interactive Discussion
Discussion
P
a
per
|
Dis
cussion
P
a
per
|
Discussion
P
a
per
|
Discussio
n
P
a
per
|
7.4×10⁻¹⁶; 1.0×10⁻¹⁴; 5.3×10⁻¹⁴; 1.9×10⁻¹³; 5.2×10⁻¹³; 6.4×10⁻¹³; 9.8×10⁻¹³ [cm3s−1] at 80; 85; 90; 95; 100; 105; 110 km, respectively. The average value of the re-trievedkVT in 80–110 km altitude range is 6.1±1.7×10
−12
cm3s−1. We also observed an altitude dependence of the retrievedkVT that varies from 4.9±0.3×10
−12
cm3s−1 at 87 km to 7.2±0.3×10⁻¹²cm3s−1at 104 km. The observed variation may be linked
5
to a simplification in the traditional consideration of CO2(ν2)+O( 3
P) interactions. We show that both the altitude variation of “atmospheric”kVT and its discrepancy from the
laboratory measurements may be explained by subdividing the oxygen atoms to “nor-mal” and “excited” or “hot” groups, with the different kVT rate coefficients for each of
the groups. Comparisons with other lidar locations as well as quantum mechanical
10
calculations for the collisions of CO2 with “hot” O atoms are needed to further study
the observed phenomenon. Depending on the mechanism that will be revealed in the course of these additional studies, the radiative cooling rate calculations for general circulation models should be performed in accordance with the fractionizing defined by Eq. (4). For the temperature retrievals from the 15 µm CO2 atmospheric radiance 15
observations we recommend usingk1,0retr(z) values obtained in this work.
Acknowledgements. This research was partially supported under NASA grant NNX08AG41G. NCAR is sponsored by the National Science Foundation. The authors would like to thank Peter Wintersteiner and Richard Picard for their comments on the preliminary version of the manuscript and David Huestis for the discussion regarding the detailed balance in 20
CO2(ν2)+O(3P) collisions.
ACPD
11, 32583–32600, 2011CO2(ν
2)-O quenching rate coefficient
A. G. Feofilov et al.
Title Page
Abstract Introduction
Conclusions References
Tables Figures
◭ ◮
◭ ◮
Back Close
Full Screen / Esc
Printer-friendly Version Interactive Discussion
Discussion
P
a
per
|
Dis
cussion
P
a
per
|
Discussion
P
a
per
|
Discussio
n
P
a
per
|
References
Allen, D., Scragg, C. T., and Simpson, C. J. S. M.: Low temperature fluorescence studies of the deactivation of the bend-stretch manifold of CO2, Chem. Phys., 51, 279–298, 1980.
Balakrishnan, N., Kharchenko, V., and Dalgarno, A.: Slowing of energetic O(3P) atoms in colli-sions with N2, J. Geophys. Res., 103, 23,393–23,398, 1998.
5
Bougher, S. W., Hunten, D. M., and Roble, R. G.: CO2 cooling in terrestrial planet thermo-spheres, J. Geophys. Res., 99, 14609–14622, 1994.
Castle, K. J., Kleissas, K. M., Rhinehart, J. M., Hwang, E. S., and Dodd, J. A.: Vi-brational relaxation of CO2(ν2) by atomic oxygen, J. Geophys. Res., 111, A09303, doi:10.1029/2006JA011736, 2006.
10
Center, R. E.: Vibrational relaxation of CO2 by O atoms, J. Chem. Phys., 59(7), 3523–3528, 1973.
Crutzen, P. J.: Discussion of paper “Absorption and emission by carbon dioxide in the atmo-sphere” by Houghton, J. T., Q. J. Roy. Metor. Soc., 96, 767–770, 1970.
Dickinson, R. E.: Infrared radiative cooling in the mesosphere and lower thermosphere, J. 15
Atmos. Sol. Terr. Phys., 46, 995–1008, 1984.
Feofilov, A. G., Kutepov, A. A., Pesnell, W. D., Goldberg, R. A., Marshall, B. T., Gord-ley, L. L., Garc´ıa-Comas, M., L ´opez-Puertas, M., Manuilova, R. O., Yankovsky, V. A., Pe-telina, S. V., and Russell III, J. M.: Daytime SABER/TIMED observations of water vapor in the mesosphere: retrieval approach and first results, Atmos. Chem. Phys., 9, 8139–8158, 20
doi:10.5194/acp-9-8139-2009, 2009.
Fischer, H., Birk, M., Blom, C., Carli, B., Carlotti, M., von Clarmann, T., Delbouille, L., Dud-hia, A., Ehhalt, D., Endemann, M., Flaud, J. M., Gessner, R., Kleinert, A., Koopman, R., Langen, J., L ´opez-Puertas, M., Mosner, P., Nett, H., Oelhaf, H., Perron, G., Remedios, J., Ridolfi, M., Stiller, G., and Zander, R.: MIPAS: an instrument for atmospheric and climate 25
research, Atmos. Chem. Phys., 8, 2151–2188, doi:10.5194/acp-8-2151-2008, 2008. Goody, R. M. and Yung, Y. L.: Atmospheric Radiation, Oxford Univ. Press, New York, NY, 1989. Gordiets, B. F.: A model of the upper atmosphere radiating in infrared spectrum, Kratkie
Soobsh. Fiz., 6, 40, 1976.
Gordiets, B. F., Kulikov, Y. U. N., Markov, M. N., and Marov, M. Ya.: Numerical modelling of the 30
thermospheric heat budget, J. Geophys. Res., 87(A6), 4504–4514, 1982.
Atmo-ACPD
11, 32583–32600, 2011CO2(ν
2)-O quenching rate coefficient
A. G. Feofilov et al.
Title Page
Abstract Introduction
Conclusions References
Tables Figures
◭ ◮
◭ ◮
Back Close
Full Screen / Esc
Printer-friendly Version Interactive Discussion
Discussion
P
a
per
|
Dis
cussion
P
a
per
|
Discussion
P
a
per
|
Discussio
n
P
a
per
|
sphere Modeling, ASP Conference Series, 288, edited by: Hubeny, I., Mihalas, D., and Werner, K., 318–330, Stellar Atmosphere Modeling, Tuebingen, Germany, 8–12 April, 2002, 2003.
Gusev, O., Kaufmann, M., Grossmann K. U., Schmidlin, F. J., and Shepherd, M. G.: Atmo-spheric neutral temperature distribution at the mesopause/turbopause altitude, J. Atmos. 5
Sol. Terr. Phys., 68, 1684–1697, doi:10.1016/j.jastp.2005.12.010, 2006.
Huestis, D. L., Bougher, S. W., Fox J. L., Galand, M., Johnson, R. E., Moses J. I., and Picker-ing, J. C.: Cross sections and reaction rates for comparative planetary aeronomy, Space Sci. Rev., 139, 63–105, doi:10.1007/s11214-008-9383-7, 2008.
Kharchenko, V., Dalgarno, A., and Fox, J. L.: Thermospheric distribution of fast O(1D) atoms, J. 10
Geophys. Res., 110, A12305, doi:10.1029/2005JA011232, 2005.
Khvorostovskaya, L. E., Potekhin, I. Yu., Shved, G. M., Ogibalov V. P., and Uzyukova, T. V.: Measurement of the rate constant for quenching CO2(0110) by atomic oxygen at low tem-peratures: reassessment of the rate of cooling by the CO2 15-µm Emission in the Lower Thermosphere, Izvestiya Atmos. Ocean. Phys., 38, 613–624, 2002.
15
Kumer, J. B. and James, T. C.: SPIRE data evaluation and nuclear IR fluorescence processes, Report DNAOOI-79-C-0033, AFGL, Bedford, Mass., 1983.
Kutepov, A. A., Gusev, O. A., and Ogibalov, V. P.: Solution of the non-LTE problem for molec-ular gas in planetary atmospheres: superiority of accelerated lambda iteration, J. Quant. Spectrosc. Radiat. Transf. 60, 199, 1998.
20
Kutepov, A. A., Feofilov, A. G., Marshall, B. T., Gordley, L. L., Pesnell, W. D., Goldberg, R. A., and Russell III, J. M.: SABER temperature observations in the summer polar mesosphere and lower thermosphere: Importance of accounting for the CO2 ν2 quanta V–V exchange, Geophys. Res. Lett., 33, L21809, doi:10.1029/2006GL026591, 2006.
Lilenfeld, H. V.: Deactivation of Vibrationally-Excited NO and CO2 by O-25
Atoms, Final technical rept., 28 September 1989–15 Jun 1994, available at: http://handle.dtic.mil/100.2/ADA298581, last access: 8 Dec 2011, ADA298581, 1994. L ´opez-Puertas, M. and Taylor, F. W.: Non-LTE Radiative Transfer in the Atmosphere, Singapore:
World Scientific, 2001.
Mlynczak, M. G., Marshall, B. T., Martin-Torres, F. J., Russell III, J. M., Thompson, R. E., Rems-30
ACPD
11, 32583–32600, 2011CO2(ν
2)-O quenching rate coefficient
A. G. Feofilov et al.
Title Page
Abstract Introduction
Conclusions References
Tables Figures
◭ ◮
◭ ◮
Back Close
Full Screen / Esc
Printer-friendly Version Interactive Discussion
Discussion
P
a
per
|
Dis
cussion
P
a
per
|
Discussion
P
a
per
|
Discussio
n
P
a
per
|
112(D15306), doi:10.1029/2006JD008355, 2007.
Mlynczak, M. G., Martin-Torres, F. J., Johnson, D. G., Kratz, D. P., Traub, W. A., and Jucks, K.: Observations of the O(3P) fine structure line at 63 µm in the upper mesosphere and lower thermosphere, J. Geophys. Res., 109, A12306, doi:10.1029/2004JA010595, 2004.
Offermann, D., Grossmann, K. U., Barthol, P., Knieling, P., Riese, M, and Trant, R.: Cryogenic 5
Infrared Spectrometers and Telescopes for the Atmosphere (CRISTA) experiment and middle atmosphere variability, J. Geophys. Res., 104, 16311–16325, doi:10.1029/1998JD100047, 1999.
Pollock, D. S., Scott, G. B. I., and Phillips, L. F.: Rate constant for quenching of CO2(010) by atomic oxygen, Geophys. Res. Lett., 20, 727–729, 1993.
10
Ratkowski, A. J., Picard, R. H., Winick, J. R., Grossmann, K. U., Homann, D., Ulwick, T. J. C., and Paboojian, A. J.: Lower-thermospheric infrared emissions from minor species during high-latitude twilight-B. Analysis of 15 µm emission and comparison with non-LTE models, J. Atmos. Terr. Phys., 56, 1899–1914, 1994.
Rezac, L.: Simultaneous retrieval ofT(p) and CO2volume mixing ratio from limb observations 15
of infrared radiance under non-LTE conditions, Ph.D. thesis, Hampton University of Virginia, 163 pp., 2011.
Russell III, J. M., Mlynczak, M. G., Gordley, L. L., Tansock, J. J., and Esplin, R.: Overview of the SABER experiment and preliminary calibration results, P. Soc. Photo.-Opt. Ins., 3756, 277–288, 1999.
20
Sharma, R. D.: Infrared airglow, in: Progress in Atmospheric Physics: Proceedings of the 15th Annual Meeting on Atmospheric Studies by Optical Methods, edited by: Rodrigo, R., L ´opez-Moreno, J. J., L ´opez-Puertas, M., Molina, A., Kluwer Academic Publishers, Boston, 177–186, 1987.
Sharma, R. D. and Nadile, R. M.: Carbon dioxide (υ2) radiative results using a new non-25
equilibrium model, AIAA-81-0426, AIAA 19th Aerospace Sciences Meeting, St. Louis, 12–15 Jan 1981, 1981.
Sharma, R. D. and Wintersteiner, P. P.: Role of carbon dioxide in cooling planetary thermo-spheres, Geophys. Res. Lett., 17, 2201–2204, 1990.
Sharma, R., Zygelman, B., von Esse, F., and Dalgarno, A.: On the relationship between the 30
population of the fine structure levels of the ground electronic state of atomic oxygen and the translational temperature, Geophys. Res. Lett., 21, 1731–1734, 1994.
ACPD
11, 32583–32600, 2011CO2(ν
2)-O quenching rate coefficient
A. G. Feofilov et al.
Title Page
Abstract Introduction
Conclusions References
Tables Figures
◭ ◮
◭ ◮
Back Close
Full Screen / Esc
Printer-friendly Version Interactive Discussion
Discussion
P
a
per
|
Dis
cussion
P
a
per
|
Discussion
P
a
per
|
Discussio
n
P
a
per
|
F., Vance, J. D., Acott, P., and Krueger, D. A.: The first 80-h continuous lidar campaign for simultaneous observation of mesopause region temperature and wind, Geophys. Res. Lett., 30, 1319–1323, doi:10.1029/2002GL016412, 2003.
Shved, G. M., Khvorostovskaya, L. E., Potekhin, I. Yu., Demyanikov, A. I., Kutepov, A. A., and Fomichev, V. I.: Measurement of the quenching rate constant for collisions CO2 (0110)–O: 5
the importance of the rate constant magnitude for the thermal regime and radiation of the lower thermosphere, Izv. Atmos. Ocean. Phys., 27, 431–437, 1991.
Smith, A. K., Marsh, D. R., Mlynczak, M. G., and Mast, J. C.: Temporal variations of atomic oxygen in the upper mesosphere from SABER, J. Geophys. Res., 115, D18309, doi:10.1029/2009JD013434, 2010.
10
Stair, A. T., Jr., Sharma, R. D., Nadile, R. M., Baker, D. J., and Grieder, W. F.: Observations of limb radiance with cryogenic spectral infrared rocket experiment, J. Geophys. Res., 90(A10), 9763–9775, 1985.
Taylor, R.: Energy transfer processes in the stratosphere, Can. J. Chem., 52, 1436–1451, 1974.
15
ACPD
11, 32583–32600, 2011CO2(ν
2)-O quenching rate coefficient
A. G. Feofilov et al.
Title Page
Abstract Introduction
Conclusions References
Tables Figures
◭ ◮
◭ ◮
Back Close
Full Screen / Esc
Printer-friendly Version Interactive Discussion
Discussion
P
a
per
|
Dis
cussion
P
a
per
|
Discussion
P
a
per
|
Discussio
n
P
a
per
|
Table 1.Historical review ofkVT{CO2-O}quenching rate coefficient measurements and atmo-spheric retrievals atT=300 K.
kVT{CO2-O}[cm3s−1] Reference Comments
3–30×10−14 Crutzen (1970) First guess
ACPD
11, 32583–32600, 2011CO2(ν
2)-O quenching rate coefficient
A. G. Feofilov et al.
Title Page
Abstract Introduction
Conclusions References
Tables Figures
◭ ◮
◭ ◮
Back Close
Full Screen / Esc
Printer-friendly Version Interactive Discussion
Discussion
P
a
per
|
Dis
cussion
P
a
per
|
Discussion
P
a
per
|
Discussio
n
P
a
per
|
Fig. 1. The sensitivity of (a) CO2(010) main isotope vibrational level populations, (b)
ACPD
11, 32583–32600, 2011CO2(ν
2)-O quenching rate coefficient
A. G. Feofilov et al.
Title Page
Abstract Introduction
Conclusions References
Tables Figures
◭ ◮
◭ ◮
Back Close
Full Screen / Esc
Printer-friendly Version Interactive Discussion
Discussion
P
a
per
|
Dis
cussion
P
a
per
|
Discussion
P
a
per
|
Discussio
n
P
a
per
|